Download as PDF, PPTX
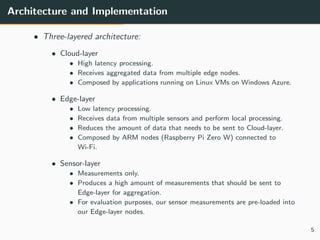
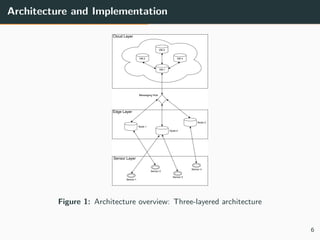
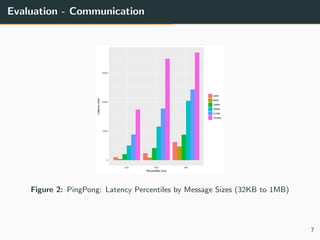
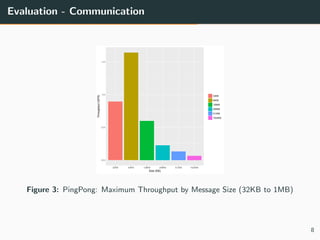
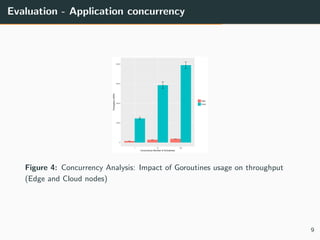
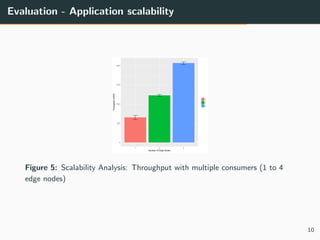
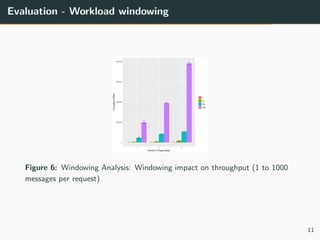


This document summarizes research into distributing the workload of an IoT smart grid application between edge and cloud computing resources. The researchers implemented a three-layer architecture with sensors, edge nodes (Raspberry Pis), and cloud VMs. Their evaluation found that edge processing achieved higher throughput than cloud alone by reducing data sent to the cloud. Moving more workload to edge nodes and aggregating data at the edge also improved scalability. Future work could explore adaptive scheduling and evolving the architecture for general IoT applications.


![Human Reproduction [ Reproductive System ] Notes @irfanullah_mehar Irfanullah...](https://cdn.slidesharecdn.com/ss_thumbnails/humanreproductionreproductivesystemnotesirfanullahmeharirfanullahmeharjanantantra-260111172350-56e85778-thumbnail.jpg?width=640&height=640&fit=bounds)


