
Recommended
More Related Content
Similar to ◀ HBO’s Game of Thrones. Innovative, challenging streamed .docx
Similar to ◀ HBO’s Game of Thrones. Innovative, challenging streamed .docx (20)
More from oswald1horne84988
More from oswald1horne84988 (20)
Recently uploaded
Recently uploaded (20)
◀ HBO’s Game of Thrones. Innovative, challenging streamed .docx
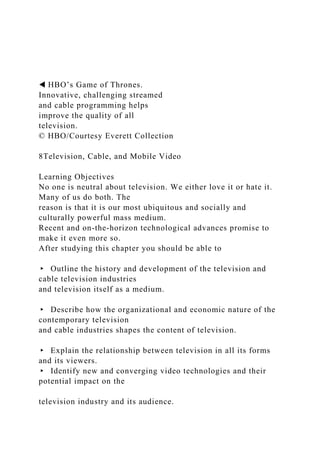
- 1. ◀ HBO’s Game of Thrones. Innovative, challenging streamed and cable programming helps improve the quality of all television. © HBO/Courtesy Everett Collection 8Television, Cable, and Mobile Video Learning Objectives No one is neutral about television. We either love it or hate it. Many of us do both. The reason is that it is our most ubiquitous and socially and culturally powerful mass medium. Recent and on-the-horizon technological advances promise to make it even more so. After studying this chapter you should be able to ▸ Outline the history and development of the television and cable television industries and television itself as a medium. ▸ Describe how the organizational and economic nature of the contemporary television and cable industries shapes the content of television. ▸ Explain the relationship between television in all its forms and its viewers. ▸ Identify new and converging video technologies and their potential impact on the television industry and its audience.
- 2. ▸ Describe the digital and mobile television revolution. ▸ Apply key television-viewing media literacy skills. CHAPTER 8 Television, Cable, and Mobile Video 175 1884 ▶ Nipkow invents his disc 1923 ▶ Zworykin demonstrates electronic iconoscope tube 1927 Farnsworth demonstrates electronically scanned television images 1928 ▶ Baird transmits mechanical video image across Atlantic 1939 Sarnoff introduces regular television broadcasting at World’s Fair 1941 First two commercial stations approved 1950 Red Channels; Nielsen ratings 1951 U.S. wired coast-to-coast; ▶ I Love Lucy 1954 Army–McCarthy Hearings telecast 1959 Quiz show scandal 1962 All-channel legislation 1963 FCC begins regulation of cable 1975 HBO begins national distribution 1976 VCR introduced 1996 DVD introduced; Telecommunications Act 1998 First digital TV broadcast 1999 ▶ DVR introduced
- 3. 2002 FCC mandates digital receivers by 2007 2005 Networks begin selling program downloads 2009 All TV stations are digital 2010 Comcast v. FCC; Hulu premieres first original show; Mobile digital television 2011 ▶ Netflix, Hulu, and YouTube begin original programming 2012 Online movie transactions exceed discs 2013 Cable suffers first annual overall loss of subscribers 2015 HBO, Nickelodeon, and others begin OTT streaming; Sesame Street moves to HBO 1900 1925 1950 1975 2000 © Bettmann/Corbis © Bettmann/Corbis © Ingram Publishing RF (Tv): © Classic PIO/Fotosearch RF;
- 4. (image on the screen): © CBS/Photofest © Handout/KRT/Newscom © McGraw-Hill Education/ Mark Dierker, photographer 176 PART 2 Media, Media Industries, and Media Audiences “WHAT ARE YOU WATCHING? “College hoops.” “But you don’t get cable. You said you were a cord-never, never had cable so there’s no cord to cut.” “That’s right. Never needed it.” “But that game’s on ESPN, a cable channel.” “Yes and no. Yes, ESPN is a cable channel, but it’s now streaming directly to fans, no cable subscription necessary. Unlike with Fox, TNT, and TBS streaming. You’ve gotta pay for cable before those channels will let you stream their stuff.” “You still have to pay for ESPN, right?” “Sure, but not as much as for cable. Sony has a streaming service, too, with channels like Comedy Central, MTV, and Spike. Even HBO launched a no-cable-subscription- necessary streaming service. You don’t need cable for their shows like Game of Thrones or Championship Boxing.”
- 5. “Or Girls?” “Yup.” “No way.” “Way. Television is changing, my friend, more than you realize.” Indeed it is. Netflix outbid established video giants HBO and AMC for House of Cards, originally ordering two seasons, 26 episodes, for over $100 million. YouTube has committed $100 million to commission original programming designed exclusively for its two dozen new channels. Search engine and Web portal Yahoo produces original programming for its Yahoo Screen, notably Community, late of NBC. Online retailer Amazon commissions program pilots, offers them free to viewers who vote on which should be turned into full series, and then produces the winners for its Amazon Prime subscribers. Among its shows are Alpha House, Betas, Mozart in the Jungle, and Bosch. Its Transparent won a Golden Globe for Best TV series in 2015 and its star, Jeffrey Tambor, won Best Actor, both firsts for streaming television. Hulu Plus streams original shows like Deadbeat and Moone Boy. Netflix, Hulu Plus, and Amazon Prime alone invest $6.8 billion a year in original video programming (Wallenstein, 2014). Viewers have enthusiastically taken to this new form of television—half of all U.S. households now subscribe to at least one of these services (“Is It OK,” 2015)—but the new television also offers a great deal of creative freedom to those who produce its content. “It’s much harder to bring innovation to network television because
- 6. network television works as a strong corporate entity where change is maybe not as easily applied,” explains House of Cards cinematographer Igor Martinovic. Streaming companies are “willing to experiment, they’re willing to take chances” (in Khatchatourian, 2014, p. 79). “Fifty years ago,” writes media critic Bob Verini, “TV drama was Bonanza and Gunsmoke, genre stuff grownups sat in front of when there were not hot, intelligent mov- ies around. But the wheel has finally turned. Now the big screen caters to kids and action junkies, while drama series offer adults a damn good justification for never leaving the house” (2013, p. 48). Yes, television is changing, and this chapter details that change, from early experiments with mechanical scanning to the electronic marvel that sits in our homes to the mobile video screens we carry in our pockets. We trace the rapid transformation of television into a mature medium after World War II and examine how the medium, the entire television industry, in fact, was altered by the emergence and success of cable and satellite televi- sion. But significant change is once again remaking what we currently know as television. The changes just men- tioned reflect only a small part of the coming transforma- tion. Nonlinear TV—watching television on our own schedules, not on some cable or broadcast programmer’s— is here right now. Even more dramatic evolution is on the horizon. All of us are now TV executives, choosing our programs and our schedules, no longer limited by what Netflix executive Neil Hunt calls the “tyranny of the grid.” ▼ Netflix’s House of Cards. Free from network television’s commercial restrictions, producers
- 7. of streamed content can take creative chances. © Photos 12/Alamy CHAPTER 8 Television, Cable, and Mobile Video 177 That means, according to Mr. Hunt, that “linear TV is ripe for replacement.” What will result is the ultimate in the fragmented television audience, an individual channel for every individual . . . and no commercials (in Poggi, 2014). The remarkable reach of television—in all its forms—accounts for its attractiveness as an advertising medium. We discuss this reach, and we explore the structure, programming, and economics of the television and cable industries. We consider new technologies and their convergence with television and how they promise to change the interaction between the medium and its audiences. Finally, we discuss media literacy in terms of what we expect from our news anchors. A Short History of Television Television has changed the way teachers teach, governments govern, religious leaders preach, and the way we organize the furniture in our homes. Television has changed the nature, operation, and relationship to their audiences of books, magazines, movies, and radio. The Internet, with its networking abilities, will eventually overtake television as a medium of mass communication, but television defines even its
- 8. future. Will the promise of the Web be drowned in a sea of commercials? Can online information services deliver faster and better information than television? Even the computer screens we use look like television screens, and we sign up for Internet video, online video conferencing, and the new and improved online video game. Before we delve deeper into the nature of this powerful medium and its relationship with its audience, let’s examine how television developed as it did. Mechanical and Electronic Scanning In 1884 Paul Nipkow, a Russian scientist living in Berlin, developed the first workable device for generating electrical signals suitable for the transmission of a scene that people could see. His Nipkow disc consisted of a rotating scanning disc spinning in front of a photoelectric cell. It produced 4,000 pixels (picture dots) per second, producing a picture composed of 18 ◀ A Nipkow disc. © Bettmann/Corbis 178 PART 2 Media, Media Industries, and Media Audiences parallel lines. Although his mechanical system proved too limiting, Nipkow demonstrated the possibility of using a scanning system to divide a scene into an orderly pattern of transmit- table picture elements that could be recomposed as a visual image. British inventor John
- 9. Logie Baird was able to transmit moving images using a mechanical disc as early as 1925, and in 1928 he successfully sent a television picture from London to Hartsdale, New York. Electronic scanning came either from another Russian or from a U.S. farm boy; historians disagree. Vladimir Zworykin, an immigrant living near Pittsburgh and working for Westing- house, demonstrated his iconoscope tube, the first practical television camera tube, in 1923. In 1929 David Sarnoff lured him to RCA to head its electronics research lab, and it was there that Zworykin developed the kinescope, an improved picture tube. At the same time, young Philo Farnsworth had moved from Idaho to San Francisco to perfect an electronic television system, the design for which he had shown his high school science teacher when he was 15 years old. In 1927, at the age of 20, he made his first public demonstration—film clips of a prize fight, scenes from a Mary Pickford movie, and other graphic images. The “Boy Wonder” and Zworykin’s RCA spent the next decade fighting fierce patent battles in court. In 1939 RCA capitulated, agreeing to pay Farnsworth royalties for the use of his patents. In April of that year, at the World’s Fair in New York, RCA made the first true public demonstration of television in the form of regularly scheduled two-hour NBC broadcasts. These black-and-white telecasts consisted of cooking demonstrations, singers, jugglers, comedians, puppets—just about anything that could fit in a hot, brightly lit studio and
- 10. demonstrate motion. People could buy television sets at the RCA Pavilion at prices ranging from $200 for the 5-inch screen to $600 for the deluxe 12-inch- screen model. The FCC granted construction permits to the first two commercial stations in 1941, but World War II intervened. But as was the case with radio during World War I, technical development and improvement of the new medium continued. The 1950s In 1952, 108 stations were broadcasting to 17 million television homes. By the end of the decade, there were 559 stations, and nearly 90% of U.S. households had televisions. In the 1950s more television sets were sold in the United States (70 million) than there were children born (40.5 million) (Kuralt, 1977). The technical standards were fixed, stations proliferated and flourished, the public tuned in, and advertisers were enthusiastic. The content and character of the medium were set in this decade as well: ∙ Carried over from the radio networks, television genres included variety shows, situation comedies, dramas (including Westerns and cop shows), soap operas, and quiz shows. ∙ Two new formats appeared: feature films and talk shows. Talk shows were instrumental in introducing radio personalities to the television audience, which could see its favorites for the first time. ▶ Philo Farnsworth and Vladimir
- 11. Zworykin, pioneers in the development of television. (left, right): © Bettmann/Corbis CHAPTER 8 Television, Cable, and Mobile Video 179 ∙ Television news and documentary remade broadcast journalism as a powerful force in its own right, led by CBS’s Edward R. Murrow (See It Now, 1951) and NBC’s David Brinkley and Chet Huntley. Huntley and Brinkley’s 1956 coverage of the major political conventions gave audiences an early glimpse of the power of television to cover news and history in the making. ∙ AT&T completed its national coaxial cable and microwave relay network for the dis- tribution of television programming in the summer of 1951. The entire United States was now within the reach of the major television networks, and they came to dominate the medium. Four other events from the 1950s would permanently shape how television operated: the quiz show scandal, the appearance of I Love Lucy, McCarthyism, and the establishment of the ratings system. Another, in 1948, would permanently reshape the television industry. That development, as you’ll soon see, was cable television. THE QUIZ SHOW SCANDAL AND CHANGES IN SPONSORSHIP Throughout the 1950s the
- 12. networks served primarily as time brokers, offering airtime and distribution (their affiliates) and accepting payment for access to both. Except for their own news and sports coverage, the networks relied on outside agencies to provide programs. An advertising agency, for example, would hire a production company to produce a program for its client. That client would then be the show’s sponsor—The Kraft Television Theatre and Westinghouse Studio One are two examples. The agency would then pay a network to air the program over its national collection of stations. This system had enriched the networks during the heyday of radio, and they saw no reason to change. But in 1959 the quiz show scandal, enveloping independently produced, single- advertiser- sponsored programs, changed the way the networks did business. When it was discovered that popular shows like The $64,000 Question had been fixed by advertisers and producers to ensure desired outcomes, the networks, mindful of their reputations, were determined to take control of their schedules. They, themselves, began commissioning or buying the entertainment fare that filled their broadcast days and nights. Now, rather than selling blocks of time to ad agencies and sponsors, the networks paid for the content they aired through spot commercial sales (selling individual 60-second spots on a given program to a wide variety of advertisers). As a result, the content of television was altered. Some critics argue that this change to
- 13. spot sales put an end to the golden age of television. When sponsors agreed to attach their names to programs, Alcoa Presents or the Texaco Star Theater, for example, they had an incentive to demand high-quality programming. Spot sales, with network salespeople offer- ing small bits of time to a number of different sponsors, reduced the demand for quality. Because individual sponsors were not identified with a given show, they had no stake in how well it was made—only in how many viewers it attracted. Spot sales also reduced the willingness of the networks to try innovative or different types of content. Familiarity and predictability attracted more viewers and, therefore, more advertisers. There is a counterargument, however. Once the financial well- being of the networks became dependent on the programming they aired, the networks themselves became more concerned with program quality, lifting television from its dull infancy (remem- bered now as the golden age only by those small, early audiences committed to serious character-driven televised drama). Different historians and critics offer arguments for both views. I LOVE LUCY AND MORE CHANGES In 1951 CBS asked Lucille Ball to move her hit radio program, My Favorite Husband, to television. Lucy was willing but wanted her real-life husband, Desi Arnaz, to play the part of her video spouse. The network refused (some historians say the network objected to the prime-time
- 14. presentation of an interracial mar- riage—Desi Arnaz was Cuban—but CBS denies this). But Lucy made additional demands. Television at the time was live: Images were typically captured by three large television cameras, with a director in a booth choosing among the three available images. Lucy wanted her program produced in the same manner—in front of a live audience with three simultaneously running cameras—but these cameras would be film cameras. Editors could 180 PART 2 Media, Media Industries, and Media Audiences ▶ Running from 1947 until 1958, NBC’s Kraft Television Theatre aired some of the golden age’s most respected live anthology dramas. Top left, Richard Kiley and Everett Sloane; lower left, Ossie Davis; lower right, Walter Matthau and Nancy Walker. (top, bottom left and right): Courtesy Everett Collection then review the three sets of film and edit them together to give the best combination of action and reaction shots. Lucy also wanted the production to take place in Hollywood, the nation’s film capital, instead of New York, the television center at the time. CBS was uncertain about this departure from how television was typically produced and refused these requests as well.
- 15. Lucy and Desi borrowed the necessary money and produced I Love Lucy on their own, selling the broadcast rights to CBS. In doing so, the woman now best remembered as “that zany redhead” transformed the business and look of television: ∙ Filmed reruns were now possible, something that had been impossible with live televi- sion, and this, in turn, created the off-network syndication industry. ∙ The television industry moved from New York, with its stage drama orientation, to Hollywood, with its entertainment film mind-set. More action, more flash came to the screen. CHAPTER 8 Television, Cable, and Mobile Video 181 ∙ Weekly series could now be produced relatively quickly and inexpensively. A 39-week series could be completed in 20 or 24 weeks, saving money on actors, crew, equipment, and facilities. In addition the same stock shots—for example, certain exterior views— could be used in different episodes. MCCARTHYISM: THE GROWING POWER OF TELEVISION The Red Scare that cowed the movie business also touched television, aided by the publication in 1950 of Red Channels: The Report of Communist Influence in Radio and Television, the work of three former FBI
- 16. agents operating a company called American Business Consultants. Its 200 pages detailed the alleged pro-Communist sympathies of 151 broadcast personalities, including Orson Welles and journalist Howard K. Smith. Advertisers were encouraged to avoid buying time from broadcasters who employed these “Red sympathizers.” Like the movie studios, the television industry caved in. The networks employed security checkers to look into people’s backgrounds, refused to hire suspect talent, and demanded loyalty oaths from performers. In its infancy television had taken the safe path. Many gifted artists were denied not only a paycheck but also the opportunity to shape the medium’s content. Ironically, it was this same Red Scare that allowed television to demonstrate its enormous power as a vehicle of democracy and freedom. Joseph McCarthy, the Republican junior senator from Wisconsin whose tactics gave this era its name, was seen by millions of viewers ◀ I Love Lucy was significant for far more than its comedy. Thanks to Lucille Ball’s shrewd business sense, it became the foundation for the huge off-network syndicated television industry. © CBS/Photofest 182 PART 2 Media, Media Industries, and Media Audiences
- 17. as his investigation of Reds in the U.S. Army was broadcast by all the networks for 36 days in 1954. Daytime ratings increased 50% (Sterling & Kittross, 1990). At the same time, Edward R. Murrow used his See It Now to expose the senator’s lies and hypocrisy. As a consequence of the two broadcasts, McCarthy was ruined; he was censured by his Senate colleagues and later died a lonely alcoholic’s death. Television had given the people eyes and ears—and power—where before they had had little. The Army–McCarthy Hearings and Murrow’s chal- lenge to McCarthyism are still regarded as two of television’s finest moments. THE NIELSEN RATINGS The concept of measuring audience was carried over from radio to television, but the ratings as we know them today are far more sophisticated (see the chapter on radio, recording, and popular music for more on ratings). The A. C. Nielsen Company began in 1923 as a product-testing company, but soon branched into market research. In 1936 Nielsen started reporting radio ratings and was doing the same for television by 1950. To produce the ratings today, Nielsen selects 37,000 households thought to be rep- resentative of the entire U.S. viewing audience. To record data on what people in those TV households are watching, Nielsen employs the Global Television Audience Meter- ing meter (GTAM meter), which actively (requiring viewer input) and passively (auto- matically reading digital codes embedded in video content)
- 18. measures viewing as people, with increasing mobility, consume video on a growing array of technologies. The data are then sent to Nielsen via the Internet, and the company determines the programs watched, who watched them, and the amount of time each viewer spent with them. But the same convergence that required the development of the GTAM meter is upsetting the business of audience measurement in many ways. CBS president Les Moonves calls Nielsen’s overnight ratings “worthless” and feels that even its C3 rating, counting audiences across three screens—TV (original airing plus DVR), Internet, and mobile video, and the expanded C7 rating are “antiquated” (in Maglio, 2015). The “3” and “7” represent the viewing of the commercials that appear in a specific program within three days (or seven) of its premiere telecast in order to capture DVR playback and Internet viewing. To present a fuller picture of a show’s total audience by accounting for multiplatform and on-demand viewing, many broadcasters are calling for a new rating that measures a program’s 35-day performance. A single episode of Fox’s Empire, for example, draws an ▶ The Army–McCarthy Hearings. Wisconsin’s Republican junior senator, Joseph McCarthy, was called in 1954 to give testimony before his fellow senators regarding his claims that the army
- 19. was rife with Communists, Reds, and “fellow travelers.” Network coverage of the senator’s erratic behavior helped bring the despot into disrepute. © Everett Collection Historical/ Alamy CHAPTER 8 Television, Cable, and Mobile Video 183 audience of 9.9 million when originally aired; four million more viewers watch it in the next seven days, and expanding to 35 days— counting DVD, on-demand, and streamed viewing—its total audi- ence is actually 20.4 million. The four major broadcast networks not only believe that a truer measure of their viewership will show the much-discussed falloff in its prime-time audience to be something of a fiction, but that the undercounting of viewers costs them nearly $100 million a year in lost ad revenue (Littleton, 2015). Nielsen has responded with several fixes, such as counting the smartphone and tablet viewing of its sample homes, releasing Twitter data to aug- ment perceptions of programs’ popularity, and mathematically expanding its ratings to include nonmetered homes (Mandese, 2015). Industry response is unenthusiastic. In fact, NBC has begun releasing its own daily digital video viewing audience
- 20. estimates, and CNBC has dropped Nielsen altogether, signing on with competitor Cogent, which uses Web-based surveys for its audience estimates. To draw a more complete picture of the viewing situation and to measure local television viewing, Nielsen conducts surveys of view- ing patterns four times a year with technology that tracks a show’s audio by “listening” to embedded watermarks in a station’s offerings. These sweeps periods are in February, May, July, and November and help stations to set their advertising rates for the next three months. Sweeps may soon be a thing of the past. These quarterly extravaganzas of heavily promoted network programming and titillating local news (High School Binge Drink- ing? Story and Shocking Video at 6!) are likely to disappear for two reasons. First, the rhythm of broadcast television scheduling is changing because of competition with cable and streaming services. These outlets introduce new shows and big movies throughout the year, rendering such concepts as “The Fall Season” and “Premiere Week” obsolete. Fox has long had year-round premieres, and the other networks have followed suit. CBS’s Survivor and NBC’s Fear Factor both debuted in summer, formerly network television’s programming graveyard. With the basic structure of the programming year disrupted, broadcasters can no longer afford to save their best or
- 21. biggest programming for sweeps weeks. Second, the GTAM meter delivers detailed viewing and demographic data every day of the year, making the four-times-a-year, data- intensive ratings periods unnecessary. A second, more important measure of television’s audience is its share, which is a direct reflection of a particular show’s competitive performance. Share doesn’t measure viewers as a percentage of all television households (as do the ratings). Instead, the share measures a program audience as a percentage of the television sets in use at the time it airs. It tells us what proportion of the actual audience a program attracts, indicating how well a particular program is doing on its given night, in its time slot, against its competition (Figure 1). For example, The Nightly Show with Larry Wilmore normally gets a rating of around 3—terrible by prime-time standards—but because it’s on when fewer homes are tuned in, its share of 11 (11% of the homes with sets in use) is quite respectable. The Coming of Cable Mahanoy City, Pennsylvania, appliance sales representative John Walson was having trouble selling televisions in 1948. The Pocono Mountains sat between his town and Philadelphia’s three new stations. But Walson was also a powerline worker, so he convinced his bosses to let him run a wire from a tower he erected on New Boston Mountain to his store. As more and more people became aware of his system, he began
- 22. wiring the homes of custom- ers who bought his sets. In June of that year, Walson had 727 subscribers for his community antenna television (CATV) system (Chin, 1978). Although no one calls it CATV anymore, cable television was born. The cable Walson used was a twin-lead wire, much like the cord that connects a lamp to an outlet. To attract even more subscribers, he had to offer improved picture quality. Households tuned in to a given program All households with television Households tuned in to a given program All households tuned in to television at that time Share = 400,000 = .50, or a share of 50. 800,000 Ratings and shares can be computed using these formulas: Rating = Share = Here’s an example. Your talk show is aired in a market that has 1 million television households; 400,000 are tuned in to you. Therefore,
- 23. At the time your show airs, however, there are only 800,000 households using television. Therefore, your share of the available audience is If you can explain why a specific program’s share is always higher than its rating, then you understand the difference between the two. = .40, or a rating of 40.400,000 1,000,000 ▲ Figure 1 Computing Ratings and Shares. 184 PART 2 Media, Media Industries, and Media Audiences He accomplished this by using coaxial cable and self- manufactured boosters (or amplifi- ers). Coaxial cable—copper-clad aluminum wire encased in plastic foam insulation, covered by an aluminum outer conductor, and then sheathed in plastic— had more bandwidth than did twin-lead wire. As a result, it allowed more of the original signal to pass and even permitted Walson to carry a greater number of channels. As Walson continued to expand his CATV business, Milton Jerrold Shapp, later to become Pennsylvania’s governor, noticed thousands of antennas cluttering the roofs of department stores and apartment buildings. Seeing Walson’s success, he set up master antennas and connected the sets in these buildings to them,
- 24. employing a signal booster he had developed. This was the start of master antenna television (MATV). With expanded bandwidth and the new, powerful Jerrold boosters, these systems began experimenting with the importation of distant signals, using wires not only to provide improved reception but also to offer a wider variety of programming. They began deliver- ing independent stations from as far away as New York to fill their then-amazing 7 to 10 channels. By 1962, 800 systems were providing cable television to more than 850,000 homes. The industry today is composed of 5,208 individual cable systems delivering video to 54 million households, high-speed Internet to 55 million, and digital telephone to 28 million. The industry generates revenues of over $105 billion, with about a quarter of that amount earned through advertising (NCTA, 2015). Television and Its Audiences The 1960s saw some refinement in the technical structure of television, which influ- enced its organization and audience. In 1962 Congress passed all-channel legislation, which required that all sets imported into or manufactured in the United States be equipped with both VHF and UHF receivers. This had little immediate impact; U.S. viewers were now hooked on the three national networks and their VHF affiliates. Still, UHF independents and educational stations were able to at least
- 25. attract some semblance of an audience. The UHF independents would have to wait for the coming of cable to give them clout. Now that the educational stations were attracting more viewers, they began to look less educational in the strictest sense of the word and began program- ming more entertaining cultural fare (see the essay “The Creation of Sesame Street”). The Public Broadcasting Act of 1967 united the educational stations into an important network, the Public Broadcasting Service (PBS), which today has nearly 400 member stations. The 1960s also witnessed the immense social and political power of the new medium to force profound alterations in the country’s consciousness and behavior. Particularly influ- ential were the Nixon–Kennedy campaign debates of 1960, broadcasts of the aftermath of Kennedy’s assassination and funeral in 1963, the 1969 transmission of Neil Armstrong’s walk on the moon, and the use of television at the end of the decade by civil rights and anti–Vietnam War leaders. The 1960s also gave rise to a descriptive expression often used today when television is discussed. Speaking to the 1961 convention of the National Association of Broadcasters, John F. Kennedy’s new FCC chair, Newton Minow, invited broadcasters to sit down in front of your television set when your station goes on the air and stay there without
- 26. a book, magazine, newspaper, profit and loss sheet, or ratings book to distract you, and keep your eyes glued to that set until the station signs off. I can assure you that you will observe a vast wasteland. Whether or not one agrees with Minow’s assessment of television, then or now, there is no doubt that audiences continue to watch: ∙ There are more than 116 million television households in the United States, 97% of all U.S. homes. ∙ The average American watches television 37 hours and 50 minutes a week. ▲ John Walson. © The Barco Library of The Cable Center, Denver, CO CHAPTER 8 Television, Cable, and Mobile Video 185 In 1968 a public affairs program pro- ducer for Channel 13 in New York City identified a number of related problems that she believed could be addressed by a well-conceived, well-produced television show. Joan Ganz Cooney saw that 80% of 3- and 4-year-olds and 25% of 5-year-olds in the United States did not at- tend any form of preschool. Children from financially dis- advantaged homes were far less likely to attend
- 27. preschool at these ages than their better-off peers. Children in these age groups who did go to preschool received little academic instruction; preschool was the equivalent of organized recess. Large numbers of U.S. children, then, entered first grade with no formal school- ing, even though education experts had long argued that preschool years were crucial in children’s intellectual and academic development. In addition, the disparity in aca- demic preparedness between poor and other children was a national disgrace. What did these children do instead of going to pre- school? Cooney knew that they watched television. But she also knew that “existing shows for 3- through 5-year- old children . . . did not have education as a primary goal” (Ball & Bogatz, 1970, p. 2). Her idea was to use an interesting, exciting, visually and aurally stimulating tele- vision show as an explicitly educational tool “to promote the intellectual and cultural growth of preschoolers, par- ticularly disadvantaged preschoolers,” and to “teach children how to think as well as what to think” (Cook et al., 1975, p. 7). Cooney established a nonprofit organization, the Chil- dren’s Television Workshop (CTW), and sought funding for her program. Several federal agencies, primarily the Office of Education, a number of private foundations in- cluding Carnegie and Ford, and public broadcasters con- tributed $13.7 million for CTW’s first four years. After much research into producing a quality children’s television show and studying the best instructional meth- ods for teaching preschool audiences, CTW unveiled Sesame Street during the 1969 television season. It was an instant hit with children and parents. The New Repub- lic said, “Judged by the standards of most other programs
- 28. for preschoolers, it is imaginative, tasteful, and witty” (cited in Ball & Bogatz, 1970, p. 3). Originally scheduled for one hour a day during the school week, within months of its debut Sesame Street was being programmed twice a day on many public television stations, and many ran the entire week’s schedule on Saturdays and Sundays. Today, nearly 45 years after its debut, Sesame Street still airs 26 new episodes a year, and in 2015 it made HBO (with its streaming service) its new home network. Did Cooney and her show make a difference? Several national studies demonstrated that academic perfor- mance in early grades was directly and strongly corre- lated with regular viewing of Sesame Street. The commercial networks began to introduce educational fare into their Saturday morning schedules. ABC’s Grammar Rock, America Rock (on U.S. history), and Multi- plication Rock were critical and educational successes at the time, and a traditional children’s favorite, CBS’s Captain Kangaroo, started airing short films influenced by Sesame Street on a wide variety of social and personal skills. The program has been nominated for more than 250 Emmy Awards, winning nearly 110 times. It recently expanded its preschool curriculum to include subjects such as nature, math, science and engineering concepts, and problem solving. USING MEDIA TO MAKE A DIFFERENCE The Creation of Sesame Street ∙ Television reaches more adults each day than any other medium, and those people spend more time with television than with any other medium. ∙ Traditional television is the dominant choice for viewing video for every age group.
- 29. ∙ Twenty-five to 34-year-old adults spend eight times more hours watching video on television than on the Internet, and 55 times as many hours as watching on a smartphone (all data from Television Advertising Bureau, 2015). There can be no doubt, either, that television is successful as an advertising medium: ∙ Total annual billings for television are around $80 billion, with approximately two-thirds generated by broadcast and one-third by cable television. Together they collected 40% of all U.S. ad spending. ∙ The average 30-second prime-time network television spot costs $100,000 (on American Idol ads have gone as high as $705,000; spots on a mid-season Sunday Night Football game cost $627,300; 30 seconds on Modern Family run $239,650). 186 PART 2 Media, Media Industries, and Media Audiences ∙ Prime ad time on the February 2015 Seahawks–Patriots Super Bowl broadcast cost $4.5 million for 30 seconds. (And 47% of the 114.4 million Americans who watched the game tuned in just for the commercials; Faw, 2015.) ∙ Consumers cite television as their most influential advertising medium. ∙ A 30-second local spot can fetch up to $30,000 on a top-rated
- 30. special in a major market (Television Advertising Bureau, 2015). Scope and Nature of the Broadcast Television Industry Today, as it has been from the beginning, the business of broadcast television is dom- inated by a few centralized production, distribution, and decision-making organizations. These networks link affiliates for the purpose of delivering and selling viewers to advertisers. The large majority of the 1,390 commercial stations in the United States are affiliated with a national broadcasting network: ABC, NBC, and CBS each have over 200 affiliates and Fox has close to that number. Many more stations are affiliated with the CW Network, often referred to as a “weblet.” Although cable has introduced us to dozens of popular cable networks—ESPN, MTV, Comedy Central, and A&E, to name a few—for decades most programs that came to mind when we thought of tele- vision were either conceived, approved, funded, produced, or distributed by the broad- cast networks. Although, as you read at this chapter’s outset, that’s quickly changing. More on that soon. Local affiliates carry network programs (they clear time). Until quite recently, affiliates received direct payment for carrying a show, called compensation, and the right to keep all income from the sale of local commercials on that program. But loss of network audi-
- 31. ence and the rise of cable have altered this arrangement. Now networks receive reverse compensation, a fee paid by the local station for the right to be that network’s affiliate. It is typically based on the amount of money the local cable operation pays to the station to carry its signal, called retransmission fees. The Networks and Program Content Networks control what appears on the vast majority of local television stations, but they also control what appears on non-network television, that is, when affiliates program their own content. In addition, they influence what appears on independent stations and on cable channels. This non-network material not only tends to be network-type programming but most often is programming that originally aired on the networks themselves (called off-network programs). Why do network and network-type content dominate television? Availability is one fac- tor. There is 75 years’ worth of already successful network content available for airing on local stations. A second factor is that the production and distribution mechanisms that have long served the broadcast networks are well established and serve the newer outlets just as well as they did NBC, CBS, and ABC. The final reason is us, the audience. The formats we are most comfortable with—our television tastes and expectations—have been and continue to be developed on the networks. How a Program Traditionally Gets on the Air
- 32. The national broadcast and cable networks look at about 4,000 proposals a year for new television series. Many, if not most, are submitted at the networks’ invitation or instigation. Of the 4,000, about 90 will be filmed as pilots, or trial programs, at a cost of $3 million for a 30-minute pilot to $7 million for an hour drama (the pilot for Lost cost $10 million; Guthrie, 2010). Perhaps 20 to 30 will make it onto the air. Only 12 of these will last a full CHAPTER 8 Television, Cable, and Mobile Video 187 broadcast season. In a particularly good year, at most three or four will succeed well enough to be called hits. The networks spend over $500 million to suffer this process. For this reason, they prefer to see ideas from producers with established track records and financial and organizational stability—for example, Jerry Bruckheimer is the source of CSI, CSI: Miami, CSI: NY, The Amazing Race, Cold Case, and Without a Trace in addition to 16 other prime time series aired in recent years. The way a program typically makes it onto the air differs somewhat for those who have been asked to submit an idea and for producers who bring their concepts to the networks. First, a producer has an idea; or a network has an idea and asks a proven producer to propose a show based on it (possibly offering a put, a deal that guarantees the producer that the network will order at least a pilot or it has to pay a
- 33. hefty penalty). The producer must then shop the idea to one of the networks; naturally, an invited producer submits the proposal only to the network that asked for it. In either case, if the network is persuaded, it buys the option and asks for a written outline in which the original idea is refined. If still interested, the network will order a full script. If the network approves that script, it will order the production of a pilot. Pilots are then subjected to rigorous testing by the networks’ own and independent audience research organizations. Based on this research, networks will often demand changes, such as writing out characters who tested poorly or beefing up story lines that test audiences particularly liked. If the network is still interested, that is, if it believes that the show will be a hit, it orders a set number of episodes and schedules the show. In television’s early days, an order might be for 26 or 39 episodes. Today, however, because of escalating production costs, the convention is at first to order six episodes. If these are successful, a second order of nine more is placed. Then, if the show is still doing well, a final nine episodes (referred to as the back nine) will be commissioned. Few shows make it that far. The reason television program producers participate in this expensive enterprise is that they can make vast amounts of money in syndication, the sale of their programs
- 34. to stations on a market-by-market basis. Even though the networks control the process from idea to scheduling and decide how long a show stays in their lineups, producers continue to own the rights to their programs. Once enough episodes are made (gener- ally about 88, which is the product of four years on a network), producers can sell the syndicated package to the highest bidder in each of the 210 U.S. television markets, keeping all the revenues for themselves. This is the legacy of Lucille Ball’s business genius. The price of a syndicated program depends on the market size, the level of competition between the stations in the market, and the age and popularity of the pro- gram itself. The station buys the right to a specified number of plays, or airings. After that, the rights return to the producer to be sold again and again. A program that has survived at least four years on one of the networks has proven its popularity, has ▼ Two of syndication’s biggest winners, The Big Bang Theory and Friends. (left) © CBS/Photofest; (right) © NBC/ Courtesy Everett Collection 188 PART 2 Media, Media Industries, and Media Audiences attracted a following, and has accumulated enough individual episodes so that local stations can offer weeks of daily sched- uling without too many reruns. In a word, it is a moneymaker.
- 35. Paramount has already earned more than $2 billion from its syndication of Frasier; Warner Brothers collected more than $5.8 million an episode from its original syndication of Friends and gets $4 million an episode for The Big Bang Theory, although it is still in its network run. So attractive is syndication’s income potential, especially when coupled with the promise of profits from digital downloads and sales of DVD collections of television shows, that the net- works themselves have become their own producers (and there- fore syndicators). In fact, the major broadcast networks now produce the vast majority of all the prime-time programming on their own and the top 20 cable networks. It is important to note that there is another form of syndicated programming. First-run syndication is programming produced specifically for sale into syndication on a market-by-market basis. It is attractive to producers because they don’t have to run the gauntlet of the network programming process, and they keep 100% of the income. Satellites have improved the distribution process for first- run syndicated series, increasing the number and variety of available programs. Game and talk shows, staples of the busi- ness in the past, have proliferated and been joined by programs such as Judge Judy, a court show distributed daily by satellite to hundreds of stations. They are inexpensive to make, inex- pensive to distribute, and easily stripped (broadcast at the same time five evenings a week). They allow an inexhaustible number of episodes with no repeats and are easy to promote (“Watch the case of the peeping landlord. Tune in at 5:30.”).
- 36. And despite the fact that the most-watched programs in history were all aired by the traditional television networks (Figure 2), the process by which programs now come to our screens is changing because the central position of networks in that process has been altered. Because they must compete with the streaming services, the networks are no longer the only game in town for top talent, so they themselves are increasingly offering producers more straight-to-series production deals. In addition, as we saw in the opening vignette, much quality programming gets to us not because a network elected to air it, but because a streaming service asked its subscribers which shows they wanted to watch or simply paid quality artists to come work with them. After rejection by the traditional network and cable channels, for example, the producers of House of Cards approached Netflix who said, “We believe in you. . . . We don’t need you to do a pilot. How many [episodes] do you wanna do?” (Auletta, 2014, p. 58). Of course, all this change is the product of the introduction of new technologies—cable, VCR, DVD, digital video recorders, satellite, the Internet and digitization, and even the remote control—that have upset the long-standing relationship between medium and audience. Convergence is also reshaping that relationship. Cable and Satellite Television John Walson’s brainchild reshaped the face of modern television. During cable’s
- 37. infancy, many over-the-air broadcasters saw it as something of a friend. It extended their reach, boosting both audience size and profits. Then, in November 1972, Sterling Manhattan Cable launched a new channel called Home Box Office. Only a handful of homes caught the debut of what we now call HBO, but broadcasters’ mild concern over this development turned to outright antagonism toward cable in 1975, when new HBO 1 2 3 4 5 6 7 8 9 10 Top 10 Most-Watched Nonsports Television Broadcasts M*A*S*H (final episode), 1983 Bob Hope Christmas Show, 1970
- 38. Gone with the Wind (Part 2), 1976 Gone with the Wind (Part 1), 1976 Roots (Part VIII), 1977 The Day After (movie), 1983 The Fugitive (last episode), 1967 Roots (Part VI), 1977 Roots (Part V), 1977 Dallas (“Who Shot JR?”), 1980 60.2/77 46.6/64 47.4/64 47.7/65 51.1/71 Rating/Share 46.0/62 45.9/72 45.9/66 45.7/71
- 39. 53.3/76 CBS NBC ABC Rank ▲ Figure 2 Top 10 Most- Watched Nonsports Television Broadcasts. Source: Television Bureau of Advertising (www.tvb.org). ▲ Satellites like this one made national distribution of HBO possible in 1975. © Jason Reed/Getty Images RF CHAPTER 8 Television, Cable, and Mobile Video 189 owner Time Inc. began distributing the movie channel by satellite. Now premium cable was eating into the broadcasters’ audience by offering high-quality, nation- ally produced and distributed content. The public enthu- siastically embraced cable and that, coupled with the widespread diffusion of fiber optic cable (the transmis- sion of signals by light beam over glass, permitting the delivery of hundreds of channels), brought the medium to maturity. Programming
- 40. Cable’s share of the prime-time audience exceeded that of the Big Four broadcast networks for the first time in 2002. Its total audience share has exceeded that of ABC, CBS, NBC, and Fox every year since. What attracts these viewers is programming, a fact highlighted by two pieces of recent industry data: cable shows annually earn the majority of all prime-time Emmy Awards nominations, and cable viewing exceeds network viewing for every single American age demographic. Even home-shopping channels such as QVC (whose annual revenues of over $9 billion exceed those of tra- ditional networks ABC and NBC) have made their mark. As we’ve seen, cable operators attract viewers through a combination of basic and premium channels, as well as with some programming of local origin. There are more than 900 national and regional cable networks. We all know national networks such as CNN, Lifetime, HBO, and the History Channel. Regional network North-West Cable News serves Washington, Oregon, Idaho, Montana, northern California, and parts of Alaska; New England Cable News serves the states that give it its name; and several regional sports-oriented channels serve different parts of the country. The financial support and targeted audiences for these program providers differ, as does their place on a system’s tiers, groupings of channels made available to subscribers at varying prices. BASIC CABLE PROGRAMMING In recognition of the growing
- 41. dependence of the public on cable delivery of broadcast service as cable penetration increased, Congress passed the Cable Television Consumer Protection and Competition Act of 1992. This law requires operators to offer a truly basic service composed of the broadcast stations in their area and their access channels. Cable operators also offer another form of basic service, expanded basic cable, composed primarily of local broadcast stations and ser- vices with broad appeal such as TBS, TNT, the USA Network, and Comedy Central. These networks offer a wide array of programming not unlike that found on the tradi- tional, over-the-air broadcast networks. Ad-supported cable networks such as these want to be on cable’s basic tiers because sponsors covet those large potential audiences. This is the dispute, for example, at the heart of the NFL Network’s long-running fight with the nation’s cable operators. Most operators want to put the network on a premium tier to attract more subscribers. NFL Network wants placement on basic cable where more viewers means more ad dollars. Because of concentration, operators are increasingly choosing to carry a specific basic channel because their owners (who have a financial stake in that channel) insist that they do. Multiple system operators (MSOs) are companies that own several cable franchises. Time Warner, Liberty, and Cablevision own truTV. Comcast has an interest in numerous prime channels. Viacom owns BET. Naturally, these networks
- 42. are more likely to be carried by systems controlled by the MSOs that own them and less likely to be carried by other systems. This pattern also holds true for MSO-owned premium channels such as HBO and Showtime. The long-standard concept of different pricing for different packages or tiers of channels is currently under attack by the FCC and some members of Congress. Con- cerns over viewers’ accidental access to unwanted, offensive content and rising cable ▲ Revenues of cable shopping network QVC exceed those of traditional television networks ABC and NBC. © McGraw-Hill Education/Mark Dierker, photographer 190 PART 2 Media, Media Industries, and Media Audiences prices (at twice the rate of inflation) are leading to calls for à la carte pricing—that is, paying for cable on a channel-by-channel basis. The industry itself is split on the issue, system operators versus programmers. You can read more about the dispute in the box entitled, “Bundle or À la Carte?” PREMIUM CABLE As the FCC lifted restrictions on cable’s freedom to import distant signals and to show current mov- ies, HBO grew and was joined by a host of other satellite- delivered pay networks. Today, among the most familiar
- 43. and popular premium cable networks are HBO, Showtime, the Sundance Channel, and Cinemax. In addition to freedom from regulatory constraint, two important programming discoveries ensured the success of the new premium channels. After television’s early experiments with over-the-air subscription TV failed, many experts believed people simply would not pay for television. So the first crucial discovery was that viewers would indeed pay for packages of contemporary, premium movies. These movie pack- ages could be sold less expensively than could films bought one at a time, and viewers were willing to be billed on a monthly basis for the whole package rather than pay for each viewing. The second realization boosting the fortunes of the premium networks was the discovery that viewers not only did not mind repeats (as many did with over-the-air television) but welcomed them as a benefit of paying for the provider’s slate of films. Premium channel owners were delighted. Replaying content reduced their programming costs and solved the problem of how to fill all those hours of operation. Premium services come in two forms: movie channels (HBO, Starz!, and Encore, for example) that offer packages of new and old movies along with big sports and other special events—all available for one monthly fee—and pay-per-view channels, through which view- ers choose from a menu of offerings (almost always of very new
- 44. movies and very big sporting events) and pay a fee for the chosen viewing. People enjoy premium channels in the home for their ability to present unedited and uninterrupted movies and other content not usually found on broadcast channels—for example, adult fare and championship boxing and wrestling. Increasingly, however, that “content not usually found on broadcast channels” consists not of movies and sports but high-quality serial programming—content unencumbered by the need to attract the larg- est possible audience possessing a specific set of demographics. Premium cable series such as Game of Thrones, True Detective, Veep, Homeland, and Girls attract large and loyal followings. The other dominant multichannel service is direct broadcast satellite (DBS). First avail- able to the public in 1994, it has brought cable’s subscriber growth to a near standstill because from the viewer’s perspective, what is on a DBS- supplied screen differs little from what is on a cable-supplied screen. DBS in the United States is dominated by two companies, DirecTV and Dish Net- work. DirecTV has 20.2 million subscribers; Dish Network, 14 million. These two companies, along with Verizon’s fiber optic FiOS-TV and its 5.5 million subscribers, have recently been peeling away subscribers from cable. Look at the list of the 10 largest MSOs in Figure 3. Note that Dish, DirecTV, and
- 45. Verizon are all among that group. Cable’s ever-increasing monthly rates encourage this move to DBS. But DBS providers, like other MSOs, face the troubling problem of cord- cutting, viewers leav- ing cable and DBS altogether and relying on Internet-only television viewing. Cable suffered its first annual drop in total subscribers in 2013 and has averaged a yearly loss of two million subscribers over the last half-decade (Tice, 2014). Much of this decline is attributed to what the industry calls over-the-top (OTT) television, delivery of video without the involvement of an MSO, as in “over (avoiding) the set-top box.” Because of OTT, the number of zero-TV homes, those with sets that receive neither over-the-air nor cable/satellite television is growing at a rate of 16% a year (Stenovec, 2015). ▲ MSOs want the NFL Network on a premium tier; the NFL is happy to stay on basic cable. © Joe Robbins/Getty Images CHAPTER 8 Television, Cable, and Mobile Video 191 Comcast Charter DirecTV Dish Network
- 46. Time Warner Verizon AT&T Cox Cablevision Suddenlink 1 2 3 4 5 6 7 8 9 10 Rank and subscribers (in millions) 20.2
- 47. 22.4 14.0 11.0 5.5 4.3 2.7 1.2 4.4 6.1 ◀ Figure 3 Top 10 MSOs, 2014. Source: Statistica, 2015. (Keep in mind that concentration is just as rampant in cable as in other media industries, so these rankings are sure to change.) ◀ Figure 4 Top 10 Video Subscription Services, U.S. Subscribers, 2015. Source: Adapted from NCTA, 2015. Netflix Hulu Comcast
- 48. Direct TV Dish AT&T Time Warner Cable Verizon Charter Cox 1 2 3 4 5 6 7 8 9 10 Rank and subscribers (in millions)
- 49. 22.4 39.0 20.2 14.0 6.7 5.5 4.4 4.3 6.0 11.0 Look at Figure 4. You’ll notice that there were two non-MSO services, Netflix and Hulu, among the country’s top 10 providers of pay television in 2015. One OTT, Net- flix, was number one by a very wide margin. 192 PART 2 Media, Media Industries, and Media Audiences The debate over how to price a cable subscription has entered the cultural forum because of a perfect storm of concern. Many consumers are upset over rising subscrip- tion rates, which are growing at more than 5% a year (Flint, 2014). Some politicians worry about people acci-
- 50. dentally seeing material they find offensive, and more than a few MSOs are chafing under big hikes in what they have to pay for the channels they carry. For them, pro- gramming costs have escalated between 6% and 10% a year for the last decade, and for popular channels like ESPN, for example, MSOs must pay more than $6 for each of their cable households (Molla, 2014). The solution to meeting these different concerns is to let the market (meaning viewers) decide with à la carte pricing. That way, consumers wouldn’t have to pay for unwatched channels (an average household will watch only 17 of its available 129 channels; “Why Don’t,” 2014); there would be reduced risk of exposure to unwanted content; and MSOs wouldn’t have to pay programming costs for all their subscribing households, just for those deciding to watch a specific channel. But, argue cable network programmers like Disney and Viacom, our costs have escalated dramatically as well. ESPN spends more than $5 billion a year on pro- gramming (up 50% from five years ago); TNT spends $1.1 billion (up 55%); the History Channel spends over $283 million (a 50% rise; James, 2011). Viewers have decided, say the programmers, and this expensive con- tent is what they want. In fact, they argue, à la carte would actually raise consumers’ costs because those expensive popular channels make possible the smaller, niche channels. There might be a lot of people willing CULTURAL FORUM Bundle or À la Carte?
- 51. ▲ Viewers and critics agree that much of television’s most sophisticated (and enjoyable) programming is available on premium cable. Unafraid of offending advertisers, cable networks can present challenging, often controversial content. Can you match the title with the image? Veep, True Detective, Girls, Homeland. (clockwise form top left) © Photos 12/Alamy; © AF archive/Alamy; © Showtime Networks/Photofest; © HBO/Photofest CHAPTER 8 Television, Cable, and Mobile Video 193 Trends and Convergence in Television and Cable The long-standing relationship between television and its audiences is being redefined. This profound change, initially wrought by cable and satellite, has been and is being driven by other new technologies as well—VCR, DVD, DVR, the Internet, digitization, and even the smartphone. VCR Introduced commercially in 1976, videocassette recorders (VCRs) quickly became common in American homes, but they have almost completely disappeared as newer video tech- nologies that give people even more control over viewing choices have emerged. Still, their introduction further eroded the audience for traditional over- the-air television, as people could now watch rented and purchased videos. VCR also allowed time-shifting, taping a
- 52. show for later viewing, and zipping, fast-forwarding through taped commercials. As a result, people became comfortable with, in fact came to expect, more control over when, what, and how they watched television. DVD In March 1996 digital video disc (DVD) went on sale in U.S. stores. Using a DVD, viewers can stop images with no loss of fidelity; can subtitle a movie in a number of languages; can search for specific scenes from an on-screen picture menu; and can access information tracks that give background on the movie, its production, and its personnel. Scenes and music not used in the theatrical release of a movie are often included on the disc. Innovations such as these made DVD at the time of its introduction the fastest-growing consumer electronic product of all time. Sales of DVD players exceeded those of VCRs for the first time in September 2001, and DVD players now sit in 80% of U.S. homes. Because of the many viewing options now available, DVD sales and rentals have fallen dramatically for the last several years (Graser, 2014), and in 2012, the number of online movie transactions (sales and rentals) exceeded the number of physical, that is disc, trans- actions for the first time, 3.4 billion to 2.4 billion (Smith, 2012). DVR In March 1999 Philips Electronics unveiled the digital video
- 53. recorder (DVR). It contains digital software that puts a significant amount of control over content in viewers’ hands. to pay $6 for ESPN, but how many viewers would pay for C-Span, or a foreign-language channel, or a reli- gious channel, and how much would they be willing to pay? À la carte means the menu gets much, much smaller. And besides, continues the programmers’ po- sition, people are already comfortable with bundles. Newspapers and magazines are bundles—we buy the whole publication, not individual stories. Subscription channels like HBO and Cinemax are bundles—we pay for all their programs, not just the ones we watch (and of course, HBO and Cinemax are themselves already available à la carte from MSOs). Even amusement parks are bundles—one price gets us in and we can ride all, some, or even none of the rides. Enter your voice, à la carte or bundle? Would you be happier paying for only the channels you watch, or do you find value in having a lot of options, even if you don’t take advantage of them all the time? And what about ser- endipitous viewing, running across something you might not have thought to watch, but it catches your eye? Isn’t this one of the great gifts of cable? Have you ever be- come a fan of something you inadvertently saw? 194 PART 2 Media, Media Industries, and Media Audiences ▶ Who has time for TV when there’s so much video to watch? HI & LOIS © 2011 by King Features
- 54. Syndicate, Inc. World rights reserved. Reprinted by permission. They can “rewind” and play back portions of a program while they are watching and recording it without losing any of that show. By designating their favorite shows, viewers can instruct DVR to automatically record and deliver not only those programs but all similar content over a specified period of time. This application can even be used with the name of a favorite actor. Type in Adam Sandler, and DVR will automatically record all programming in which he appears. DVR does not deliver programming the way broadcasters, cablecasters, and DBS sys- tems do. Rather, it is employed in addition to these content providers. All DBS providers and almost every MSO now offer low-cost DVR as part of their technology platform, significantly hastening its diffusion into American homes. Today, about half of all TV households have DVR. Naturally, traditional broadcast and ad- supported cable networks find the rapid diffusion of DVR troubling, and while it is true that DVR is dramatically changing television viewing as we have known it, it has not had as negative an effect on those traditional programming sources as originally anticipated. More than 60% of all U.S. television homes that subscribe to an MSO have a DVR; 55% have more than one (Friedman, 2015). And while DVR does allow viewers to fast-forward through commercials (as many as 73% of the ads in Mad Men and 66% in The Walking Dead;
- 55. Perlberg, 2014), we saw earlier in this chapter that traditional broadcasters rely on DVR playback to boost their ratings and therefore profits. Streaming Video Television on the Internet was slow to take off because of copyright and piracy concerns, and because few viewers had sufficient bandwidth, space on the wires bringing content into people’s homes. So for several years the most typical video fare on the Internet was a variety of short specialty transmissions such as movie trailers, short independent films, music videos, and news clips. But the development of increasingly sophisticated video compression software and the parallel rise of homes with broadband Internet connections (95% of all U.S. Internet homes have broadband; Burger, 2014) have changed that. Because broadband offers greater information-carrying capacity (that is, it increases bandwidth), watching true television on the Internet is now common. Much of that viewing is of con- tent that originated on network and cable television, but much is also Web-only video (most if the number of streamed videos is the measure). But as we saw in this chapter’s opening, the distinction between Web-only and broadcast/cable programming is disappearing. Internet video sites Netflix, Hulu, Ama- zon, and YouTube commission original content. YouTube, with only 600,000 unique monthly viewers in 2005, started the online video revolution, but it is no longer alone.
- 56. We watch 1.57 billion videos a day on that site, but we also watch 1.3 billion every day on Facebook (Walsh, 2014). And there are many other successful, more narrowly targeted Internet video sites. Blip.tv, for example, is a springboard for high-quality original Web series like Fred and iJustine that it eventually distributes across the Web, and Atom.com focuses on comedy. This wealth of Internet video is altering viewing habits, especially among young people. You can see where 16- to 24-year-olds watch video in Figure 5. CHAPTER 8 Television, Cable, and Mobile Video 195 Ultimately, the convergence of the Inter- net and television will be even more seam- less as there are several new technologies further discouraging the distinction between the two. Slingbox, for example, allows users to “sling” television content to their computers and cell phones. Viewers can buy the device as a stand-alone, and several cable and satellite companies are investigat- ing making it available to their subscribers. Viewers can also sling video in the other direction with devices such as AppleTV and Roku that send Web video to home sets. In addition, using video game consoles and Internet-enabled HDTVs (commonly called Smart TVs), two-thirds of all U.S. homes have direct Web-to-TV connections (Briel, 2014), half of those on Smart TVs
- 57. (Hoelzel, 2014). Interactive Television The Internet is not the only technology that permits interactivity. Cable and satellite also allow viewers to “talk back” to content pro- viders. But it is digital cable television, the delivery of digital images and other infor- mation to subscribers, that offers the truest form of interactive television. There are 55 million digital cable subscribers in the United States (National Cable and Telecommunications Association, 2015). Cable’s digital channels permit multiplexing, carrying two or more different signals over the same channel. This, in turn, is made possible by digital compression, which “squeezes” signals to permit multiple signals to be carried over one channel. Digital compression works by removing redundant information from the transmission of the signal. For example, the set behind two actors in a movie scene might not change for several minutes. So why transmit the information that the set is there? Simply transmit the digital data that indicate what has changed in the scene, not what has not. This expanded capacity makes possible interactive cable, that is, the ability of subscrib- ers to talk back to the system operator (extra space on the channel is used for this back talk). And this permits the following services, many of which you already use: video-on- demand (VOD), one-click shopping (you see it, you click on it, you buy it), local informa-
- 58. tion on demand (news, traffic, and weather), program interactivity (choose a camera angle, learn more about an actor’s career, play along with game show contestants), interactive program guides, and video games. But it is video-on-demand— the ability to access pay- per-view movies and other content that can be watched at any time—that best shows the economic advantage of putting more control into viewers’ hands. American television homes annually log 4.4 billion hours of on-demand movies and TV shows via cable (Fried- man, 2014). Phone-over-Cable Another service offered by many MSOs is phone service over cable wires. Currently there are 28 million cable-delivered residential telephone subscribers (National Cable and Telecommunications Association, 2015). Phone-over-cable offers a special benefit to MSOs. If telephone service can be delivered by the same cable that brings television At home in the evening In bed before falling asleep At home in the morning At friends’ or relatives’ homes At school or work In bed before getting up
- 59. Out and about in town While commuting Where users watch 58% 81% 43% 40% 25% 27% 9% 22% ▲ Figure 5 Where 16- to 24-Year-Olds Watch Video. Source: Ault, 2014. Photo Source: © Andersen Ross/ Getty Images RF 196 PART 2 Media, Media Industries, and Media Audiences into the home, so too can the Internet. And what’s more, if the cable line is broadband capable of handling digitally compressed data, that Internet service can be even faster
- 60. than the service provided over traditional phone lines. Cable, in other words, can become a one-stop communications provider: television, VOD, audio, high-speed Inter- net access, long-distance and local phone service, multiple phone lines, and fax. This is bundling. How valuable is a bundle-receiving subscriber to an MSO? Add together the bills you’re probably paying right now—basic or premium cable, your Internet service provider, and your phone bill. What does that total? Now speculate on how much pay-per-view and VOD you might buy now that you have broadband and a superfast cable modem. And what would you pay for home delivery of real-time sports or financial data? And the MSO would collect each time you accessed an interactive classified or commercial ad. That’s how valu- able a bundled subscriber will be. Smartphones, Tablets, and TV Everywhere As Figure 5 should make amply clear, smartphones and tablets, just as they have for other media, have made television watching an anywhere, anytime activity. But so have two other developments. The first is the popularity of handheld gaming devices like Nintendo’s DSi and Sony’s PlayStation Portable and Vita, all of which can stream video and play video discs or cartridges (see the chapter on video games). The second is the TV Everywhere Initiative, content providers’ ongoing efforts to make digital on-demand programming available to all mobile devices. Slowed by concerns over pricing, advertising
- 61. models, audience measurement, and release-of-content strategies, its participants include MSOs like Comcast, Dish, and Verizon and broadcast networks like Fox and CBS. In addition, 900 over-the-air commercial and public broadcasters, through the Open Mobile Video Coalition, are working to bring their signals to TV Everywhere. Their goal is to make themselves OTT providers, allowing people to view their programming on mobile devices, eventually without a cable subscription. For example, NBC, Fox, and ABC stations stream their shows to cable subscribers in the cities where they operate; and NBC O&Os stream content to taxis, gas stations, and bus and train stations. This mobile viewing activity promises to alter the television/viewer relationship in a way other than mobility. Time with mobile devices is slowly replacing time with the television set. Already, mobile device users spend more time with those devices than in front of a television screen—177 minutes a day versus 168 (Marvin, 2014). And when they are in front of a set, 86% of smartphone owners use their devices as second screens, searching for information on characters, storylines, and performers, texting about what they’re watching, and Tweeting—nearly a billion Tweets about TV a year (Nielsen, 2014). DEVELOPING MEDIA LITERACY SKILLS Developing Heightened Expectation
- 62. of News Anchors The end of 2014 and the beginning of 2015 saw four of the country’s most prominent news anchors not only make news themselves, but force media- literate television viewers to reas- sess exactly what it is they expect from these very visible media personalities. Not everyone might have considered Comedy Central’s Stephen Colbert and Jon Stewart news anchors, but numerous surveys conducted over time demonstrate that peo- ple who got their news primarily from the satirical news shows were better informed about current events and political issues than those who watched traditional news CHAPTER 8 Television, Cable, and Mobile Video 197 programs on ABC, CBS, NBC, Fox News, CNN, and MSNBC. And while Stewart insists he’s not a newsman (see Moyers, 2007), polls consistently identify Stewart and Colbert as among the country’s most trusted journalists (Meyers, 2015; Linkins, 2009). Colbert and Stewart were in the news because both announced their retirement from fake TV journalism, Colbert leaving The Colbert Report in December 2014 and Stewart leaving The Daily Show in August 2015. Reaction was immediate and deeply felt (Itzkoff, 2015). Even HBO, a more established network than Comedy Central, features John Oliver’s satirical news show Last Week
- 63. Tonight with John Oliver, which also brings a mixed perspective of humor and outrage to serious news events. Two other “most trusted” television news anchors made news that February for a different reason. NBC Nightly News anchor Brian Williams was accused of and then admitted to exaggerating the level of danger he encountered while flying in a fleet of heli- copters under rocket attack in the Iraq War. His network suspended him for six months. About the same time, Fox News Network’s Bill O’Reilly of The O’Reilly Factor was accused of exaggerating or flat out falsifying a number of reports he’d made on television and in print about his involvement in covering the 1980 murder of Catholic nuns in El Salvador, the 1982 Falklands War, the 1984 Belfast Bombings, the 1992 L.A. Riots, and his coverage in 1997 of the Kennedy assassination investigation. The network supported its anchor and his denials, and his viewership increased (Flood, 2015). News may be journalism, but televi- sion news is also a television show, and as such it must attract viewers. Television newspeople have an obligation to truthfully and accurately inform the public, but they also have an obligation to attract a large number of people so their station or network can be profitable. Stewart, Colbert, and Oliver have no obligation to uphold journalistic standards;
- 64. their job is to entertain, but in doing so they nonetheless manage to generate trust and inform. Williams and O’Reilly are “real” journalists and must uphold standards of truthfulness and accuracy, but they must also entertain; they must draw viewers, and their experiences covering the news are central to their on-air personalities, which helps draw those viewers. This raises a number of questions for media-literate television news viewers. What is it about satirical news anchors Stewart, Colbert, and Oliver that makes them effective reporters of the news? What do we expect of them? Must our reward for the hard work of keeping up with current events be entertainment? Why was Williams cut loose by his network and O’Reilly defended by his? Is it that there are different expectations for different anchors? For different news organizations, for exam- ple “objective” broadcast network (NBC) versus “politically partisan” cable channel (Fox)? Should there be? The answers to these questions are not easy or necessarily straightforward. But with the growing mistrust of the traditional media, might we simply be getting the media we deserve? If, as money-making entities, news programs and their anchors simply give us what we want, that is, meet our expectations, aren’t we the authors of our own decline in trust? For decades, studies have shown that a majority of the American public turns to television as the source of most of its news and that viewers rank it as the most believable news
- 65. source. But this is no longer the case. In 2015 search engines like Google surpassed “tra- ditional media” as people’s most trusted news source (Ries, 2015). True, “traditional media” is not necessarily television news alone, but because that medium was the most trusted for so long, there’s no doubt that loss of trust in it has contributed greatly to this state of affairs. How do you, as a media-literate person, explain why this has happened? Where do you get most of your news, and what are your expectations of the professionals who provide it? ▲ What are your expectations of news anchors, even satirical anchors like John Oliver? © Jesse Dittmar/The Washington Post/Getty Images 198 PART 2 Media, Media Industries, and Media Audiences Resources for Review and Discussion REVIEW POINTS: TYING CONTENT TO LEARNING OUTCOMES ▸ Outline the history and development of the television and cable television industries and television itself as a medium. ! In 1884 Paul Nipkow developed the first device for trans- mitting images. John Logie Baird soon used this mechani- cal scanning technology to send images long distance.
- 66. Vladimir Zworykin and Philo Farnsworth developed electronic scanning technology in the 1920s, leading to the public demonstration of television in 1939. ! In the 1950s, the quiz show scandal, the business acumen of Lucille Ball, McCarthyism, and the ratings system shaped the nature of broadcast television. Cable, introduced in 1948, would soon effect even more change. ! Cable, designed initially for the importation of distant signals, became a mature medium when it began offering movies and other premium content. ▸ Describe how the organizational and economic nature of the contemporary television and cable industries shapes the content of television. ! Cable, dominated by large MSOs, offers programming in tiers that include basic, expanded basic, and premium cable. Some favor a new pricing scheme, à la carte. ! Direct broadcast satellite is the primary multichannel competitor to cable, now joined by fiber optic systems like FiOS. ▸ Explain the relationship between television in all its forms and its viewers. ! Once described as a vast wasteland, it is the leading source of news for a large majority of Americans. ! Viewers rate television as their most influential ad medium. There is no better way to become aware of the impact of the media on you and
- 67. society than to do without them. As a media-literate individual, you can test for yourself just how free you are of the power of one specific medium, video. See if you control your viewing or if your viewing controls you. To start, pick a five-day period and simply stop watching. No television. No videos on the Internet or your smartphone. No video games. Simply put: Don’t watch or even look at any video screen anywhere for five entire days. If you are adventurous, enlist one or more friends, family members, or roommates. Simply changing your routine viewing behavior will not do very much for you unless you reflect on its meaning. Ask yourself (and any confederates you may have enlisted) these questions. How easy or difficult was it for you to break away from all video? Why was it easy or difficult? What did you learn about your video consumption habits? How did you use the freed-up time? Were you able to find productive activity, or did you spend your time longing for a screen? Be sure to describe how not watching affected your other life habits (eating, socializing with family and friends, news gathering, and the like). Describe your interactions with other people during this week. Did your con- versations change? That is, were there alterations in duration, depth, or subject matter? If you were unable to complete the week of nonviewing, describe why. How easy or difficult was it to come to the decision to give up? Do you consider it a failure to have
- 68. resumed watching before the five days were up? Why or why not? Once you resume your normal video habits, place yourself on a scale of 1 to 10, with 1 being “I Control Video” and 10 being “Video Controls Me”. Explain your self- rating. MEDIA LITERACY CHALLENGE No Video for a Week CHAPTER 8 Television, Cable, and Mobile Video 199 ▸ Identify new and converging video technologies and their potential impact on the television industry and its audience. ! A host of technologies influence the television-viewer relationship, including VCR, DVD, DVR, video on the Internet, and interactive television. ▸ Describe the digital and mobile television revolution. ! Mobile video on smartphones, tablets, and other portable video devices are now common, aided by the idea of TV Everywhere and the rise of video via social networking sites. ▸ Apply key television-viewing media literacy skills. ! Our expectations of news anchors’ performances raise several questions for media-literate people about broadcaster integrity and respect for viewers. KEY TERMS
- 69. cord-never, 176 nonlinear TV, 176 Nipkow disc, 177 pixel, 177 iconoscope tube, 178 kinescope, 178 coaxial cable, 179 microwave relay, 179 spot commercial sales, 179 Global Television Audience Metering meter (GTAM meter), 182 C3 rating, 182 sweeps periods, 183 share, 183 community antenna television (CATV), 183 master antenna television (MATV), 184 importation of distant signals, 184 all-channel legislation, 184 vast wasteland, 184 network, 186 clear time, 186 reverse compensation, 186 retransmission fees, 186 off-network, 186 pilot, 186 put, 187 first-run syndication, 188 stripping, 188 premium cable, 189 fiber optics, 189 tiers, 189
- 70. expanded basic cable, 189 multiple system operator (MSO), 189 à la carte pricing, 190 subscription television, 190 cord-cutting, 190 over-the-top (OTT), 190 zero-TV homes, 190 time-shifting, 193 zipping, 193 digital video disc (DVD), 193 digital video recorder (DVR), 193 bandwidth, 194 broadband, 194 digital cable television, 195 video-on-demand (VOD), 195 bundling, 196 QUESTIONS FOR REVIEW 1. What is the importance of each of the following to the history of television: Paul Nipkow, John Logie Baird, Vladimir Zworykin, Philo Farnsworth, and Newton Minow? 2. What was the impact on television of the quiz show scandal, I Love Lucy, McCarthyism, and the Nielsen ratings? 3. How are the ratings taken? What are some complaints about the ratings system? 4. How does a program typically make it to the air? How does syndication figure in this process? 5. How have cable, VCR, DVD, DVR, and DBS affected the networks?
- 71. 6. What are some of the changes in television wrought by cable? 7. Explain the difference between basic cable, expanded basic cable, premium cable, pay-per-view, and à la carte pricing. 8. What are importation of distant signals, premium cable, and fiber optics? How are they related? What do they have to do with cable’s maturity as a medium? 9. What is OTT and how does it affect what we see on the screen? 10. In what ways can viewers access video on the Internet? Via mobile devices? What kinds of content are available on these platforms? To maximize your study time, check out CONNECT to access the SmartBook study module for this chapter, watch videos, and explore other resources. QUESTIONS FOR CRITICAL THINKING AND DISCUSSION 1. As an independent producer, what kind of program would you develop for the networks? How immune do you think you could be from the pressures that exist in this process? 2. Are you a cable subscriber? Why or why not? At what level? Would you prefer à la carte pricing? Why or why not? 3. Could you be a cord-never or live in a zero-TV home? If not, what keeps you committed to your MSO? What would it take to get you to cut the cord?
- 72. 200 PART 2 Media, Media Industries, and Media Audiences REFERENCES 1. Auletta, K. (2014, February 3). Outside the box. New Yorker, pp. 54–61. 2. Ball, S., & Bogatz, G. A. (1970). The first year of Sesame Street: An evaluation. Princeton, NJ: Educational Testing Service. 3. Briel, R. (2014, February 13). Net-connected TV penetration tops 60%. Broadband TV News. Online: http://www. broadbandtvnews.com/2014/02/13/net-connected-tv- penetration-tops-60/ 4. Burger, A. (2014, October 24). LRG: U.S. broadband penetration rises to 79% of households, smartphone role increasing. Telecompetitor.com. Online: http://www. telecompetitor.com/lrg-u-s-broadband-penetration-rises-to- 79-of-households-smartphone-role-increasing/ 5. Chin, F. (1978). Cable television: A comprehensive bibliography. New York: IFI/Plenum. 6. Cook, T. D., Appleton, H., Conner, R. F., Shaffer, A., Tamkin, G., & Weber, S. J. (1975). Sesame Street revisited. New York: Russell Sage Foundation. 7. Faw, L. (2015, January 30). Half of Americans watch Super Bowl for the ads. MediaPost. Online: http://www.mediapost. com/publications/article/242856/half-of-americans-watch-
- 73. super-bowl-for-the-ads.html 8. Flint, J. (2014, May 19). FCC says cable rates continue to rise. Los Angeles Times. Online: http://www.latimes.com/ entertainment/envelope/cotown/la-et-ct-fcc-cable-rates- 20140519-story.html 9. Flood, B. (2015, February 26). Is controversy helping Bill O’Reilly? Ad Week. Online: http://www.adweek.com/ tvnewser/is-controversy-helping-bill-oreilly/257067 10. Friedman, W. (2014, April 8). Video-on-demand viewing on the rise. MediaPost. Online: http://www.mediapost.com/ publications/article/223237/video-on-demand-viewing-on- the-rise.html 11. Friedman, W. (2015, January 2). DVR service soars in U.S. Media Post. Online: http://www.latimes.com/entertainment/ envelope/cotown/la-et-ct-fcc-cable-rates-20140519-story.html http://www.mediapost.com/publications/article/241028/dvr- service-soars-in-us.html 12. Graser, M. (2014, December 2). Studios to unwrap digital viewing riches. Variety, pp. 14–15. 13. Guthrie, M. (2010, April 26). Is network TV’s model lost? Broadcasting & Cable, pp. 10–11. 14. Hoelzel, M. (2014, April 17). Smart TVs are about to over- take streaming devices in the U.S. Business Insider. Online: http://www.businessinsider.com/the-connected-tv-landscape- why-smart-tvs-and-streaming-gadgets-are-conquering-the- living-room-2-2014-3
- 74. 15. “Is it OK to share log-ins for Amazon Prime, HBO Go, Hulu Plus, or Netflix?” (2015, January 28). Consumer Reports. Online: http://www.consumerreports.org/cro/ magazine/2015/01/share-logins-streaming-services/index.htm 16. Itzkoff, D. (2015, February 10). Jon Stewart will leave ‘The Daily Show’ on a career high note. New York Times, p. A1. 17. James, M. (2011, December 8). Cable TV networks feel pressure of programming costs. Los Angeles Times. Online: http://articles.latimes.com/2011/dec/08/business/la-fi-ct- cable-economics-20111208 18. Khatchatourian, M. (2014, June 3). It’s not just TV, it’s OTT! Variety, p. 79. 19. Kuralt, C. (1977). When television was young (videotape). New York: CBS News. 20. Linkins, J. (2009, August 22). Online poll: Jon Stewart is America’s most trusted newsman. Huffington Post. Online: http://www.huffingtonpost.com/2009/07/22/time-magazine- poll-jon-st_n_242933.html 21. Littleton, C. (2015, February 10). Can TV ratings measure up? Variety, pp. 46–49. 22. Maglio, T. (2015, January 7). CBS chief Moonves calls overnight ratings “worthless,” “antiquated.” The Wrap. Online: http://www.thewrap.com/les-moonves-cbs-tv-ratings- ces- stephen-colbert-james-corden/ 23. Mandese, J. (2015, February 19). Nielsen to roll out
- 75. contro- versial “viewer assignment” method, will model audience estimates in non-people meter homes. MediaPost. Online: http://www.mediapost.com/publications/article/244092/ nielsen-to-roll-out-controversial-viewer-assignme.html 24. Marvin, G. (2014, November 18). Report: We now spend more time on mobile devices than TV. Marketingland.com. Online: http://marketingland.com/report-time-on-mobile- devices-surpassed-tv-108366 25. Meyers, J. (2015, January 16). The 10 most trusted personali- ties in TV news. Newsmax. Online: http://www.newsmax. com/TheWire/10-most-trusted-personalities-tv/2015/01/16/ id/619016/ 26. Molla, R. (2014, August 5). How much cable subscribers pay per channel. Wall Street Journal. Online: http://blogs.wsj. com/numbers/how-much-cable-subscribers-pay-per- channel-1626/ 27. Moyers, B. (2007, April 27). Transcript: Bill Moyers talks with Jon Stewart. Bill Moyers Journal. Online: http://www. pbs.org/moyers/journal/04272007/transcript1.html 28. National Cable and Telecommunications Association. (2015). Industry data. Online: https://www.ncta.com/ industry-data 29. Nielsen Corporation. (2014, May). State of the media: Adver- tising & audiences, May 2014. Nielsen.com. Online: http:// www.nielsen.com/us/en/insights/reports/2014/state-of-the- media-audio-today-2014.html
- 76. 30. Perlberg, S. (2014, August 3). Ad-skipping skews upscale. Wall Street Journal. Online: http://www.wsj.com/articles/ad- skipping-skews-upscale-1407107993 CHAPTER 8 Television, Cable, and Mobile Video 201 31. Poggi, J. (2014, May 19). The future of TV? No more com- mercials, says Netflix chief production officer. Advertising Age. Online: http://adage.com/article/media/future-tv- commercials-netflix-exec/293275/ 32. Ries, T. (2015, January 19). Intellectual property and trust in the age of digital media. Edelman.com. Online: http://www. edelman.com/post/intellectual-property-trust-age-digital- media/ 33. Smith, S. (2012, March 23). End of an age: Netflix, Hulu, Am- azon will beat physical video viewing in 2012. MediaPost. On- line: http://www.mediapost.com/publications/ article/170863/ end-of-an-age-netflix-hulu-amazon-will-beat-phy.html 34. Statistica. (2015). Pay TV providers ranked by the number of subscribers in the United States in Q3 2014 (in millions). Online: http://www.statista.com/statistics/251793/pay-tv- providers-with-the-largest-number-of-subscribers-in-the-us/ 35. Stenovec, T. (2015, January 16). This will be the best year to ditch your cable subscription. Huffington Post. Online: http:// www.huffingtonpost.com/2015/01/15/ streaming-tv_n_6480754.html
- 77. 36. Sterling, C. H., & Kitross, J. M. (1990). Stay tuned: A concise history of American broadcasting. Belmont, CA: Wadsworth. 37. Television Advertising Bureau. (2015). Nielsen total audience report—Q3 2014. Online: http://www.tvb.org/trends/273069 38. Tice, D. (2014, October 6). Adventures in cord-cutting. Gfk. com. Online: http://blog.gfk.com/2014/10/adventures-in-cord- cutting/ 39. Verini, B. (2013, August 14). Masking the ‘vast wasteland’ bloom. Variety, p. 48. 40. Wallenstein, A. (2014, October 28). SVOD syndication fees to multiply for years. Variety, p. 13. 41. Walsh, M. (2014, May 15). Connected TV households climb to 42 million. MediaPost. Online: http://www.mediapost.com/ publications/article/225926/connected-tv-households-climb- to-42-million.html?edition= 42. “Why don’t viewers watch more channels?” (2014, May 19). Variety, p. 11. NOTICE: This material may be protected by copyright law (Title 17 U.S. Code).
- 79. Page 1 Page 2 Page 3 Page 4 Page 5 Page 6 Page 7 Page 8 Page 9 Page 10 Page 11 Page 12 Page 13 Page 14 Page 15 Page 16 Page 17 Page 18 Page 19 Page 20 Page 21 Page 22 Page 23 Page 24 Page 25 Page 26 Page 27 Page 28 Page 29 Page 30 Page 31
- 80. Page 32 Page 33 Page 34 Page 35