2. Group Activity – 3 minutes
• Form small groups (3-4 students) and compare
the graphs that you made for homework.
• As a group, decide on which graph best illustrates
the data and be prepared to share your rationale
with the entire class.
3.
4. Alternate Hypothesis
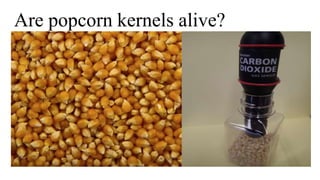
• There was an increase in CO2 because the
popcorn kernels were covered in mold, which is
alive and produces CO2.
6. Clicker Question
In this additional experiment, the independent
variable is _____.
A. the number of corn kernels
B. the amount of fungicide
C. the amount of CO2
D. temperature
E. both A and D
7. Clicker Question
In this additional experiment, the dependent variable
is _____.
A. the number of corn kernels
B. the amount of fungicide
C. the amount of CO2
D. temperature
E. both A and D
8. Clicker Question
In this additional experiment, things you would
want to standardize include _____.
A. the number of corn kernels
B. the amount of fungicide
C. the amount of CO2
D. temperature
E. both A and D