SlideShare a Scribd company logo
1 of 27
Download to read offline
1
Factors affecting online shopping behavior among consumers during COVID-19 pandemic:
Case of Multiethnic Malaysia
Abstract
With the rapid development of technology, online shopping is growing more rapidly in Multiethnic
Malaysia. However, since the spread of COVID-19 and the announcement of the Movement
Control Order (MCO), it has created an impact on the consumers’ lifestyles and shopping activities
as the limited movement made it difficult to access necessities. Thus, online shopping is becoming
essential. The present study aims to examine the factors affecting online shopping behavior of
consumers during the COVID-19 pandemic in Multiethnic Malaysia. This study intends to
examine the relationship between Convenience, Price, Trust and Social Media and consumer
buying behavior during COVID-19 Pandemic. A probability simple random sampling technique
was utilized in distributing a survey-based questionnaire, and 107 responses were collected from
a consumer residing in Malaysia. The collected data was analyzed using SPSS software through
descriptive statistics, reliability test, correlation, and regression. The findings revealed no
relationship between the independent variables; convenience, price, trust, and social media with
the dependent variable; online shopping behavior. These negative findings implicate that all the
independent factors are not among the determinants of consumers’ online shopping behavior as
earlier studies showed. Hence, the findings of the study shed new knowledge on online shopping
behavior during the COVID-19 pandemic outbreak since a consumers’ behavior today differs from
their earlier behavior before the spread of COVID-19 all across the globe. The results from the
research may be useful for online businesses and potential online businesses who plan to invest in
e-commerce as it helps them to understand online consumer behavior and build a proper strategy,
especially during a pandemic. The implications of the study are discussed in the paper.
Keywords: e-commerce; COVID-19; pandemic; online shopping; consumer; behavior; convenience;
price; trust; social media.
Introduction
In late 2019, there was a virus called coronavirus, which was also known as COVID-19, that was
first detected at a wet market located in Wuhan, China. The virus has spread all over the world and
declared a pandemic by the World Health Organisation. It is through touch or direct contact with
a positive COVID-19 patient (WHO, 2020). However, in early September 2020, there have been
more than 28.6 million confirmed COVID-19 cases from over 180 different countries and over
1.34 million deaths in November 2020. Whereas in Malaysia, 52638 cases, with 329 deaths and
about 39088 that have recovered, and these numbers keep on increasing (MOH Nov, 2020). Due
to the COVID-19 outbreak, a lot of activities have been disrupted such as teaching and learning,
sports, business activities which include retail business, world trade, supply chain, and other kinds
of activities (Noor Isa & Mazhar, 2020). To prevent the virus from spreading even further, the
Malaysian government has taken control over the public’s movement, such as enforcing lockdown,
movement restrictions, and social distancing. In addition, they implemented border control,
restricting tourists to enter Malaysia except for essential and official business travel. As a result,
2
the public was forced to stay indoors to ensure their safety, and many businesses such as shopping
malls, restaurants forced to close down, except for supermarkets (Yeoh, 2020).Furthermore, ever
since the border control, Malaysia has been experiencing a lack of tourists coming into the country.
This has led to many businesses to suffer, especially the small and medium enterprises, resulting
in a weak economy and poor financial reports leading to major loss of RM63 billion (Isa et al,
2020; Povera et al., 2020). After the lockdown lifted, the public and businesses had to abide by the
social distancing rule. This has resulted in lengthy queues and long waiting-time for consumers,
which is inconvenient and less productive. Ahmed, Ghingold and Dahari (2007) stated Malaysia’s
shopping is considered as one of many leisure activities as various consumers prefer to go to the
mall, not only because of the products but also to socializing with friends. However, social
distancing rule restricted the consumer longer stay in malls, and people spend time at home with
family or working from home as schools also remain closed until January 2021.
In COVID-19, businesses need to find a way to survive as well as meet the demand of consumers
in the market by utilising the internet, mobile devices, computers, laptops, and other kinds of
advanced technology and move towards electronic commerce (Sangurde,2019). Many businesses
have turned to electronic commerce as a new way of doing business since consumers prefer to
purchase online these days for convenience, safety and health reasons (Bucko et al., 2018; Hsu,
2008). In the current situation, the e-commerce market in Malaysia is now booming and expected
to continue growing for the next five years. During the movement restriction period, there was a
change in the consumer online shopping behaviour, which resulted in soaring online sales (Li et
al., 2020; Azami, 2019).
In the local perspective, business needs to have a better understanding of the marketplace for their
products and services, as well as target consumers before they interact or engage with them online.
Also, it is difficult to predict the online shopping behavior of consumers. Still, by maximizing
advantage, online sellers can help to reduce the threats that can motivate consumers to shop online
(Bashir et al., 2018; Gupta, Bansal & Bansal, 2013; Dachyar & Banjarnahor, 2017; Mehta, Bansal
& Bagga, 2017; Athapaththu & Kulathunga, 2018; Azami, 2019; Olasanmi, 2019). However,
online shopping behaviour can also be affected by many situational factors. One of the most
significant situational factors these days is the COVID-19 pandemic. For the present study, four
factors are selected i-e convenience, price, trust, and social media. The reason for choosing
convenience is because it is one of the main factors that people switch to online shopping,
especially during the MCO, consumers have no way to get to the products. Secondly, price is also
another main factor as few consumers are willing to pay more for the sake of health and safety
reasons during the pandemic specifically as to avoided panic buying, stocking up on the daily
necessities. Thirdly, Trust is a common factor that researchers looked into for online shopping
because consumers usually focus on their protection and the safety of their needs before making a
purchase. Lastly, social media, as most of the businesses shifted towards online to reach out and
engage with the consumers, is through social media marketing. More importantly, these factors
could be different between online shopping before and during the COVID-19 pandemic or in
MCO, since consumers who limit their movements outside these days may have several different
factors which they never considered before (Yeoh, 2020). It is the main gap that the present study
is trying to investigate.
3
Literature Review
Underpinning Theories
Technology Acceptance Model states that behavior is influenced by attitude, and attitude is
influenced by ‘trust’. Trust is one of the main factors that influence consumers’ online purchases
as it plays a key role in changing the attitude of consumers, such as from becoming online visitors
to online buyers. While shopping online, consumers rely on the online seller’s promises, as they
have no control over the certainty and their fulfilment of expectations. They also cannot see or
inspect the purchased product, or meet with the online sellers. Some consumers avoid shopping
online due to fraud and payment processes. It shows that online sellers need to build trust with
online consumers as trust does not just happen; it needs to be built from scratch (Povera et al.,
2020). Online sellers gain the customer trust by delivering products and services in time and help
in building a positive attitude of consumers towards online stores that affect their shopping
behavior (Suleman et al., 2019). Another commonly used independent variable is. convenience
that motivates consumers to shop online as it helps to save time and reduce costs. It has a direct
influence on consumers’ attitudes and shopping behavior. While shopping online, consumers can
save time and can get the product via express delivery and free delivery. It enhances consumers’
intention to purchase the product or service and affect consumers’ satisfaction, which influence
the behavior of repeat purchase (Sundstrom, 2008). Furthermore, Social Cognitive Theory claims
that individuals learn from one another as consumers gather information from either
communicating with other people or reading online. Due to the high number of risks involved
when shopping online, this is where social media plays an important role, providing information.
Many potential online consumers prefer to wait and observe the reviews of other consumers (Yun,
2011).Therefore, when consumers search and gather information from other consumers, this is
considered to be a part of a learning process in which consumers observe the successful experience
of their social groups before they decide to purchase the product or not. With the help of the social
cognitive theory described above, how the ‘social media’ factor affects the customer buying
behavior is depicted.
What is Online Shopping?
Online shopping is defined as the action of buying products or services through the internet
(Sunitha & Gnanadhas, 2014). It is very different from conventional shopping as all the business
activities and transactions conducted through an online platform. It has provided convenience to
consumers, where it allows them to shop at any time, place, and there are no boundaries between
countries. Consumers will no longer have to travel to the store, shopping malls, or the supermarket
to purchase the products by saving time and money altogether (Punj, 2011; Takaya, 2016 ).
Whereas for conventional shopping, consumers have to leave their homes and travel to the store,
thus, benefit associated with conventional shopping is to see touch and feel the actual product
before making a purchase. Apart from that, it allows consumers to have a face-to-face interaction
with the seller, which helps to avoid confusion, and products can be returned easily (Kushwah &
Singh, 2019).In Malaysia, online shopping started to grow since the launch of eBay in 2004 (The
Star, 2004), which provided the local sellers and buyers greater economic opportunities (Chew,
2018). Many factors can affect the online shopping behaviour of consumers such as reputation,
security, discreet purchases, and others (Azami, 2019). However, the present study focused on
4
four factors, namely convenience, price, trust, and social media. Under the dependent variable, it
has only one variable, which is online shopping behaviour. Online sellers have placed their
attention on understanding what affects the behaviours of consumers when they shop online. With
such knowledge, it can assist online sellers as well as researchers to understand what the consumers
are thinking and how it can affect their shopping behavior while making online purchases (Dube,
Asiedu & Phiri, 2018). Online shopping behaviour is exhibited by consumers while visiting online
stores to browse, select and order products and services in conformity with their resources
available, with an intent to satisfy their wants and needs (Luigi, Gheorghe & Mircea, 2015).
Consumers used to go through six stages of the consumer buying decision process depending on
the degree of complexity (Munthiu, 2009). Past studies measured consumer behaviour through
different dimensions. Attitude of a consumer towards utilitarian motivation. It includes cost-
saving, time effectiveness, variety of product selection, quality of products, services, and
convenience. The second dimension is the hedonic motivation, which includes excitement and
happiness (Gazukara et al., 2014). The third dimension is perceived usefulness and ease of use
while. In contrast, dimension is perceived risks such as financial risk, security, and privacy, which
determines the behaviours of consumers towards online shopping (Baber et al., 2014), while bad
experience may harm the online shopping behaviour of consumers. According to Monsuwe et al.
(2004), the trust of consumers can be built from a positive online shopping experience and reduces
the perceived risk. Povera et al., 2020 stated that majority of Malaysian between ages 15- 64-do
online shopping. On average, they spend at least 8 hours a day on the internet with their mobile
devices, laptops, computers, and tablets, doing some form of shopping-related activity, from
researching, browsing to ordering a product or service online. Before the occurrence of the
COVID-19 pandemic, the top three product categories that Malaysian consumers normally
purchase online were electronics and media, fashion clothing and beauty cosmetics, food and
personal care. However, consumers’ online shopping behaviour started to change during the MCO
and strongly influenced by social media. (Hasanat et al., 2020).
Convenience and Online Shopping Behavior
‘Convenience’ is one of the main factors that cannot be overlooked. A study by Kwek, Tan & Lau
(2010) stated convenience as a prime motivator for most of the consumers to shop online and to
interact with the online sellers. The concept of ‘convenience’ is more complex than simply offering
fast checkouts. It concerns psychological costs such as stress, as non-monetary costs that include
time and effort. There are different forms of convenience, such as access, search, possession,
transaction, time, and place as Pham et al. (2017) stated all the dimensions of convenience has a
positive effect on online shopping behaviour. Dube, Asiedu & Phiri (2018) explained that some
consumers prefer to shop online to avoid the face to face interaction with the salesman because it
adds more stress as they can easily manipulate consumers into buying the products. In line with
this, Takaya (2016) opined that consumers find online shopping convenient because it is easy for
them to search for the products that they are looking in. With that, they can compare many kinds
of products and services provided by many different online sellers from all over the world. Another
study by Isa, Shah, Palpanadan & Isa (2020) suggested that convenience is not only the 24 hours
a day for a week operating time, where consumers have a lot of time to decide on the products as
5
they prefer to purchase without the pressure of a salesman. Similarly, the access that consumers
have to a lot of stores from different Katawetawaraks & Wang (2011) revealed about 58% of
respondents prefer to do their shopping online because they can shop after-hours when the physical
stores are closed, and 61% of respondents chose to shop online to avoid the crowds and long
queues, especially during the holiday season. Besides that, some consumers not only look for
products when it comes to online shopping.The studies have concluded that convenience will result
in consumers making repeat purchases. Based on these arguments, the following hypothesis is
developed.
H1: Convenience positively affects consumers’ online shopping behaviour.
Price and Online Shopping Behavior
When it comes to online shopping, price is very important for consumers as Lo Hsieh & Chiu
(2014) found that greater savings are considered as another motivating factor for consumers to
shop online. In the online market, lower prices usually attract consumers apart from convenience.
Online consumers are more concerned with monetary value, lower market prices, and special
offers on goods and services. About 85% of consumers used to do price research when they shop
online. A similar study by (Chew, 2018) proposed price as the second prime factor that led
consumers to shop online. The reason behind this is the competitiveness of online markets. With
the pressure of existing and new online sellers, many businesses have to cut down the prices by
offering special deals and promotions, to attract online consumers. In another study by Dube,
Asiedu & Phiri (2018) iterated the income of international students varies as some students are
self-funded, on scholarship, or come from a family with a background. It just shows how
consumer’s international students, as well as the local students, can be affected by the price of the
product due to the restricted income level. Scheinbaum & Kinney’s (2009) findings confirmed the
importance of price incentives for online consumers. Furthermore, Natarajan et al. (2017)
suggested that placing a price on a product is an important decision of online sellers as it is
considered to be one of the core success factors for a product. The reason behind that as the price
of a product can determine the consumers’ buying decisions that affect their shopping behaviour.
According to Punj (2011), consumers with lower income tend to value money, as they prefer online
shopping to conventional shopping because they believe shopping online saves money. Hence, the
discussion following hypothesis is proposed.
H2: Price positively affects consumers’ online shopping behaviour.
Trust and Online Shopping Behaviour
Zendehdel et al. (2011) define Trust in terms of online shopping as the willingness of a consumer
to rely on another party and vulnerable towards other party’s action with certain expectations that
the other party will carry out and delivery of products and services as promised. It plays an
important role in the creation of expected outcome in online transactions. Thus, Trust is considered
6
a key factor that influences the behaviour of consumers, and it leads towards the online transaction.
Online sellers need to be aware of the online shopping process, and this includes delivering the
right product on time to the right address. Trust can also be developed from efficient customer
services. Consumers consider Trust to be of the highest importance because it helps to reduce the
fear of uncertainty, especially in an e-commerce market where the uncertainty is extremely high.
Isa et al. (2020) found online shopping is strongly based on the Trust of consumers, especially
when there is minimal face-to-face interaction between the sellers and consumers in an online
environment. With a sense of Trust, it can reduce the perception of risk in online shopping;
consequently eliminate the consumers’ psychological concerns about online shopping. Online
sellers need to focus on building a long-term relationship with their consumers, which is through
delivering Trust. In other words, if consumers find the online sellers to be trustworthy, they will
most likely engage in online shopping, as they feel secure towards the online transaction process.
The Trust of consumers can be determined by the quality of the products and services delivered
by online sellers. If consumers have Trust toward the online sellers or the websites, and consider
that the online environment is safe and secure, more online shopping, transactions will occur
(Athapaththu & Kulathunga, 2018). Based on Dube, Asiedu & Phiri (2018) study, online shopping
can be difficult, especially when consumers do not trust the website and the information they
provide. Online consumers will probably purchase from a website they trust. This Trust can be
influenced by consumers’ experience of online shopping or the reputation of the website.
Consumers often feel frustrated buying products from China as it becomes difficult to know
whether the products being purchased are original or Chinese copy. On that note, the following
hypothesis is proposed:
H3: Trust positively affects consumers’ online shopping behaviour.
Social Media and Online Shopping Behaviour
Edosomwan et al. (2011) define social media as a media that is mainly used to transmit information
with mass audiences. It also allows users either consumers or online sellers, to share content. The
social media content includes written posts, images, videos, live-videos, video-story, reviews,
contests, announcements, offers and promotions, external links, and more. With this kind of
content, it can influence the online shopping behaviour of consumers. Social media influences
consumers' shopping behaviour in all age groups, especially the younger generations. Deloitte
Digital (2014) report stated about 47% were millennials, and 19% were from all other age groups.
According to Statista (2020), the most commonly used social media platforms are Instagram,
YouTube, Facebook, Twitter, TikTok, Snapchat, and many more. Voramontri & Klieb (2019)
suggested that social media is also seen as a new form of 'electronic word-of-mouth', where online
consumers provide ratings and reviews of products and services on the social media platform.
(Janio, 2020; Elisabeta, 2014). Jothi & Gaffoor (2017) disclosed that consumers do not depend on
one source of information to enhance their product and service-related knowledge. Xhema (2019)
suggested that consumers have directed to social media as a new way of getting information about
a product or service. Sangurde (2019) added that consumers frequently turned to many kinds of
social media platforms to search for more information and decide. However, the study by
Voramontri & Klieb (2019) found that overloading information is the main issue for consumers in
online decision-making because an individual can only process a limited amount of information,
as it is not practical to evaluate all options in depth. In line with this, Xhema (2019) further clarified
7
that social media had created a certain culture where users with other like-minded individuals
communicate with each other, share information, monitor updates, and gather opinions.
Consumers, who spend more time on social media, looking into reviews before deciding, tend to
be involved in complex buying. Elisabeta (2014), on the other hand, stated that with social media
progressing, businesses took the opportunity to use social media as marketing tools to promote
their businesses and services. It includes attracting potential consumers and building long-term
relationships with them through interactivity (Xhema, 2019). As a result of using social media for
purchases, consumers tend to spend four times more compared to those who do not (Deloitte
Digital, 2014). In Gavin' (2019) study, 74% of consumers depend on social media assistance for
buying decisions, and 78% of consumers' purchases were due to online seller's posts on social
media. Furthermore, the quality of information shared on social media by other users was found
as 61% meet consumers' expectations, 26% find it better, and 13% find it worse (Voramontri &
Klieb, 2019). According to Xhema (2019), social media revolutionizing marketing practices,
consumers are continuously exposed to various advertisements that aim to attract the attention of
consumers (Katawetawaraks & Wang, 2011; Deloitte Digital, 2014). Voramontri & Klieb (2019)
believes happy consumers tend to share their thoughts on social media about praising the products
with reviews and comments. Lastly, with influencers on social media, consumers tend to purchase
products that are recommended by celebrities or public figures because they considered them as
ideal and trust them. It will reflect on consumers' shopping behaviour. Hence, the hypothesis
proposed is mentioned below:
H4: Social media positively affects consumers’ online shopping behaviour.
Conceptual Framework
Four factors were selected to develop the conceptual framework based on the literature review.
The factors are convenience, price, trust, and social media. The selected factors hold stronger
importance for consumers, which relates to online shopping behaviour. According to Kwek, Tan
& Lau (2010), consumers shop online due to convenience. Based on Lo Hsieh & Chiuh’s (2014)
study, price is another reason consumer shop online. Zendehel et al. (2011) stated trust is a key
factor that influences the behaviour of consumers, while (Edosoman et al., 2011) revealed that
social media influences consumers’ shopping behaviour in all age groups. These authors’ studies
contribute to the development of the conceptual framework; Past literature did not reveal the
selected factors testing online shopping behaviour during the pandemic. Figure 1 shows the
proposed conceptual framework.
8
Figure 1: Conceptual Framework
Research Design and Questionnaire Development
The study paradigm follows positivism, which shows the real measure, and establishes a
quantitative research approach as a research design of the methodological procedures. To obtain
the primary data for this research, the researcher used an online self-administered questionnaire
(McLeod, 2018). The method of data collection used in this research is the online questionnaire
survey. The reason for choosing this method is due to the time constraint, and this is the best and
convenient approach to reach a wider target audience and get a quick response from the
respondents (Hair et al., 2006). A probability purposive sampling technique adopted as Pillemer
and Finkelhor (1988) opined about an acceptable sample size with no definitive and
straightforward rule, which has attained a considerable debate in the research field. In this way,
the population frame for the present study comprises 100 respondent located in Klang Valley Area
Malaysia. The first section of the questionnaire identifies the respondent’s profile, such as gender,
age group, nationality, ethnicity, education status, employment status, and income status. The
second section of the survey characterises the respondent’s behaviour in online shopping such as
respondent’s favourability, familiarity, and frequency towards online shopping. Then, it also asks
the time and money spent on online shopping over some time and what product category
respondents usually purchase online. Next, about devices and payment methods, respondents used
to shop online. In the next four sections, it covers respondents’ online shopping behaviour towards
the four variables, which are convenience, price, trust, and social media (Kwek, Tan & Lau, 2010;
Takaya, 2016; Dube, Asiedu & Phiri, 2018; Scheinbaum & Kinney, 2009: Zendehdel et al. 2011;
Athapaththu & Kulathunga, 2018; Sangurde, 2019; Voramontri & Klieb, 2019). The questions
measured on a five-point Likert scale, ranging from 1 that describes “strongly disagree”, 2
describes “disagree”, 3 describes “neutral”, 4 describes “agree”, and 5 describes “strongly agree”.
(Annex-A).
Results and Findings
Demographic Details
Table 1 shows the profile of respondents. The details demonstrate that the majority of the
respondents are male (52.3%), and the rest are female (47.7%). Regarding the age group, 92.5%
of respondents belong to 20-29 years, while 4.7% to 15-19 years, 1.9% to 40-49 years. The
ethnicity skewed towards Malays at 23.4%, with 20.6% Chinese, 10.3% Indian, and 45.7%
belonging to other nationalities. Furthermore, the qualification of the respondents depicts 85.0 %
having a bachelor’s degree, with 1.9 % having a master’s and 0.9 % with a doctoral degree.
Regarding employment status, 80.4 % respondents are students while 8.4% full time employed,
1.9% part-time employed and 8.4% self-employed—the income status of the majority of the
respondents 34.6% with RM 1500 and below.
9
Table 1: Demographic Details
Variable Answer Frequency Percentage Cumulative Percentage
Gender Male
Female
56
51
52.3
47.7
52.3
100.0
Age 15 - 19 years old
20 - 29 years old
30 - 39 years old
40 - 49 years old
5
99
1
2
4.7
92.5
0.9
1.9
4.7
97.2
98.1
100.0
Nationality Bangladesh
Brunei
China
Germany
India
Indonesia
Iran
Jordan
Malawi
Malaysia
Maldives
Mexico
New Zealand
Norway
Pakistan
Philippines
Seychelles
Sri Lanka
Sudan
U.A.E
Zimbabwe
3
13
4
1
4
2
2
1
1
40
8
1
1
1
11
1
1
2
5
4
1
2.8
12.1
3.7
0.9
3.7
1.9
1.9
0.9
0.9
37.4
7.5
0.9
0.9
0.9
10.3
0.9
0.9
1.9
4.7
3.7
0.9
2.8
15.0
18.7
19.6
23.4
25.2
27.1
28.0
29.0
66.4
73.8
74.8
75.7
76.6
86.9
87.9
88.8
90.7
95.3
99.1
100.0
Ethnicity Malay
Chinese
Indian
Others
25
22
11
49
23.4
20.6
10.3
45.7
23.4
43.9
54.2
100.0
Academic Qualification High School
Diploma
Bachelor’s Degree
Master’s Degree
Doctorate
7
6
91
2
1
6.5
5.6
85.0
1.9
0.9
6.5
12.1
97.2
99.1
100.0
Employment Status Student
Full-time
Part-time
Self-employed
Unemployed
86
9
2
9
1
80.4
8.4
1.9
8.4
0.9
80.4
88.8
90.7
99.1
100.0
Income Status RM1,500 and below
RM1,501 - RM2,000
RM2,001 - RM3,000
RM3,001 - RM4,000
RM4,001 and above
37
29
15
7
19
34.6
27.1
14.0
6.5
17.8
34.6
61.7
75.7
82.2
100.0
Descriptive Analysis
Table 2 depict the online shopping behaviour of respondents as (44.9%) strongly agree that they
favor online shopping, (37.4%) agree, (14%) are neutral and remaining (3.7%) disagree in
10
favoring online shopping. Regarding familiarity with online shopping (15%), respondents only
agree, and the rest remain neutral. In response to experience of online shopping (28%) respondents,
shop more than once in a week, (10.3%) shop in a week, (13.1%) once in two weeks, (14%) shop
more than once in a month, the majority of (30.8%) shop once in a month. About duration in one
day to spend, online shopping majority (41.1%) spent up to 1 hour, (36.4%) spent up to 3 hours,
(9.3%) 6 hours, and the remaining minimum of 7 hours. Regarding amount, spend in month for
online shopping (30.8%) spent RM400 and over, (12.1%) RM300 -RM400, (18.7%) RM200 -
RM300, (21.5%) RM100 - RM200 and the rest only spent up to RM100.
Based on the product category, the majority of the respondents have selected to purchase online
entertainment (62), technology (59), fashion clothing & accessories (58), food & drinks (58),
health & beauty (41), and groceries (36). While a number is chosen sports & outdoor (22), personal
care & pharmacy (21), home appliances (18) and stationery & hobby supplies (17) that still
outweigh home & furnishing (10), books & magazines (9), pet care (9), DIY & Garden (6) and
toys & baby equipment (1). 93 selected mobile phones and this may be because mobile phones are
the closest and convenient device that they have on them, and people often use their mobile phone
device to research before making a purchase. Fifty-three selected a laptop, 12 desktop, and other
12-selected tablets. Based on payment methods, the majority prefer to use credit or debit cards
with 77 respondents. 24 used cash and followed by 20 that used bank transfer, PayPal or equivalent
is the payment method respondents used the least with some 11 respondents. During the Movement
Control Order (MCO) period, (80.4%) respondents have noticed that they have made more
purchases as compared to the non-MCO period, and the rest of the respondents claimed that they
did not purchase more. Out of 107 respondents, (83.2%) say that they would continue to make
online purchases after the MCO is lifted, (7.5%) said no, and the remaining say that they may
continue to shop online. Concerning the recommendation, (97.2%) respondents recommend online
shopping to other people and (2.8%) chosen not to recommend.
Table 2: Descriptive Details of Online Shopping Behavior of Respondents
Variable Answer Frequency Percentage Cumulative
Percentage
Do you favors online
shopping?
1 - Strongly Disagree
2 - Disagree
3 - Neutral
4 - Agree
5 - Strongly Agree
0
4
15
40
48
0
3.7
14.0
37.4
44.9
0
3.7
17.8
55.1
100.0
How familiar are you with
online shopping?
1 - Strongly Disagree
2 - Disagree
3 - Neutral
4 - Agree
5 - Strongly Agree
0
0
14
16
77
0
0
13.1
15.0
72.0
0
0
13.1
28.0
100.0
How often do you shop
online in a month?
More than once a week
Once a week
Once in two weeks
More than once in a month
Once in a month
Not at all
30
11
14
15
33
4
28.0
10.3
13.1
14.0
30.8
3.7
28.0
38.3
51.4
65.4
96.3
100.0
How many hours do you
spend on online shopping per
Less than 1 hour
1 hour to 3 hours
44
39
41.1
36,4
41.1
77.6
11
week? 4 hours to 6 hours
7 hours and above
10
14
9.3
13.1
86.9
100.0
How much do you spend on
online shopping per month?
Less than RM100
RM100 - RM200
RM200 - RM300
RM300 - RM400
RM400 and above
18
23
20
13
33
16.8
21.5
18.7
12.1
30.8
16.8
38.3
57.0
69.2
100.0
*What kind of
products/services do you buy
from online stores?
Technology
Household Appliances
Groceries
Food & Drinks
Health & Beauty
Fashion Clothing & Accessories
Online Entertainment
Home & Furnishing
Sports & Outdoor
Toys & Baby Equipment
Books & Magazines
Pet care
Personal Care & Pharmacy
DIY & Garden
Stationery & Hobby Supplies
59
18
36
58
41
58
62
10
22
1
9
9
21
6
17
13.8
4.2
8.4
13.6
9.6
13.6
14.5
2.3
5.2
0.2
2.1
2.1
4.9
1.4
4.0
13.8
18.0
26.5
40.0
49.6
63.2
77.8
80.1
85.2
85.5
87.6
89.7
94.6
96.0
100.0
*Which device do you use
when shopping online?
Desktop
Laptop
Mobile
Tablet
12
53
93
12
7.1
31.2
54.7
7.1
7.1
38.2
92.9
100.0
*Which type of payment do
you prefer to use when
shopping online?
Credit Card / Debit Card
Bank Transfer
PayPal or equivalent
Cash
77
20
11
24
58.3
15.2
8.3
18.2
58.3
73.5
81.8
100.0
Do you purchase more
during the MCO?
Yes
No
86
21
80.4
19.6
80.4
100.0
Would you continue to shop
online after the MCO is
lifted?
Yes
No
Maybe
89
8
10
83.2
7.5
9.3
83.2
90.7
100.0
Would you recommend other
people to shop online?
Yes
No
104
3
97.2
2.8
97.2
100.0
Convenience Factor
Table 3 shows the summary statistics of means and standard deviation of the convenience factor.
The most strongly rated by the respondents were items related to convenience. Under the
convenience factor, items such as C5; I can shop online whenever I want to, C4; shopping online
helps me to avoid crowds, and C3; shopping online helps me to save the effort of visiting physical
stores, were equally important to respondents with a mean score over 4.5. Items such as C6; online
shopping has the advantage of a wide selection of products, C8; I can make discreet purchases,
and C7; I always find the products/services I want online, were also important to persuade
respondents to shop online with a mean score between 4 and 4.49. Items such as C1; shopping
online helps me to save time and C2; shopping online helps me to save money, received a mean
score of 3.9 and below. They were not the main reasons for respondents to shop online. Although
there are many, who have agreed that online shopping saves money and time, nearly half of the
respondents disagree with that statement.
12
Table 3: Descriptive Statistics for Convenience Factor
Item Question Mean Std. Deviation
C5 I can shop online whenever I want to. 4.63 0.694
C4 Shopping online helps me to avoid crowds. 4.60 0.738
C3 Shopping online helps me to save the effort of visiting physical stores. 4.58 0.615
C6 Online shopping has the advantage of a wide selection of products. 4.21 0.942
C8 I can make discreet purchases. 4.21 0.998
C7 I always find the products/services I want online. 4.16 1.011
C1 Shopping online helps me to save time. 3.90 1.303
C2 Shopping online helps me to save money. 3.25 1.353
Price Factor
Table 4 shows the summary statistics of means and standard deviation of the price factor. Under
the price factor, only item P3; I visited different online stores to take advantage of the best prices,
received a mean score over four. It is the most important item in the price factor for respondents.
Items such as P5; I take advantage of free shipping, P2; I compare prices to take advantage of
special offers when I shop online, and P8; I pay extra for the quality, were rated highly with a
mean score between 3.99 and 3.5. Items such as P1; I always compare prices between online and
in-store, before I decide to purchase the product, P4; I often shop online to get points for discounts,
and P6; I do not mind paying extra for express shipping, were equally important to respondents
with a mean score above 3. Respondents disagree that they would pay extra for the brand reflected
in the lowest mean score of 2.99, on item P7; I pay extra for the brand.
Table 4: Descriptive Statistics for Price Factor
Item Question Mean Std. Deviation
P3 I visited different online stores to take advantage of the best prices. 4.19 1.158
P5 I take advantage of free shipping. 3.98 1.373
P2 I compare prices to take advantage of special offers when I shop online. 3.90 1.373
P8 I pay extra for the quality. 3.79 1.242
P1 I always compare prices between online and in-store, before I decide to
purchase the product.
3.25 1.461
P4 I often shop online to get points for discounts. 3.17 1.495
P6 I do not mind paying extra for express shipping. 3.12 1.445
P7 I pay extra for the brand. 2.99 1.411
Trust Factor
Table 5 summarized the statistics of means and standard deviation of the trust factor. There are no
items with a mean score above four. Items such as T5; I often get the product that matches the
description from the online seller’s website, T4; online websites offer secure personal privacy, T3;
13
online shopping websites are dependable in their claims, T1; products shown on online shopping
websites are reliable, and T2; online shopping websites are authentic in their claims, were rated
highly among the respondents with a mean score over 3.5. Item T7; I often receive malfunctioning
products when shopping online, is the only item that received the lowest mean score of 1.98. It
means most of the respondents receive functional products when they purchase online.
Table 5: Descriptive Statistics for Trust Factor
Item Question Mean Std. Deviation
T5 I often get the product that matches the description from the online seller’s
website.
3.98 0.879
T4 Online websites offer secure personal privacy. 3.76 0.845
T3 Online shopping websites are dependable in their claims. 3.75 0.912
T1 Products shown on online shopping websites are reliable. 3.56 1.083
T2 Online shopping websites are authentic in their claims. 3.55 1.057
T6 I have difficulty verifying product quality when shopping online. 3.39 1.392
T8 Online sellers respond on time when I contact them through email/online
chat.
3.07 1.096
T7 I often receive malfunctioning products when shopping online. 1.98 1.141
Social Media Factor
Table 6 depicts the summary statistics of means and standard deviation of social media factor.
Respondents rated highly on items such as SM2; I look for product/services reviews on social
media, and SM3; I find products and services reviews on social media are reliable, with a mean
score above four. Social media reviews-related were also important to respondents. Items such as
SM8; I find information on social media is sufficient to make a purchase, SM7; I use social media
to communicate with online sellers, and SM4; I often take advantage of the special deals
advertised on social media, were equally important to respondents as they have a mean score above
3.25. Items such as SM6; I use social media to keep up with the latest updates of online stores such
as new products, events, promotions, etc., and SM1; I often buy products/services I see on social
media, received a mean score above 3. Respondents disagree that they often purchase
products/services recommended by social media influencers reflected in the lowest mean score of
2.79 on item SM5; I often purchase products/services recommended by the social media influencer
Table 6: Descriptive Statistics for Social Media Factor
Item Question Mean Std. Deviation
SM2 I look for product/service reviews on social media. 4.05 1.041
SM3 I find products and services reviews on social media are reliable. 4.01 0.927
SM8 I find information on social media is sufficient to make a purchase. 3.73 1.112
SM7 I use social media to communicate with online sellers. 3.45 1.298
SM4 I often take advantage of the special deals advertised on social media. 3.36 1.368
SM6 I use social media to keep up with the latest updates of online stores such
as new products, events, promotions, etc.
3.22 1.500
SM1 I often buy products/services I see on social media. 3.11 1.313
SM5 I often purchase products/services recommended by social media influencers. 2.79 1.505
14
Table seven, show the mean and the standard deviation of the independent
variables; convenience, price, trust, and social media, and the dependent variable; online
shopping behaviour. Convenience and price have a higher mean score of 4.88 and 4.79,
respectively, which reflects that the respondents agree with the importance
of convenience and price to online shopping behaviour. Online shopping behaviour is the lowest,
which implicates that the respondents do not always purchase online.
Table 7: Descriptive Statistics for All Variables
Variable Mean Std. Deviation No. of
Respondents
No. of Items
Online Shopping behaviour 2.58 0.32 107 11
Convenience 4.88 0.38 107 8
Price 4.79 0.46 107 8
Trust 4.42 0.74 107 8
Social Media 4.45 0.83 107 8
Reliability Test
The reliability of the data is computed using Cronbach’s Alpha. Alpha coefficient range in value
is between zero and one. Cronbach’s Alpha value that is lower than 0.6 is considered poor. A value
between 0.6 and 0.7 is considered moderate, and anything above 0.7 is considered good. In Table
9, Cronbach’s Alpha value of online shopping is 0.685 indicating a moderate internal consistency
of items. Convenience has the Cronbach’s Alpha value of 0.703; this indicates good internal
consistency of items. Price has the Cronbach’s Alpha value of 0.875, which indicates an excellent
internal consistency of items. Also, the price has the highest value of Cronbach’s Alpha in
comparison to the other variables. Trust has the Cronbach’s Alpha value of 0.612; this indicates a
moderate internal consistency of items. Social media has the Cronbach’s Alpha value of 0.602,
which is approximately 0.6; this also indicates moderate internal consistency of items.
Table 8: Reliability Test
Variable
Online shopping
behaviour
Convenience Price Trust Social Media
Cronbach’s Alpha 0.685 0.703 0.875 0.612 0.602
Number of Items 11 8 8 8 8
Pearson’s Correlation
In this study, the hypotheses were tested through the analysis of correlations. In correlation, when
Pearson’s r is close to 1, it means that the relationship between the two variables is strong.
15
However, the relationship is weak when Pearson’s r is close to 0. Table 10 shows
that convenience and online shopping behaviour are weakly correlated with the correlation value
of 0.39, indicating that there is a significant positive correlation. It also shows that convenience has
the strongest relationship with the dependent variable; online shopping behaviour, in comparison
to the other independent variables; price, trust, and social media. Price and online shopping
behaviour are also weakly correlated with the value of 0.36, which also indicates a significant
positive correlation. Trust and online shopping behaviour show that they are also weakly
correlated. It is showing a correlation of 0.37 that indicates a significant positive correlation. As
for social media and online shopping behaviour, it demonstrates there is a weak correlation of 0.27,
which is approximately 0.3 but still indicating a significant positive correlation. Therefore, when
there is an increase in convenience, trust, and social media, this will increase online shopping
behaviour. Still, when it comes to price, only a positive price change will lead to an increase
in online shopping behaviour.
Table 9: Pearson’s Correlation Matrix
Online shopping
behaviour
Convenience Price Trust Social media
Online shopping behaviour
Convenience 0.39**
Price 0.36** 0.66**
Trust 0.37** 0.52** 0.41**
Social media 0.27** 0.26** 0.26** 0.56**
**Correlation is significant at the 0.01 level (2-tailed)
Regression Analysis
Table 10 shows that the R-value 45.8%, which means there is a significant correlation between the
independent variables and the dependent variable. The R square determines the contribution of
independent variables towards dependent variables. In the table, the R square is 21%. It means
21% of the time, the independent variables; convenience, price, trust, and social media, contribute
towards the dependent variable; online shopping behaviour. Although R square is weak, this does
not dismiss the model because other factors can influence online shopping behaviour such as an
online store’s reputation, security, and many other factors. The regression model proves that there
is a reliable relationship between independent variables with the dependent variable however small
the percentage is. According to Neter, Wasserman & Kutner (1983), the regression model tends to
show lower adjusted R square when it comes to human social behaviour, even though they are
statistically significant.
Table 1: Model Summary
Model R R Square Adjusted R Square Std. Error of the
Estimate
1 0.458a
0.210 0.179 0.28741
a. Predictors: (Constant), Convenience, Price, Trust, Social Media
16
Table 11 highlight F-value of 6.774 that it reaches to significance with a 0 p-value, which is less
than the 0.01 alpha level. It means a statistically significant relationship present between
independent variables; convenience, price, trust, and social media, and dependent variable; online
shopping behaviour. The model is a good fit.
Table 11: ANOVA
ANOVAa
Model Sum of Square df Mean Square F Sig.
1 Regression 2.238 4 0.560 6.774 0.000b
Residual 8.426 102 0.083
Total 10.664 106
a. Dependent Variable: Online shopping behaviour
b. Predictors: (Constant), Convenience, Price, Trust, Social Media
Table 12 demonstrate that if all the independent variables are held constant, then online shopping
behaviour will be 0.863. The coefficient of the constant is considered to be significant since the
value of t is 2.305. The regression coefficient of convenience is 0.164, with a t-value of 1.561. It
means one unit change convenience will result in 0.164 unit increase in online shopping behaviour.
The regression coefficient of convenience is 0.097, with a t-value of 1.177. It means one unit
change convenience will result in 0.097 unit increase in online shopping behaviour. The regression
coefficient of convenience is 0.051, with a t-value of 1.270. It means one unit change convenience
will result in 0.051 unit increase in online shopping behaviour. The regression coefficient of
convenience is 0.037, with a t-value of 0.926. It means one unit change convenience will result in
0.037 unit increase in online shopping behaviour. However, the results of significant value are
higher than p-value of 0.01, which will lead to the rejection of hypotheses.
Table 12: Coefficients
Coefficients
Unstandardized
Coefficients
Standardized
Coefficients
Model B Std. Error Beta t Sig
1 (Constant) 0.863 0.374 2.305 0.023
Convenience 0.164 0.105 0.197 1.561 0.122
Price 0.097 0.082 0.139 1.177 0.242
Trust 0.065 0.051 0.152 1.270 0.207
Social media 0.037 0.040 0.099 0.926 0.357
a. Dependent Variable: Online shopping behaviour
4.3. Discussion
Kwek, Tan & Lau (2010) stated that convenience is one reason consumers shop online because
it is more complicated than quick checkout. Despite the stress, time, and effort, the finding in Table
17
3 shows that respondents rated highly on convenience. Isa, Shah, Palpanadan & Isa's (2020)
research stated that convenience is 24 hours operation, of which respondents rated highly on item
C5; I can shop online whenever I want to. It has the highest mean score of 4.63 compared to the
other items. The respondent answered positively on item C5, believing that online shopping is
available 24 hours. The finding also shows that respondents chose to shop online to avoid the
crowds with a mean score of 4.6, which is supported by Katawetawaraks & Wang's (2011)
research. Based on Table 7, respondents have answered items related to convenience on average,
4.88 out of 5, which means the majority have agreed and strongly agreed that online shopping
brings convenience. The finding is reliable because convenience has the Cronbach's Alpha value
of 0.703, indicating good internal consistency of items.
Although the finding in descriptive statistics shows positive ratings, the result shows differently
from correlation and regression analysis, contradicting the prior studies done by Kwek, Tan & Lau
(2010), Isa, Shah, Palpanadan & Isa (2020), and Katawetawaraks & Wang (2011). The finding
from Pearson's correlation analysis shows convenience is weakly correlated with online shopping
behaviour with a correlation value of 0.39. means the relationship between the two variables is
weak. In Table 12, the finding also demonstrates that when the convenience increases, online
shopping behaviour increases. In theory, the result presents if convenience increases by one unit,
the online shopping behaviour increases by 0.164. The finding also shows that convenience has a
p-value of 0.122, which is above the significance level of 0.01. It means it is not significant,
and hypothesis 1 is not supported.
The reason that convenience does not affect online shopping behaviour is that apart from the delay
in the product and service deliveries. The convenience of online shopping does not change much
because of the COVID-19 pandemic such as finding products or services online, accessing the
information on the online stores' websites, fast checkout, shop at any time, avoiding crowds, and
other kinds of conveniences. Such convenience will remain the same and will not get affected by
the COVID-19 pandemic. Consumers will continue to shop online and enjoy its conveniences as
a part of the service characteristics which do not have a significant impact on their purchase
behaviour. Furthermore, most of the respondent income is below RM3000, and they are usually
more prudent during the pandemic, especially on the types of product to purchase. Convenience
seems not important to them as long as they receive a good value of a purchase, i.e. monetary
value. Therefore, the result has shown that convenience does not affect online shopping behaviour.
Price is considered to be one of the critical factors for respondents during online shopping.
According to Lo Hsieh & Chiu (2014), consumers are attracted to lower prices other than
convenience. Additionally, Chua et al. (2006) stated that the prices are competitive in the online
market. Although it takes time and effort to find an online store that sells products at a suitable
price, respondents still believe they can find the best prices after visiting several websites, of which
the finding is presented in Table 4. Furthermore, the price may be considered as a catalytic agent
to attract the customer; if the company may offer special discount price for offered products and
services, then it will stamp significant influence on customer motives and consumers' buying
decisions (Satit, Tat, Rasli, Chin, and Sukati, 2012; Munusamy and Hoo, 2008). The consumer is
always seeking a reasonable and discounted price for a product while making an online purchase
and choose the best rate (Kusmawati et al., 2014; Andreti, Zhafira, Akmal and Kuamr, 2013; Clark.
2018). This is especially true since the respondents' income are mostly lower than RM3000.
18
However, the present study revealed that respondents rated highly on item P3: I visited different
online stores to take advantage of the best prices. It has the highest mean score of 4.19 compared
to the other items. Respondents rated high because they believe they can find the best prices after
visiting several websites. Referring to Table 7, the overall average score for the price is 4.79 out
of 5, which means the majority have agreed and strongly agreed that online shopping is essential
when shopping online. The findings are reliable because the price has the Cronbach's Alpha value
of 0.875, which is the highest compared to the other variables, i.e. online shopping
behaviour, convenience, trust, and social media. The reliability test for the price indicated that an
excellent internal consistency of items. However, the price has different findings from the
correlation and regression analysis, contradicting the previous research done by Lo Hsieh & Chiu
(2014) and Chua et al. (2006).
In Pearson's correlation analysis shown in Table 9, the price has a correlation value of 0.36, which
demonstrates that price is weakly correlated with online shopping behaviour. It would mean the
two variables have a weak relationship. In Table 12, the finding shows that
when price increases, online shopping behaviour increases too. In theory, the result presented
shows if the price increases by one unit, the online shopping behaviour increases by 0.094. The
finding also shows that price has a p-value of 0.242, which is higher than 1% the significance
value. It indicates that the price is not significant, and hypothesis 2 is not supported. Here,
why cost does not affect online shopping behaviour is because online stores have existed long
before the COVID-19 pandemic spreading rapidly. Consumers have been purchasing products and
services regardless of the COVID-19 epidemic, and the price of many products seem to change
due to limitation of resources. Consumers, however, will continue to make online purchases,
especially for products related to the daily necessities items such as food, since it is the basic needs
of humans regardless of price since they need the products, and they are trying not to get out of
the home to purchase safety and health reasons. Hence, price is not a big issue to consumers during
the pandemic. Therefore, the price does not affect online shopping behaviour.
Trust is a critical factor that influences the behaviour of consumers. According to Isa et al. (2020),
it is expected that online stores should provide consumers with correct information concerning the
product. Despite the risk that comes along with online shopping, consumers are still willing to
shop online. In Table 6, respondents rated highly on item T5; I often get the product that matches
the description from the online seller's website with a mean score of 3.98. Respondents rated
highly because they usually receive products that fit with the description. Table 8 demonstrates
that trust has an overall average score of 4.42 out of 5. Although the majority have agreed
that trust is an important factor in online shopping, trust has the lowest average mean score
compared to the other independent variables; convenience, price, and social media. The finding is
reliable because trust has the Cronbach's Alpha value of 0.612, indicating the right internal
consistency of items.
Although the finding in descriptive statistics shows positive ratings, the result shows differently
from correlation and regression analysis, contradicting the prior studies done by Zendehdel et al.
(2011), which confirmed that trust has a strong relationship the online shopping behaviour of
consumers. The finding in Table 9 shows that the correlation value for trust is only 0.37, which
indicates a weak correlation. It means trust and online shopping behaviour has a weak
19
relationship. In Table 12, the finding presents that when trust increases, online shopping
behaviour increases. In theory, the result demonstrates if trust increases by one unit, the online
shopping behaviour increases by 0.065. Furthermore, the finding shows that trust has a p-value of
0.207, which is above the significance level of 0.01. It means it is not significant, and hypothesis
3 is not supported.
Trust does not affect online shopping behaviour as trust lies between online sellers and
consumers. It has no significant relation to the COVID-19 pandemic. Trust depends on the
experience of online shopping. It is built on the quality of information, quality of products and
services, online reviews, and its website's quality. Consumers will continue to make online
purchases with the online sellers they trusted, and their service performance can only effect trust.
Therefore, the result has shown that trust does not affect online shopping behaviour.
Social media is an essential factor of online shopping as the source of information relating to
products and services. The finding in Table 6 has shown that respondents rated highly on item
SM2; I look for products/services reviews on social media, which is aligned with Elisabeta (2014)
research, which stated that consumers look for information concerning desired products or services
on social media. It has the highest mean score of 4.05 in comparison to the other items related to
social media. Respondent also rated highly on item SM3; I find products and services reviews on
social media are reliable. It receives an average of 4.01. Voramontri & Klieb (2019) stated that
consumers tend to post their online shopping experience on social media, including products and
service reviews. Respondents believe the reviews on social media are authentic, coming from
social media users themselves. The finding is reliable because social media has the Cronbach's
Alpha value of 0.602, indicating the right internal consistency of items.
However, social media has different findings from the correlation and regression analysis, which
contradicts the prior research done by Edosomwan et al. (2011), that stated social media influences
consumers' shopping behaviour. The finding from Pearson's correlation analysis
shows convenience is weakly correlated with online shopping behaviour with a correlation value
of only 0.27. It means the relationship between the two variables is weak. In Table 12, the finding
also demonstrates that when the convenience increases, online shopping behaviour increases. In
theory, the result presented shows if convenience increases by one unit, the online shopping
behaviour increases by 0.037. The finding also shows that convenience has a p-value of 0.357,
which is above the significance level of 0.01. It means it is not significant, and hypothesis 4 is not
supported.
Notably, social media does not affect online shopping behaviour because, before the spreading of
COVID-19, most internet users have been using social media to search for products and services
reviews, online stores' updates, and more, apart from socializing. Thus, the use of social media has
no shown a significant relation to COVID-19 pandemic. It is because consumers will continue to
use social media for product and service reviews, make online purchases, and keep up with online
stores' updates, before, during and after the pandemic.
Recommendation and Conclusion
20
Based on the result and conclusion of this research, there are some recommendations which can
help online businesses or potential online businesses formulate their strategies; marketing, pricing,
and others. The finding in the research has shown that convenience has the highest importance
compared to the other independent variables. Under the convenience factor, respondents scored
highest on item C5; I can shop online whenever I want to. It means consumers favor online
shopping because of the 24 hours operation. In order to increase consumers’ satisfaction, online
sellers should provide a 24/7 chatbot during non-working hours. By adding this feature to the
website, it can assist consumers in finding solutions to issues that they are facing. Another
convenience item is C4; shopping online helps me to avoid crowds. This means there will be a
time when many consumers are going to visit the online store. Therefore, online sellers need to
maintain their websites to prevent it from crashing. The following item is C3; shopping online
helps me to save the effort of visiting physical stores. Consumers usually visit physical stores
because they want the product immediately. By offering more convenience, it can increase
customer satisfaction and increase loyalty, such as providing same-day delivery.
As for the price factor, one of the top items related to price is C5; I take advantage of free shipping.
Based on the result, consumers enjoy free shipping when shopping online. In order to remain as
one of the top items related to price, online sellers should create a strategy that keeps consumers
shopping on their websites such as consumers may enjoy free shipping when they reach a certain
price. Next is the trust factor. The top item related to trust is T5; I often get the product that matches
the description from the online seller’s website. The overall average score for that item is 3.98 out
of 5. This means there are online sellers that did not provide an accurate description of the product.
Online sellers need to ensure that the information that they provide on their website is accurate. A
positive online shopping experience will not only increase customers’ satisfaction but also trust.
Consumers also rated highly on item T4; online websites offer secure personal privacy. This is
because consumers appreciate privacy. Online sellers should take note that privacy is important to
consumers and that they should not share any consumers’ details such as email, contact number
and more, to a third party.
Lastly, it is the social media factor. The top item related to trust is SM2; I look for
products/services on social media. Online sellers need to keep their consumers happy. The reason
for this is because not only this will increase customers’ satisfaction and loyalty, and improve
brand image, but also consumers tend to share their experience on social media regarding a product
or service they have purchased. In other words, when a consumer has a bad experience using a
product or service, they tend to leave their (negative) review on social media, where other
consumers can see and share the post. Online sellers should always monitor their social media
account, responding to issues and inquiry. Online sellers should also keep their social media
account up to date, as a result, has shown that there are consumers to follow and keep up with the
latest news for new products, promotions and events, with a mean score of 3.22 out of 5.
In addition to the above, marketers and businesses have to take into consideration the pandemic
issue which will continue to deter their business for another year or two. They should be prepared
to serve customers effectively via online, i.e. e-commerce and business transactions. Consumers
today and soon will become more prudent with each purchase, and they will only choose the best
products to purchase and repurchase. Therefore, marketers and businesses must be able to offer
more product options with good value to keep a customer from switching to competitors’ products,
and improvement on services is essential to retain the customers and to increase their satisfaction.
21
Limitations and Future Research
There are several limitations to this research, such as the small sample size was used in this
research. Larger sample size could have been attained, given that there is an adequate time frame
to conduct the research and gather the data. Secondly, majority of the respondents are aged
between 20 - 29 years old, as Taylor’s University has been used as the primary target location for
data collection and targeting university students. However, non-student respondents participated
in this study. Exploring other locations will not only increase the sample size but also respondents
from different age groups. Thirdly, the distribution channels that were used to gather the data,
which were email and social media such as Facebook group, and WhatsApp. The majority of the
social media users are the younger people; therefore, the research was not able to cover much of
people in the age group 30 and above. Fourthly, the possibility of multi-response when distributing
the survey online, it is not possible to monitor the respondents, ensuring that they have submitted
the online survey one time. This is the main issue when distributing surveys online. Additional
software should be added to prevent the respondent from submitting the survey more than once.
However, the software was not available. Future researches may cover the whole of Malaysia;
increase the sample size, including people from different age groups, educational and employment
backgrounds. With this kind of research, it can provide online businesses with information that
can assist them in building marketing strategies that fit the business. It might also be interesting to
conduct further research on other independent variables, i.e. speed of delivery, online transaction
service, types of product, attitude towards the online purchase, intention to purchase, IT
knowledge, consumer preference etc. in addition to the present independent variables,
i.e. convenience, price, trust, and social media, with online shopping behaviour. Researchers
could explore different aspects of online purchase behaviour through a mixed-method study or a
purely qualitative study, to get a deeper understanding of how and why consumers behave a certain
way.
References
Ahmed, Z., Ghingold, M., & Dahari, Z. (2007). Malaysian Shopping Mall Behavior: An
Exploratory Study. Research Gate. Retrieved 20 September 2020, from
https://www.researchgate.net/publication/235296810_Malaysian_shopping_mall_behavio
r_An_exploratory_study.
Andreti, J., Zhafira, N., Akmal, S., & Kumar, S. (2013). The Analysis of Product, Price, Place,
Promotion and Service Quality on Customers' Buying Decision of Convenience Store: A
Survey of Young Adult in Bekasi, West Java, Indonesia. Research Gate. Retrieved 27
September 2020, from
https://www.researchgate.net/publication/323308768_The_Analysis_of_Product_Price_P
lace_Promotion_and_Service_Quality_on_Customers'_Buying_Decision_of_Convenienc
e_Store_A_Survey_of_Young_Adult_in_Bekasi_West_Java_Indonesia.
Athapaththu, J., & Kulathunga, D. (2018). Factors Affecting Online Purchase Intention: Effects of
Technology and Social Commerce. The Canadian Center of Science and Education.
22
Retrieved 27 September 2020, from
http://www.ccsenet.org/journal/index.php/ibr/article/view/0/36933.
Azami, S. (2019). Factors Affecting Customers’ Purchasing Behavior in Online Shopping. Social
Science Research Network. Retrieved 27 September 2020, from
https://papers.ssrn.com/sol3/papers.cfm?abstract_id=3377148.
Babar, A., Rasheed, A., & Sajjad, M. (2014). Factors Influencing Online Shopping Behavior of
Consumers. TextRoad. Retrieved 27 September 2020, from
https://www.textroad.com/pdf/JBASR/J.%20Basic.%20Appl.%20Sci.%20Res.,%204(4)3
14-320,%202014.pdf.
Bashir, et al. (2018) Online Shopping Behaviour Among University Students: Case Study of Must
University. Advances in Social Sciences Research Journal, vol. 5, no. 4, pp. 228-242.
[Online]. Available at: https://www.researchgate.net/publication/327175534 [Accessed
27/09/20]
Bucko, J., Kakalejcik, L., & Ferencova, M. (2018). Online Shopping: Factors That Affect
Consumer Purchasing Behavior. Research Gate. Retrieved 20 September 2020, from
https://www.researchgate.net/publication/328319370_Online_shopping_Factors_that_aff
ect_consumer_purchasing_behavior.
Chew, J. (2018). The History of eCommerce in Malaysia. CustomerThink. Retrieved 19 December
2020, from https://customerthink.com/the-history-of-ecommerce-in-malaysia/.
Clark, M. (2018). Infographic: Digital Shopping Habits of Men and Women. Stella Rising.
Retrieved 1 November 2020, from https://www.stellarising.com/blog/digital-shopping-
behaviors-men-women-mobile-shopping.
Constantinides, E. (2014). Foundations of Social Media Marketing. ScienceDirect. Retrieved 27
September 2020, from
https://www.sciencedirect.com/science/article/pii/S1877042814039202.
Dachyar, M., & Banjarnahor, L. (2017). Factors Influencing Purchase Intention Towards
Consumer-To-Consumer eCommerce. Research Gate. Retrieved 27 September 2020, from
https://www.researchgate.net/publication/321830911_Factors_influencing_purchase_inte
ntion_towards_consumer-to-consumer_e-commerce.
Deloitte Digital. (2014). Navigating the New Digital Divide: Capitalizing on Digital Influence in
Retail. Retrieved 27 September 2020, from
https://www2.deloitte.com/content/dam/Deloitte/us/Documents/consumer-business/us-
cb-navigating-the-new-digital-divide-051315.pdf.
Dube, F., Asiedu, R., & Phiri, A. (2018). Factor Affecting Online Shopping Behaviour of
International College Students in China. Research Gate. Retrieved 29 September 2020,
from
https://www.researchgate.net/publication/329841120_FACTORS_AFFECTING_ONLIN
E_SHOPPING_BEHAVIOR_OF_INTERNATIONAL_COLLEGE_STUDENTS_IN_C
HINA.
Edosomwan, S., Prakasan, S., Kouame, D., Watson, J., & Seymour, T. (2011). The History of
Social Media and its Impact on Business. Research Gate. Retrieved 4 October 2020, from
https://www.researchgate.net/publication/303216233_The_history_of_social_media_and
_its_impact_on_business.
Elisabeta, I. (2014). Social Media and its Impact on Consumers Behavior. Research Gate.
Retrieved 29 September 2020, from
23
https://www.researchgate.net/publication/313421625_Social_Media_and_its_Impact_on_
Consumers_Behavior.
Garvin, R. (2019). How Social Networks Influence 74% of Shoppers for Their Purchasing
Decisions Today. Awario. Retrieved 29 September 2020, from
https://awario.com/blog/how-social-networks-influence-74-of-shoppers-for-their-
purchasing-decisions-today/.
Gozukara, E., Ozyer, Y., & Koçoğlu, İ. (2014). The Moderating Effects of Perceived Use and
Perceived Risk in Online Shopping. Research Gate. Retrieved 27 September 2020, from
https://www.researchgate.net/publication/292344731_THE_MODERATING_EFFECTS
_OF_PERCEIVED_USE_AND_PERCEIVED_RISK_IN_ONLINE_SHOPPING.
Gupta, A., Bansal, R., & Bansal, A. (2013). Online Shopping: A Shining Future. Research Gate.
Retrieved 27 September 2020, from
https://www.researchgate.net/publication/318224640_Online_Shopping_A_Shining_Futu
re.
Hair, J. F., Hult, G. T. M., Ringle, C., & Sarstedt, M. (2017b). A Primer on Partial Least Squares
Structural Equation Modeling (PLS-SEM) (2nd ed.). London: Thousand Oaks: SAGE.
Hsu, C. (2008). Dominant Factors for Online Trust. Griffith Research Online. Retrieved 2 October
2020, from https://research-
repository.griffith.edu.au/bitstream/handle/10072/26828/57758_1.pdf;jsessionid=5AD42
FFF325725F29700DFE3D0F66B11?sequence=1
Isa, K., Shah, J., Palpanadan, S., & Isa, F. (2020). Malaysians’ Popular Online Shopping Websites
during Movement Control Order (MCO). Universiti Malaysia Sabah. Retrieved 27
September 2020, from
http://eprints.ums.edu.my/25690/1/Malaysians%E2%80%99%20popular%20online%20s
hopping%20websites%20during%20movement%20control%20order%20%28Mco%29.p
df.
Isa, N., Annuar, S., Gisip, I., & Lajuni, N. (2020). Factors Influencing Online Purchase Intention
of Millennials and Gen Z Consumers. Research Gate. Retrieved 27 September 2020, from
Jothi, C., & Gaffoor, M. (2017). Impact of Social Media in Online Shopping. ICTACT Journals.
Retrieved 29 September 2020, from
http://ictactjournals.in/paper/IJMS_Vol_3_Iss_3_Paper_6_576_586.pdf.
Katawetawaraks, C., & Wang, C. (2011). Online Shopper Behavior: Influences of Online Shopping
Decision. Southwestern State University. Retrieved 24 September 2020, from
https://swsu.ru/sbornik-statey/pdf/Online%20Shopper%20Behavior%20Influences.pdf.
Kushwah, S., & Singh, A. (2019). From Traditional Shopping to Online Shopping: A Study of the
Paradigm Shift in Consumer Behaviour. Research Gate. Retrieved 27 September 2020,
from
https://www.researchgate.net/publication/335740745_From_Traditional_Shopping_to_O
nline_Shopping_A_Study_of_the_Paradigm_Shift_in_Consumer_Behaviour_Journal_of
_General_ManaGeMent_research.
Kusumawati, R., Oswari, T., Utomo, R., & Kumar, V. (2014). The Influence of 7P’s of Marketing
Mix on Buying Intention of Music Product in Indonesia. Research Gate. Retrieved 27
September 2020, from
https://www.researchgate.net/publication/275540895_The_Influence_of_7P%27s_of_Ma
rketing_Mix_on_Buying_Intention_of_Music_Product_in_Indonesia.
24
Kwek, C., Tan, H., & Lau, T. (2010). Investigating the Shopping Orientations on Online Purchase
Intention in the e-Commerce Environment: A Malaysian Study. Research Gate. Retrieved
20 September 2020, from
https://www.researchgate.net/publication/288582068_Investigating_the_Shopping_Orien
tations_on_Online_Purchase_Intention_in_the_e-
Commerce_Environment_A_Malaysian_Study.
Li, J., Hallsworth, A. G., & Coca‐Stefaniak, J. A. (2020). Changing grocery shopping behaviours
among Chinese consumers at the outset of the COVID‐19 outbreak. Tijdschrift voor
economische en sociale geografie, 111(3), 574-583. https://doi.org/10.1111/tesg.12420.
Lo, S., Hsieh, A., & Chiu, Y. (2014). Why Expect Lower Prices Online? Empirical Examination
in Online And Store-Based Retailers. Research Gate. Retrieved 27 September 2020, from
https://www.researchgate.net/publication/269851216_WHY_EXPECT_LOWER_PRICE
S_ONLINE_EMPIRICAL_EXAMINATION_IN_ONLINE_AND_STORE-
BASED_RETAILERS.
Luigi, D., Gheorghe, O., & Mircea, F. (2015). Understanding the Online Consumer Behaviour and
The Usage of The Internet As A Business Environment - A Marketing Research. Research
Gate. Retrieved 2 October 2020, from
https://www.researchgate.net/publication/280087612_Understanding_The_Online_Consu
mer_Behaviour_And_The_Usage_Of_The_Internet_As_A_Business_Environment_-
_A_Marketing_Research.
McLeod, S. (2018). Questionnaire: Definition, Examples, Design and Types. Simply Psychology.
Retrieved 4 October 2020, from https://www.simplypsychology.org/questionnaires.html.
Mehta, S., Bansal, S., & Bagga, T. (2017). Social Media and Online Shopping - Are the Choices
Swayed? A Youth Perspective. Research Gate. Retrieved 27 September 2020, from
https://www.researchgate.net/publication/316598308_Social_Media_and_online_shoppin
g-are_the_choices_swayed_A_youth_perspective.
Ministry of Health. (2020). Retrieved 27 September 2020, from https://www.moh.gov.my/.
Monsuwe, T., Dellaert, B., & Ruyter, K. (2004). What Drives Consumers to Shop Online? A
Literature Review. Penn State's College of Information Sciences and Technology.
Retrieved 27 September 2020, from
http://citeseerx.ist.psu.edu/viewdoc/download;jsessionid=7BB7C0FF791F210A366667D
FACB919A8?doi=10.1.1.452.3260&rep=rep1&type=pdf.
Munthiu, M. (2009). The Buying Decision Process & Types of Buying Decision Behaviour. Sibiu
Alma Mater University Journals. Series A. Economic Sciences. Retrieved 27 September
2020, from https://d1wqtxts1xzle7.cloudfront.net/62024899/Dm20200207-80677-
rejoul.pdf?1581076738=&response-content-
disposition=inline%3B+filename%3DThe_buying_decision_process_and_types_of.pdf&
Expires=1608433186&Signature=H2JXOg1y~AB0nTQf~UM59sNsfyBg-
7dep6k3eMzM9FiVjhv7bt1rJ4FAUyRDLoum0wJ4iHq2HvRI~n-
jxOZ4Bm8FKnC8eJVTY8CrrlgL0RQ5ddkGf3ykIS0WjgUvf2oEDGn~CfUw20TIeu76Q
rLM05fB-H2wS-0OKR7j~-
b2rLQTtToDHQNjQoyMpvz6vxF4UMiNpZGLRSLHZD2Jj-G4FgYF9ewWY~0Oz6-
Lv-VkpjZoAMygpC52nDEEG2d8xDD-T0ZLOJoVWXG5R-
kGXjUONRG80RgNZY4C~R8JKlmtBGAW3rQTigf4yAizs7Se3SreD0iQ2N8YS6Y0Dl
JozxzC-g__&Key-Pair-Id=APKAJLOHF5GGSLRBV4ZA.
25
Munusamy, J., & Hoo, W. (2008). Relationship Between Marketing Mix Strategy and Consumer
Motive: An Empirical Study in Major Tesco Stores. Penn State's College of Information
Sciences and Technology. Retrieved 27 September 2020, from
https://citeseerx.ist.psu.edu/viewdoc/download?doi=10.1.1.519.506&rep=rep1&type=pdf
.
Natarajan, T., Balasubramanian, S., & Kasilingam, D. (2017). Understanding the Intention to Use
Mobile Shopping Applications and Its Influence on Price Sensitivity. Science Direct.
Retrieved 27 September 2020, from
https://www.sciencedirect.com/science/article/pii/S0969698916303216.
Neter, J., Wasserman, W., & Kutner, M. (1983). Applied Linear Regression Models. Instituto de
Matemática, Estatística e Computação Científica Unicamp. Retrieved 1 November 2020,
from
https://www.ime.unicamp.br/~dias/John%20Neter%20Applied%20linear%20regression
%20models.pdf.
Noor, S., Isa, F. M., & Mazhar, F. F. (2020). Online teaching practices during the COVID-19
pandemic. Educational Process: International Journal, 9(3), 169-
184. https://doi.org/10.22521/edupij.2020.93.4
Olasanmi, O. (2019). Online Shopping and Customers' Satisfaction in Lagos State, Nigeria.
Research Gate. Retrieved 27 September 2020, from
https://www.researchgate.net/publication/337155805_Online_Shopping_and_Customers
%27_Satisfaction_in_Lagos_State_Nigeria.
Pham, Q., Tran, X., Misra, S., Maskeliunas, R., & Damasevicius, R. (2018). Relationship between
Convenience, Perceived Value, and Repurchase Intention in Online Shopping in Vietnam.
Research Gate. Retrieved 27 September 2020, from
https://www.researchgate.net/publication/322372216_Relationship_between_Convenienc
e_Perceived_Value_and_Repurchase_Intention_in_Online_Shopping_in_Vietnam.
Pillemer, K., & Finkelhor, D. (1988). The prevalence of elder abuse: A random sample survey.
The Gerontologist, 28(1), 51-57. https://doi.org/10.1093/geront/28.1.51
Povera, A., Harun, H., & Arumugam, T. (2020). PM: Malaysia Has Suffered RM63 Billion Losses
Due to MCO. New Straits Times. Retrieved 20 September 2020, from
https://www.nst.com.my/news/nation/2020/05/588982/pm-malaysia-has-suffered-rm63-
billion-losses-due-mco.
Punj, G. (2011). Effect of Consumer Beliefs on Online Purchase Behavior: The Influence of
Demographic Characteristics and Consumption Values. Science Direct. Retrieved 27
September 2020, from https://marketing.business.uconn.edu/wp-
content/uploads/sites/724/2014/08/effect-of-consumer-beliefs-on-online.pdf
Sangurde, R. (2019). Impact of Social Media on Buying Behaviour of Consumer with Special
Reference to Mumbai Youth. Research Gate. Retrieved 4 October 2020, from
https://www.researchgate.net/publication/330618244_impact_of_social_media_on_buyin
g_behaviour_of_consumer.
Satit, R., Tat, H., Rasli, A., Chin, T., & Sukati, I. (2012). The Relationship Between Marketing
Mix and Customer Decision-Making Over Travel Agents: An Empirical Study. Research
Gate. Retrieved 27 September 2020, from
https://www.researchgate.net/publication/265251058_The_Relationship_Between_Marke
26
ting_Mix_And_Customer_Decision-
Making_Over_Travel_Agents_An_Empirical_Study.
Scheinbaum, A., & Kukar-Kinney, M. (2009). Beyond Buying: Motivations Behind Consumers’
Online Shopping Cart Use. Research Gate. Retrieved 29 September 2020, from
https://www.researchgate.net/publication/222416716_Beyond_buying_motivations_behi
nd_Consumers%27_online_shopping_cart_Use.
Statista. (2020). Most Used Social Media in 2020. Retrieved 27 September 2020, from
https://www.statista.com/statistics/272014/global-social-networks-ranked-by-number-of-
users/
Suleman, D., Zuniarti, I., Sabil, Setyaningsih, E., Yanti, V., & Susilowati, I. et al. (2019). Decision
Model Based on Technology Acceptance Model (Tam) for Online Shop Consumers in
Indonesia. Allied Business Academies. Retrieved 30 September 2020, from
https://www.abacademies.org/articles/decision-model-based-on-technology-acceptance-
model-tam-for-online-shop-consumers-in-indonesia-8624.html.
Sundström, M. (2008). The Online Retail Customer and Convenient Shopping. Research Gate.
Retrieved 30 September 2020, from
https://www.researchgate.net/publication/228890681_The_Online_Retail_Customer_and
_Convenient_Shopping.
Sunitha, C., & Gnanadhas, M. (2014). Online Shopping - An Overview. Research Gate. Retrieved
2 October 2020, from
https://www.researchgate.net/publication/264556861_Online_Shopping_-
_An_Overview.
Takaya, R. (2016). Antecedents Analysis of Purchase Intention. Research Gate. Retrieved 27
September 2020, from
https://www.researchgate.net/publication/335848748_Antecedents_Analysis_of_Purchas
e_Intention.
The Star. (2004). eBay Malaysia Launched. Retrieved 2 October 2020, from
https://www.thestar.com.my/business/business-news/2004/12/03/ebay-malaysia-
launched.
Voramontri, D., & Klieb, L. (2018). Impact of Social Media on Consumer Behaviour. Research
Gate. Retrieved 30 September 2020, from
https://www.researchgate.net/publication/326098250_Impact_of_Social_Media_on_Cons
umer_Behaviour.
World Health Organisation. (2020). Coronavirus Disease (COVID-19) Pandemic. Retrieved 20
September 2020, from https://www.who.int/emergencies/diseases/novel-coronavirus-
2019.
Xhema, J. (2019). Effect of Social Networks on Consumer Behaviour: Complex Buying. Science
Direct. Retrieved 29 September 2020, from
https://www.sciencedirect.com/science/article/pii/S2405896319325157.
Yeoh, O. (2020). Future Proof: Adapt in a Post-MCO World. New Straits Times. Retrieved 27
September 2020, from https://www.nst.com.my/lifestyle/sunday-
vibes/2020/06/597251/future-proof-adapting-post-mco-world.
Yun, Z. (2011). Testing A Theoretical Model to Examine the Relationships Among E-Social
Shopping Motivation, Perception, And Behavioral Intention. Michigan State University.
Retrieved 30 September 2020, from
https://d.lib.msu.edu/etd/731/datastream/OBJ/download/Testing_a_theoretical_model_to
27
_examine_the_relationships_among_e-
social_shopping_motivation__perception__and_behavioral_intention.pdf.
Zendehdel, M., Paim, L., Bojei, J., & Osman, S. (2011). The Effects of Trust on Online Malaysian
Students Buying Behavior. Research Gate. Retrieved 27 September 2020, from
https://www.researchgate.net/publication/280311968_The_Effects_of_Trust_on_Online_
Malaysian_Students_Buying_Behavior.
Annex-A
VARIABLE ITEM QUESTION
CONVENIENCE C1
C2
C3
C4
C5
C6
C7
C8
Shopping online helps me to save time.
Shopping online helps me to save money.
Shopping online helps me to save the effort of visiting physical stores.
Shopping online helps me to avoid crowds.
I can shop online whenever I want to.
Online shopping has the advantage of a wide selection of products.
I always find the products/services I want online.
I can make discreet purchases.
PRICE P1
P2
P3
P4
P5
P6
P7
P8
I always compare prices between online and in-store, before I decide to purchase
the
I compare prices to take advantage of special offers when I shop online.
I visited different online stores to take advantage of the best prices.
I often shop online to get points for discounts.
I take advantage of free shipping.
I do not mind paying extra for express shipping.
I pay extra for the brand.
I pay extra for the quality.
TRUST T1
T2
T3
T4
T5
T6
T7*
T8
Products shown on online shopping websites are reliable.
Online shopping websites are authentic in their claims.
Online shopping websites are dependable in their claims.
Online websites offer secure personal privacy.
I often get the product that matches the description from the online seller’s
website.
I have difficulty verifying product quality when shopping online.
I often receive malfunctioning products when shopping online.
Online sellers respond on time when I contact them through email / online chat.
SOCIAL MEDIA SM1
SM2
SM3
SM4
SM5
SM6
SM7
SM8
I often buy products/services I see on social media.
I look for product/service reviews on social media.
I find products and services reviews on social media are reliable.
I often take advantage of the special deals advertised on social media.
I often purchase products/services recommended by social media influencers.
I use social media to keep up with the latest updates of online stores such as new
products,
Events, promotions, etc.
I use social media to communicate with online sellers.
I find information on social media is sufficient to make a purchase.
*Indicates that the items are coded in reverse

More Related Content

Similar to Factors affecting online shopping UG paper -Filzah (1).pdf

Dissertation report “Consumer Behavior towards online shopping of Smart Phone...
Dissertation report “Consumer Behavior towards online shopping of Smart Phone...Dissertation report “Consumer Behavior towards online shopping of Smart Phone...
Dissertation report “Consumer Behavior towards online shopping of Smart Phone...hasnain2
 
Article 8 A STUDY ON THE CONSUMER PERCEPTION TOWARDS ONLINE SHOPPING IN THE D...
Article 8 A STUDY ON THE CONSUMER PERCEPTION TOWARDS ONLINE SHOPPING IN THE D...Article 8 A STUDY ON THE CONSUMER PERCEPTION TOWARDS ONLINE SHOPPING IN THE D...
Article 8 A STUDY ON THE CONSUMER PERCEPTION TOWARDS ONLINE SHOPPING IN THE D...Dr UMA K
 
article 8 Wesleyan Journal of Research - A STUDY ON THE.pdf
article 8  Wesleyan Journal of Research - A STUDY ON THE.pdfarticle 8  Wesleyan Journal of Research - A STUDY ON THE.pdf
article 8 Wesleyan Journal of Research - A STUDY ON THE.pdfEducational
 
Do Social Media Impact Consumer Buying Decisions in the Fashion Industry duri...
Do Social Media Impact Consumer Buying Decisions in the Fashion Industry duri...Do Social Media Impact Consumer Buying Decisions in the Fashion Industry duri...
Do Social Media Impact Consumer Buying Decisions in the Fashion Industry duri...Dr. Amarjeet Singh
 
Consumer Trends post COVID-19
Consumer Trends post COVID-19Consumer Trends post COVID-19
Consumer Trends post COVID-19Christine Ege
 
Equinox Emerging Trends report - mar 2013
Equinox Emerging Trends report - mar 2013Equinox Emerging Trends report - mar 2013
Equinox Emerging Trends report - mar 2013Tuan Le
 
IMS Research Paper
IMS Research PaperIMS Research Paper
IMS Research PaperAngela Chang
 
Consumer engagement principles
Consumer engagement principlesConsumer engagement principles
Consumer engagement principlesdefault default
 
B410815
B410815B410815
B410815aijbm
 
article_23_11_2_875-886.pdf
article_23_11_2_875-886.pdfarticle_23_11_2_875-886.pdf
article_23_11_2_875-886.pdffetene worku
 
DEMOGRAPHIC ANALYSIS OF CUSTOMER PREFERENCE IN USING ONLINE FOOD APPLICATIONS
DEMOGRAPHIC ANALYSIS OF CUSTOMER PREFERENCE IN USING ONLINE FOOD APPLICATIONSDEMOGRAPHIC ANALYSIS OF CUSTOMER PREFERENCE IN USING ONLINE FOOD APPLICATIONS
DEMOGRAPHIC ANALYSIS OF CUSTOMER PREFERENCE IN USING ONLINE FOOD APPLICATIONSResearch Publish Journals (Publisher)
 
The Influence of Sales Promotion and Brand Image toward the Purchasing Decisi...
The Influence of Sales Promotion and Brand Image toward the Purchasing Decisi...The Influence of Sales Promotion and Brand Image toward the Purchasing Decisi...
The Influence of Sales Promotion and Brand Image toward the Purchasing Decisi...YogeshIJTSRD
 
Claudia 2020 COVID19 Banking Intention.pdf
Claudia 2020 COVID19 Banking Intention.pdfClaudia 2020 COVID19 Banking Intention.pdf
Claudia 2020 COVID19 Banking Intention.pdfSaqib Ali
 
consumer perception towards online marketing in india
 consumer perception towards online marketing in india consumer perception towards online marketing in india
consumer perception towards online marketing in indiaINFOGAIN PUBLICATION
 
G575157.pdf
G575157.pdfG575157.pdf
G575157.pdfaijbm
 
A STUDY ON LITERATURE REVIEW FOR IDENTIFYING THE FACTORS IMPACTING DIGITAL MA...
A STUDY ON LITERATURE REVIEW FOR IDENTIFYING THE FACTORS IMPACTING DIGITAL MA...A STUDY ON LITERATURE REVIEW FOR IDENTIFYING THE FACTORS IMPACTING DIGITAL MA...
A STUDY ON LITERATURE REVIEW FOR IDENTIFYING THE FACTORS IMPACTING DIGITAL MA...Claire Webber
 

Similar to Factors affecting online shopping UG paper -Filzah (1).pdf (20)

Dissertation report “Consumer Behavior towards online shopping of Smart Phone...
Dissertation report “Consumer Behavior towards online shopping of Smart Phone...Dissertation report “Consumer Behavior towards online shopping of Smart Phone...
Dissertation report “Consumer Behavior towards online shopping of Smart Phone...
 
Article 8 A STUDY ON THE CONSUMER PERCEPTION TOWARDS ONLINE SHOPPING IN THE D...
Article 8 A STUDY ON THE CONSUMER PERCEPTION TOWARDS ONLINE SHOPPING IN THE D...Article 8 A STUDY ON THE CONSUMER PERCEPTION TOWARDS ONLINE SHOPPING IN THE D...
Article 8 A STUDY ON THE CONSUMER PERCEPTION TOWARDS ONLINE SHOPPING IN THE D...
 
article 8 Wesleyan Journal of Research - A STUDY ON THE.pdf
article 8  Wesleyan Journal of Research - A STUDY ON THE.pdfarticle 8  Wesleyan Journal of Research - A STUDY ON THE.pdf
article 8 Wesleyan Journal of Research - A STUDY ON THE.pdf
 
Do Social Media Impact Consumer Buying Decisions in the Fashion Industry duri...
Do Social Media Impact Consumer Buying Decisions in the Fashion Industry duri...Do Social Media Impact Consumer Buying Decisions in the Fashion Industry duri...
Do Social Media Impact Consumer Buying Decisions in the Fashion Industry duri...
 
Consumer Trends post COVID-19
Consumer Trends post COVID-19Consumer Trends post COVID-19
Consumer Trends post COVID-19
 
Exploring the Key Factors Influencing Consumers’ Intention, Satisfaction and ...
Exploring the Key Factors Influencing Consumers’ Intention, Satisfaction and ...Exploring the Key Factors Influencing Consumers’ Intention, Satisfaction and ...
Exploring the Key Factors Influencing Consumers’ Intention, Satisfaction and ...
 
Equinox Emerging Trends report - mar 2013
Equinox Emerging Trends report - mar 2013Equinox Emerging Trends report - mar 2013
Equinox Emerging Trends report - mar 2013
 
Effect of Corona Virus on the Shopping Criteria of Lebanese Consumers
Effect of Corona Virus on the Shopping Criteria of Lebanese ConsumersEffect of Corona Virus on the Shopping Criteria of Lebanese Consumers
Effect of Corona Virus on the Shopping Criteria of Lebanese Consumers
 
IMS Research Paper
IMS Research PaperIMS Research Paper
IMS Research Paper
 
A dissertation report
A dissertation reportA dissertation report
A dissertation report
 
Consumer engagement principles
Consumer engagement principlesConsumer engagement principles
Consumer engagement principles
 
B410815
B410815B410815
B410815
 
Ijmet 10 01_086
Ijmet 10 01_086Ijmet 10 01_086
Ijmet 10 01_086
 
article_23_11_2_875-886.pdf
article_23_11_2_875-886.pdfarticle_23_11_2_875-886.pdf
article_23_11_2_875-886.pdf
 
DEMOGRAPHIC ANALYSIS OF CUSTOMER PREFERENCE IN USING ONLINE FOOD APPLICATIONS
DEMOGRAPHIC ANALYSIS OF CUSTOMER PREFERENCE IN USING ONLINE FOOD APPLICATIONSDEMOGRAPHIC ANALYSIS OF CUSTOMER PREFERENCE IN USING ONLINE FOOD APPLICATIONS
DEMOGRAPHIC ANALYSIS OF CUSTOMER PREFERENCE IN USING ONLINE FOOD APPLICATIONS
 
The Influence of Sales Promotion and Brand Image toward the Purchasing Decisi...
The Influence of Sales Promotion and Brand Image toward the Purchasing Decisi...The Influence of Sales Promotion and Brand Image toward the Purchasing Decisi...
The Influence of Sales Promotion and Brand Image toward the Purchasing Decisi...
 
Claudia 2020 COVID19 Banking Intention.pdf
Claudia 2020 COVID19 Banking Intention.pdfClaudia 2020 COVID19 Banking Intention.pdf
Claudia 2020 COVID19 Banking Intention.pdf
 
consumer perception towards online marketing in india
 consumer perception towards online marketing in india consumer perception towards online marketing in india
consumer perception towards online marketing in india
 
G575157.pdf
G575157.pdfG575157.pdf
G575157.pdf
 
A STUDY ON LITERATURE REVIEW FOR IDENTIFYING THE FACTORS IMPACTING DIGITAL MA...
A STUDY ON LITERATURE REVIEW FOR IDENTIFYING THE FACTORS IMPACTING DIGITAL MA...A STUDY ON LITERATURE REVIEW FOR IDENTIFYING THE FACTORS IMPACTING DIGITAL MA...
A STUDY ON LITERATURE REVIEW FOR IDENTIFYING THE FACTORS IMPACTING DIGITAL MA...
 

Recently uploaded

2024 Numerator Consumer Study of Cannabis Usage
2024 Numerator Consumer Study of Cannabis Usage2024 Numerator Consumer Study of Cannabis Usage
2024 Numerator Consumer Study of Cannabis UsageNeil Kimberley
 
Call Girls In Sikandarpur Gurgaon ❤️8860477959_Russian 100% Genuine Escorts I...
Call Girls In Sikandarpur Gurgaon ❤️8860477959_Russian 100% Genuine Escorts I...Call Girls In Sikandarpur Gurgaon ❤️8860477959_Russian 100% Genuine Escorts I...
Call Girls In Sikandarpur Gurgaon ❤️8860477959_Russian 100% Genuine Escorts I...lizamodels9
 
BEST Call Girls In Greater Noida ✨ 9773824855 ✨ Escorts Service In Delhi Ncr,
BEST Call Girls In Greater Noida ✨ 9773824855 ✨ Escorts Service In Delhi Ncr,BEST Call Girls In Greater Noida ✨ 9773824855 ✨ Escorts Service In Delhi Ncr,
BEST Call Girls In Greater Noida ✨ 9773824855 ✨ Escorts Service In Delhi Ncr,noida100girls
 
VIP Kolkata Call Girl Howrah 👉 8250192130 Available With Room
VIP Kolkata Call Girl Howrah 👉 8250192130  Available With RoomVIP Kolkata Call Girl Howrah 👉 8250192130  Available With Room
VIP Kolkata Call Girl Howrah 👉 8250192130 Available With Roomdivyansh0kumar0
 
RE Capital's Visionary Leadership under Newman Leech
RE Capital's Visionary Leadership under Newman LeechRE Capital's Visionary Leadership under Newman Leech
RE Capital's Visionary Leadership under Newman LeechNewman George Leech
 
GD Birla and his contribution in management
GD Birla and his contribution in managementGD Birla and his contribution in management
GD Birla and his contribution in managementchhavia330
 
BEST Call Girls In Old Faridabad ✨ 9773824855 ✨ Escorts Service In Delhi Ncr,
BEST Call Girls In Old Faridabad ✨ 9773824855 ✨ Escorts Service In Delhi Ncr,BEST Call Girls In Old Faridabad ✨ 9773824855 ✨ Escorts Service In Delhi Ncr,
BEST Call Girls In Old Faridabad ✨ 9773824855 ✨ Escorts Service In Delhi Ncr,noida100girls
 
Sales & Marketing Alignment: How to Synergize for Success
Sales & Marketing Alignment: How to Synergize for SuccessSales & Marketing Alignment: How to Synergize for Success
Sales & Marketing Alignment: How to Synergize for SuccessAggregage
 
Call Girls In Radisson Blu Hotel New Delhi Paschim Vihar ❤️8860477959 Escorts...
Call Girls In Radisson Blu Hotel New Delhi Paschim Vihar ❤️8860477959 Escorts...Call Girls In Radisson Blu Hotel New Delhi Paschim Vihar ❤️8860477959 Escorts...
Call Girls In Radisson Blu Hotel New Delhi Paschim Vihar ❤️8860477959 Escorts...lizamodels9
 
Marketing Management Business Plan_My Sweet Creations
Marketing Management Business Plan_My Sweet CreationsMarketing Management Business Plan_My Sweet Creations
Marketing Management Business Plan_My Sweet Creationsnakalysalcedo61
 
Lowrate Call Girls In Sector 18 Noida ❤️8860477959 Escorts 100% Genuine Servi...
Lowrate Call Girls In Sector 18 Noida ❤️8860477959 Escorts 100% Genuine Servi...Lowrate Call Girls In Sector 18 Noida ❤️8860477959 Escorts 100% Genuine Servi...
Lowrate Call Girls In Sector 18 Noida ❤️8860477959 Escorts 100% Genuine Servi...lizamodels9
 
VIP Call Girls Pune Kirti 8617697112 Independent Escort Service Pune
VIP Call Girls Pune Kirti 8617697112 Independent Escort Service PuneVIP Call Girls Pune Kirti 8617697112 Independent Escort Service Pune
VIP Call Girls Pune Kirti 8617697112 Independent Escort Service PuneCall girls in Ahmedabad High profile
 
Regression analysis: Simple Linear Regression Multiple Linear Regression
Regression analysis:  Simple Linear Regression Multiple Linear RegressionRegression analysis:  Simple Linear Regression Multiple Linear Regression
Regression analysis: Simple Linear Regression Multiple Linear RegressionRavindra Nath Shukla
 
Lean: From Theory to Practice — One City’s (and Library’s) Lean Story… Abridged
Lean: From Theory to Practice — One City’s (and Library’s) Lean Story… AbridgedLean: From Theory to Practice — One City’s (and Library’s) Lean Story… Abridged
Lean: From Theory to Practice — One City’s (and Library’s) Lean Story… AbridgedKaiNexus
 
/:Call Girls In Jaypee Siddharth - 5 Star Hotel New Delhi ➥9990211544 Top Esc...
/:Call Girls In Jaypee Siddharth - 5 Star Hotel New Delhi ➥9990211544 Top Esc.../:Call Girls In Jaypee Siddharth - 5 Star Hotel New Delhi ➥9990211544 Top Esc...
/:Call Girls In Jaypee Siddharth - 5 Star Hotel New Delhi ➥9990211544 Top Esc...lizamodels9
 
Call Girls Navi Mumbai Just Call 9907093804 Top Class Call Girl Service Avail...
Call Girls Navi Mumbai Just Call 9907093804 Top Class Call Girl Service Avail...Call Girls Navi Mumbai Just Call 9907093804 Top Class Call Girl Service Avail...
Call Girls Navi Mumbai Just Call 9907093804 Top Class Call Girl Service Avail...Dipal Arora
 
rishikeshgirls.in- Rishikesh call girl.pdf
rishikeshgirls.in- Rishikesh call girl.pdfrishikeshgirls.in- Rishikesh call girl.pdf
rishikeshgirls.in- Rishikesh call girl.pdfmuskan1121w
 
Intro to BCG's Carbon Emissions Benchmark_vF.pdf
Intro to BCG's Carbon Emissions Benchmark_vF.pdfIntro to BCG's Carbon Emissions Benchmark_vF.pdf
Intro to BCG's Carbon Emissions Benchmark_vF.pdfpollardmorgan
 
Eni 2024 1Q Results - 24.04.24 business.
Eni 2024 1Q Results - 24.04.24 business.Eni 2024 1Q Results - 24.04.24 business.
Eni 2024 1Q Results - 24.04.24 business.Eni
 

Recently uploaded (20)

2024 Numerator Consumer Study of Cannabis Usage
2024 Numerator Consumer Study of Cannabis Usage2024 Numerator Consumer Study of Cannabis Usage
2024 Numerator Consumer Study of Cannabis Usage
 
Call Girls In Sikandarpur Gurgaon ❤️8860477959_Russian 100% Genuine Escorts I...
Call Girls In Sikandarpur Gurgaon ❤️8860477959_Russian 100% Genuine Escorts I...Call Girls In Sikandarpur Gurgaon ❤️8860477959_Russian 100% Genuine Escorts I...
Call Girls In Sikandarpur Gurgaon ❤️8860477959_Russian 100% Genuine Escorts I...
 
BEST Call Girls In Greater Noida ✨ 9773824855 ✨ Escorts Service In Delhi Ncr,
BEST Call Girls In Greater Noida ✨ 9773824855 ✨ Escorts Service In Delhi Ncr,BEST Call Girls In Greater Noida ✨ 9773824855 ✨ Escorts Service In Delhi Ncr,
BEST Call Girls In Greater Noida ✨ 9773824855 ✨ Escorts Service In Delhi Ncr,
 
VIP Kolkata Call Girl Howrah 👉 8250192130 Available With Room
VIP Kolkata Call Girl Howrah 👉 8250192130  Available With RoomVIP Kolkata Call Girl Howrah 👉 8250192130  Available With Room
VIP Kolkata Call Girl Howrah 👉 8250192130 Available With Room
 
RE Capital's Visionary Leadership under Newman Leech
RE Capital's Visionary Leadership under Newman LeechRE Capital's Visionary Leadership under Newman Leech
RE Capital's Visionary Leadership under Newman Leech
 
GD Birla and his contribution in management
GD Birla and his contribution in managementGD Birla and his contribution in management
GD Birla and his contribution in management
 
BEST Call Girls In Old Faridabad ✨ 9773824855 ✨ Escorts Service In Delhi Ncr,
BEST Call Girls In Old Faridabad ✨ 9773824855 ✨ Escorts Service In Delhi Ncr,BEST Call Girls In Old Faridabad ✨ 9773824855 ✨ Escorts Service In Delhi Ncr,
BEST Call Girls In Old Faridabad ✨ 9773824855 ✨ Escorts Service In Delhi Ncr,
 
Sales & Marketing Alignment: How to Synergize for Success
Sales & Marketing Alignment: How to Synergize for SuccessSales & Marketing Alignment: How to Synergize for Success
Sales & Marketing Alignment: How to Synergize for Success
 
Call Girls In Radisson Blu Hotel New Delhi Paschim Vihar ❤️8860477959 Escorts...
Call Girls In Radisson Blu Hotel New Delhi Paschim Vihar ❤️8860477959 Escorts...Call Girls In Radisson Blu Hotel New Delhi Paschim Vihar ❤️8860477959 Escorts...
Call Girls In Radisson Blu Hotel New Delhi Paschim Vihar ❤️8860477959 Escorts...
 
KestrelPro Flyer Japan IT Week 2024 (English)
KestrelPro Flyer Japan IT Week 2024 (English)KestrelPro Flyer Japan IT Week 2024 (English)
KestrelPro Flyer Japan IT Week 2024 (English)
 
Marketing Management Business Plan_My Sweet Creations
Marketing Management Business Plan_My Sweet CreationsMarketing Management Business Plan_My Sweet Creations
Marketing Management Business Plan_My Sweet Creations
 
Lowrate Call Girls In Sector 18 Noida ❤️8860477959 Escorts 100% Genuine Servi...
Lowrate Call Girls In Sector 18 Noida ❤️8860477959 Escorts 100% Genuine Servi...Lowrate Call Girls In Sector 18 Noida ❤️8860477959 Escorts 100% Genuine Servi...
Lowrate Call Girls In Sector 18 Noida ❤️8860477959 Escorts 100% Genuine Servi...
 
VIP Call Girls Pune Kirti 8617697112 Independent Escort Service Pune
VIP Call Girls Pune Kirti 8617697112 Independent Escort Service PuneVIP Call Girls Pune Kirti 8617697112 Independent Escort Service Pune
VIP Call Girls Pune Kirti 8617697112 Independent Escort Service Pune
 
Regression analysis: Simple Linear Regression Multiple Linear Regression
Regression analysis:  Simple Linear Regression Multiple Linear RegressionRegression analysis:  Simple Linear Regression Multiple Linear Regression
Regression analysis: Simple Linear Regression Multiple Linear Regression
 
Lean: From Theory to Practice — One City’s (and Library’s) Lean Story… Abridged
Lean: From Theory to Practice — One City’s (and Library’s) Lean Story… AbridgedLean: From Theory to Practice — One City’s (and Library’s) Lean Story… Abridged
Lean: From Theory to Practice — One City’s (and Library’s) Lean Story… Abridged
 
/:Call Girls In Jaypee Siddharth - 5 Star Hotel New Delhi ➥9990211544 Top Esc...
/:Call Girls In Jaypee Siddharth - 5 Star Hotel New Delhi ➥9990211544 Top Esc.../:Call Girls In Jaypee Siddharth - 5 Star Hotel New Delhi ➥9990211544 Top Esc...
/:Call Girls In Jaypee Siddharth - 5 Star Hotel New Delhi ➥9990211544 Top Esc...
 
Call Girls Navi Mumbai Just Call 9907093804 Top Class Call Girl Service Avail...
Call Girls Navi Mumbai Just Call 9907093804 Top Class Call Girl Service Avail...Call Girls Navi Mumbai Just Call 9907093804 Top Class Call Girl Service Avail...
Call Girls Navi Mumbai Just Call 9907093804 Top Class Call Girl Service Avail...
 
rishikeshgirls.in- Rishikesh call girl.pdf
rishikeshgirls.in- Rishikesh call girl.pdfrishikeshgirls.in- Rishikesh call girl.pdf
rishikeshgirls.in- Rishikesh call girl.pdf
 
Intro to BCG's Carbon Emissions Benchmark_vF.pdf
Intro to BCG's Carbon Emissions Benchmark_vF.pdfIntro to BCG's Carbon Emissions Benchmark_vF.pdf
Intro to BCG's Carbon Emissions Benchmark_vF.pdf
 
Eni 2024 1Q Results - 24.04.24 business.
Eni 2024 1Q Results - 24.04.24 business.Eni 2024 1Q Results - 24.04.24 business.
Eni 2024 1Q Results - 24.04.24 business.
 

Factors affecting online shopping UG paper -Filzah (1).pdf

  • 1. 1 Factors affecting online shopping behavior among consumers during COVID-19 pandemic: Case of Multiethnic Malaysia Abstract With the rapid development of technology, online shopping is growing more rapidly in Multiethnic Malaysia. However, since the spread of COVID-19 and the announcement of the Movement Control Order (MCO), it has created an impact on the consumers’ lifestyles and shopping activities as the limited movement made it difficult to access necessities. Thus, online shopping is becoming essential. The present study aims to examine the factors affecting online shopping behavior of consumers during the COVID-19 pandemic in Multiethnic Malaysia. This study intends to examine the relationship between Convenience, Price, Trust and Social Media and consumer buying behavior during COVID-19 Pandemic. A probability simple random sampling technique was utilized in distributing a survey-based questionnaire, and 107 responses were collected from a consumer residing in Malaysia. The collected data was analyzed using SPSS software through descriptive statistics, reliability test, correlation, and regression. The findings revealed no relationship between the independent variables; convenience, price, trust, and social media with the dependent variable; online shopping behavior. These negative findings implicate that all the independent factors are not among the determinants of consumers’ online shopping behavior as earlier studies showed. Hence, the findings of the study shed new knowledge on online shopping behavior during the COVID-19 pandemic outbreak since a consumers’ behavior today differs from their earlier behavior before the spread of COVID-19 all across the globe. The results from the research may be useful for online businesses and potential online businesses who plan to invest in e-commerce as it helps them to understand online consumer behavior and build a proper strategy, especially during a pandemic. The implications of the study are discussed in the paper. Keywords: e-commerce; COVID-19; pandemic; online shopping; consumer; behavior; convenience; price; trust; social media. Introduction In late 2019, there was a virus called coronavirus, which was also known as COVID-19, that was first detected at a wet market located in Wuhan, China. The virus has spread all over the world and declared a pandemic by the World Health Organisation. It is through touch or direct contact with a positive COVID-19 patient (WHO, 2020). However, in early September 2020, there have been more than 28.6 million confirmed COVID-19 cases from over 180 different countries and over 1.34 million deaths in November 2020. Whereas in Malaysia, 52638 cases, with 329 deaths and about 39088 that have recovered, and these numbers keep on increasing (MOH Nov, 2020). Due to the COVID-19 outbreak, a lot of activities have been disrupted such as teaching and learning, sports, business activities which include retail business, world trade, supply chain, and other kinds of activities (Noor Isa & Mazhar, 2020). To prevent the virus from spreading even further, the Malaysian government has taken control over the public’s movement, such as enforcing lockdown, movement restrictions, and social distancing. In addition, they implemented border control, restricting tourists to enter Malaysia except for essential and official business travel. As a result,
  • 2. 2 the public was forced to stay indoors to ensure their safety, and many businesses such as shopping malls, restaurants forced to close down, except for supermarkets (Yeoh, 2020).Furthermore, ever since the border control, Malaysia has been experiencing a lack of tourists coming into the country. This has led to many businesses to suffer, especially the small and medium enterprises, resulting in a weak economy and poor financial reports leading to major loss of RM63 billion (Isa et al, 2020; Povera et al., 2020). After the lockdown lifted, the public and businesses had to abide by the social distancing rule. This has resulted in lengthy queues and long waiting-time for consumers, which is inconvenient and less productive. Ahmed, Ghingold and Dahari (2007) stated Malaysia’s shopping is considered as one of many leisure activities as various consumers prefer to go to the mall, not only because of the products but also to socializing with friends. However, social distancing rule restricted the consumer longer stay in malls, and people spend time at home with family or working from home as schools also remain closed until January 2021. In COVID-19, businesses need to find a way to survive as well as meet the demand of consumers in the market by utilising the internet, mobile devices, computers, laptops, and other kinds of advanced technology and move towards electronic commerce (Sangurde,2019). Many businesses have turned to electronic commerce as a new way of doing business since consumers prefer to purchase online these days for convenience, safety and health reasons (Bucko et al., 2018; Hsu, 2008). In the current situation, the e-commerce market in Malaysia is now booming and expected to continue growing for the next five years. During the movement restriction period, there was a change in the consumer online shopping behaviour, which resulted in soaring online sales (Li et al., 2020; Azami, 2019). In the local perspective, business needs to have a better understanding of the marketplace for their products and services, as well as target consumers before they interact or engage with them online. Also, it is difficult to predict the online shopping behavior of consumers. Still, by maximizing advantage, online sellers can help to reduce the threats that can motivate consumers to shop online (Bashir et al., 2018; Gupta, Bansal & Bansal, 2013; Dachyar & Banjarnahor, 2017; Mehta, Bansal & Bagga, 2017; Athapaththu & Kulathunga, 2018; Azami, 2019; Olasanmi, 2019). However, online shopping behaviour can also be affected by many situational factors. One of the most significant situational factors these days is the COVID-19 pandemic. For the present study, four factors are selected i-e convenience, price, trust, and social media. The reason for choosing convenience is because it is one of the main factors that people switch to online shopping, especially during the MCO, consumers have no way to get to the products. Secondly, price is also another main factor as few consumers are willing to pay more for the sake of health and safety reasons during the pandemic specifically as to avoided panic buying, stocking up on the daily necessities. Thirdly, Trust is a common factor that researchers looked into for online shopping because consumers usually focus on their protection and the safety of their needs before making a purchase. Lastly, social media, as most of the businesses shifted towards online to reach out and engage with the consumers, is through social media marketing. More importantly, these factors could be different between online shopping before and during the COVID-19 pandemic or in MCO, since consumers who limit their movements outside these days may have several different factors which they never considered before (Yeoh, 2020). It is the main gap that the present study is trying to investigate.
  • 3. 3 Literature Review Underpinning Theories Technology Acceptance Model states that behavior is influenced by attitude, and attitude is influenced by ‘trust’. Trust is one of the main factors that influence consumers’ online purchases as it plays a key role in changing the attitude of consumers, such as from becoming online visitors to online buyers. While shopping online, consumers rely on the online seller’s promises, as they have no control over the certainty and their fulfilment of expectations. They also cannot see or inspect the purchased product, or meet with the online sellers. Some consumers avoid shopping online due to fraud and payment processes. It shows that online sellers need to build trust with online consumers as trust does not just happen; it needs to be built from scratch (Povera et al., 2020). Online sellers gain the customer trust by delivering products and services in time and help in building a positive attitude of consumers towards online stores that affect their shopping behavior (Suleman et al., 2019). Another commonly used independent variable is. convenience that motivates consumers to shop online as it helps to save time and reduce costs. It has a direct influence on consumers’ attitudes and shopping behavior. While shopping online, consumers can save time and can get the product via express delivery and free delivery. It enhances consumers’ intention to purchase the product or service and affect consumers’ satisfaction, which influence the behavior of repeat purchase (Sundstrom, 2008). Furthermore, Social Cognitive Theory claims that individuals learn from one another as consumers gather information from either communicating with other people or reading online. Due to the high number of risks involved when shopping online, this is where social media plays an important role, providing information. Many potential online consumers prefer to wait and observe the reviews of other consumers (Yun, 2011).Therefore, when consumers search and gather information from other consumers, this is considered to be a part of a learning process in which consumers observe the successful experience of their social groups before they decide to purchase the product or not. With the help of the social cognitive theory described above, how the ‘social media’ factor affects the customer buying behavior is depicted. What is Online Shopping? Online shopping is defined as the action of buying products or services through the internet (Sunitha & Gnanadhas, 2014). It is very different from conventional shopping as all the business activities and transactions conducted through an online platform. It has provided convenience to consumers, where it allows them to shop at any time, place, and there are no boundaries between countries. Consumers will no longer have to travel to the store, shopping malls, or the supermarket to purchase the products by saving time and money altogether (Punj, 2011; Takaya, 2016 ). Whereas for conventional shopping, consumers have to leave their homes and travel to the store, thus, benefit associated with conventional shopping is to see touch and feel the actual product before making a purchase. Apart from that, it allows consumers to have a face-to-face interaction with the seller, which helps to avoid confusion, and products can be returned easily (Kushwah & Singh, 2019).In Malaysia, online shopping started to grow since the launch of eBay in 2004 (The Star, 2004), which provided the local sellers and buyers greater economic opportunities (Chew, 2018). Many factors can affect the online shopping behaviour of consumers such as reputation, security, discreet purchases, and others (Azami, 2019). However, the present study focused on
  • 4. 4 four factors, namely convenience, price, trust, and social media. Under the dependent variable, it has only one variable, which is online shopping behaviour. Online sellers have placed their attention on understanding what affects the behaviours of consumers when they shop online. With such knowledge, it can assist online sellers as well as researchers to understand what the consumers are thinking and how it can affect their shopping behavior while making online purchases (Dube, Asiedu & Phiri, 2018). Online shopping behaviour is exhibited by consumers while visiting online stores to browse, select and order products and services in conformity with their resources available, with an intent to satisfy their wants and needs (Luigi, Gheorghe & Mircea, 2015). Consumers used to go through six stages of the consumer buying decision process depending on the degree of complexity (Munthiu, 2009). Past studies measured consumer behaviour through different dimensions. Attitude of a consumer towards utilitarian motivation. It includes cost- saving, time effectiveness, variety of product selection, quality of products, services, and convenience. The second dimension is the hedonic motivation, which includes excitement and happiness (Gazukara et al., 2014). The third dimension is perceived usefulness and ease of use while. In contrast, dimension is perceived risks such as financial risk, security, and privacy, which determines the behaviours of consumers towards online shopping (Baber et al., 2014), while bad experience may harm the online shopping behaviour of consumers. According to Monsuwe et al. (2004), the trust of consumers can be built from a positive online shopping experience and reduces the perceived risk. Povera et al., 2020 stated that majority of Malaysian between ages 15- 64-do online shopping. On average, they spend at least 8 hours a day on the internet with their mobile devices, laptops, computers, and tablets, doing some form of shopping-related activity, from researching, browsing to ordering a product or service online. Before the occurrence of the COVID-19 pandemic, the top three product categories that Malaysian consumers normally purchase online were electronics and media, fashion clothing and beauty cosmetics, food and personal care. However, consumers’ online shopping behaviour started to change during the MCO and strongly influenced by social media. (Hasanat et al., 2020). Convenience and Online Shopping Behavior ‘Convenience’ is one of the main factors that cannot be overlooked. A study by Kwek, Tan & Lau (2010) stated convenience as a prime motivator for most of the consumers to shop online and to interact with the online sellers. The concept of ‘convenience’ is more complex than simply offering fast checkouts. It concerns psychological costs such as stress, as non-monetary costs that include time and effort. There are different forms of convenience, such as access, search, possession, transaction, time, and place as Pham et al. (2017) stated all the dimensions of convenience has a positive effect on online shopping behaviour. Dube, Asiedu & Phiri (2018) explained that some consumers prefer to shop online to avoid the face to face interaction with the salesman because it adds more stress as they can easily manipulate consumers into buying the products. In line with this, Takaya (2016) opined that consumers find online shopping convenient because it is easy for them to search for the products that they are looking in. With that, they can compare many kinds of products and services provided by many different online sellers from all over the world. Another study by Isa, Shah, Palpanadan & Isa (2020) suggested that convenience is not only the 24 hours a day for a week operating time, where consumers have a lot of time to decide on the products as
  • 5. 5 they prefer to purchase without the pressure of a salesman. Similarly, the access that consumers have to a lot of stores from different Katawetawaraks & Wang (2011) revealed about 58% of respondents prefer to do their shopping online because they can shop after-hours when the physical stores are closed, and 61% of respondents chose to shop online to avoid the crowds and long queues, especially during the holiday season. Besides that, some consumers not only look for products when it comes to online shopping.The studies have concluded that convenience will result in consumers making repeat purchases. Based on these arguments, the following hypothesis is developed. H1: Convenience positively affects consumers’ online shopping behaviour. Price and Online Shopping Behavior When it comes to online shopping, price is very important for consumers as Lo Hsieh & Chiu (2014) found that greater savings are considered as another motivating factor for consumers to shop online. In the online market, lower prices usually attract consumers apart from convenience. Online consumers are more concerned with monetary value, lower market prices, and special offers on goods and services. About 85% of consumers used to do price research when they shop online. A similar study by (Chew, 2018) proposed price as the second prime factor that led consumers to shop online. The reason behind this is the competitiveness of online markets. With the pressure of existing and new online sellers, many businesses have to cut down the prices by offering special deals and promotions, to attract online consumers. In another study by Dube, Asiedu & Phiri (2018) iterated the income of international students varies as some students are self-funded, on scholarship, or come from a family with a background. It just shows how consumer’s international students, as well as the local students, can be affected by the price of the product due to the restricted income level. Scheinbaum & Kinney’s (2009) findings confirmed the importance of price incentives for online consumers. Furthermore, Natarajan et al. (2017) suggested that placing a price on a product is an important decision of online sellers as it is considered to be one of the core success factors for a product. The reason behind that as the price of a product can determine the consumers’ buying decisions that affect their shopping behaviour. According to Punj (2011), consumers with lower income tend to value money, as they prefer online shopping to conventional shopping because they believe shopping online saves money. Hence, the discussion following hypothesis is proposed. H2: Price positively affects consumers’ online shopping behaviour. Trust and Online Shopping Behaviour Zendehdel et al. (2011) define Trust in terms of online shopping as the willingness of a consumer to rely on another party and vulnerable towards other party’s action with certain expectations that the other party will carry out and delivery of products and services as promised. It plays an important role in the creation of expected outcome in online transactions. Thus, Trust is considered
  • 6. 6 a key factor that influences the behaviour of consumers, and it leads towards the online transaction. Online sellers need to be aware of the online shopping process, and this includes delivering the right product on time to the right address. Trust can also be developed from efficient customer services. Consumers consider Trust to be of the highest importance because it helps to reduce the fear of uncertainty, especially in an e-commerce market where the uncertainty is extremely high. Isa et al. (2020) found online shopping is strongly based on the Trust of consumers, especially when there is minimal face-to-face interaction between the sellers and consumers in an online environment. With a sense of Trust, it can reduce the perception of risk in online shopping; consequently eliminate the consumers’ psychological concerns about online shopping. Online sellers need to focus on building a long-term relationship with their consumers, which is through delivering Trust. In other words, if consumers find the online sellers to be trustworthy, they will most likely engage in online shopping, as they feel secure towards the online transaction process. The Trust of consumers can be determined by the quality of the products and services delivered by online sellers. If consumers have Trust toward the online sellers or the websites, and consider that the online environment is safe and secure, more online shopping, transactions will occur (Athapaththu & Kulathunga, 2018). Based on Dube, Asiedu & Phiri (2018) study, online shopping can be difficult, especially when consumers do not trust the website and the information they provide. Online consumers will probably purchase from a website they trust. This Trust can be influenced by consumers’ experience of online shopping or the reputation of the website. Consumers often feel frustrated buying products from China as it becomes difficult to know whether the products being purchased are original or Chinese copy. On that note, the following hypothesis is proposed: H3: Trust positively affects consumers’ online shopping behaviour. Social Media and Online Shopping Behaviour Edosomwan et al. (2011) define social media as a media that is mainly used to transmit information with mass audiences. It also allows users either consumers or online sellers, to share content. The social media content includes written posts, images, videos, live-videos, video-story, reviews, contests, announcements, offers and promotions, external links, and more. With this kind of content, it can influence the online shopping behaviour of consumers. Social media influences consumers' shopping behaviour in all age groups, especially the younger generations. Deloitte Digital (2014) report stated about 47% were millennials, and 19% were from all other age groups. According to Statista (2020), the most commonly used social media platforms are Instagram, YouTube, Facebook, Twitter, TikTok, Snapchat, and many more. Voramontri & Klieb (2019) suggested that social media is also seen as a new form of 'electronic word-of-mouth', where online consumers provide ratings and reviews of products and services on the social media platform. (Janio, 2020; Elisabeta, 2014). Jothi & Gaffoor (2017) disclosed that consumers do not depend on one source of information to enhance their product and service-related knowledge. Xhema (2019) suggested that consumers have directed to social media as a new way of getting information about a product or service. Sangurde (2019) added that consumers frequently turned to many kinds of social media platforms to search for more information and decide. However, the study by Voramontri & Klieb (2019) found that overloading information is the main issue for consumers in online decision-making because an individual can only process a limited amount of information, as it is not practical to evaluate all options in depth. In line with this, Xhema (2019) further clarified
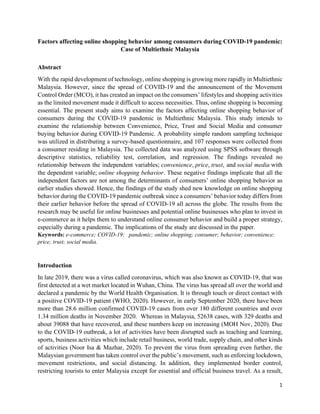
  • 7. 7 that social media had created a certain culture where users with other like-minded individuals communicate with each other, share information, monitor updates, and gather opinions. Consumers, who spend more time on social media, looking into reviews before deciding, tend to be involved in complex buying. Elisabeta (2014), on the other hand, stated that with social media progressing, businesses took the opportunity to use social media as marketing tools to promote their businesses and services. It includes attracting potential consumers and building long-term relationships with them through interactivity (Xhema, 2019). As a result of using social media for purchases, consumers tend to spend four times more compared to those who do not (Deloitte Digital, 2014). In Gavin' (2019) study, 74% of consumers depend on social media assistance for buying decisions, and 78% of consumers' purchases were due to online seller's posts on social media. Furthermore, the quality of information shared on social media by other users was found as 61% meet consumers' expectations, 26% find it better, and 13% find it worse (Voramontri & Klieb, 2019). According to Xhema (2019), social media revolutionizing marketing practices, consumers are continuously exposed to various advertisements that aim to attract the attention of consumers (Katawetawaraks & Wang, 2011; Deloitte Digital, 2014). Voramontri & Klieb (2019) believes happy consumers tend to share their thoughts on social media about praising the products with reviews and comments. Lastly, with influencers on social media, consumers tend to purchase products that are recommended by celebrities or public figures because they considered them as ideal and trust them. It will reflect on consumers' shopping behaviour. Hence, the hypothesis proposed is mentioned below: H4: Social media positively affects consumers’ online shopping behaviour. Conceptual Framework Four factors were selected to develop the conceptual framework based on the literature review. The factors are convenience, price, trust, and social media. The selected factors hold stronger importance for consumers, which relates to online shopping behaviour. According to Kwek, Tan & Lau (2010), consumers shop online due to convenience. Based on Lo Hsieh & Chiuh’s (2014) study, price is another reason consumer shop online. Zendehel et al. (2011) stated trust is a key factor that influences the behaviour of consumers, while (Edosoman et al., 2011) revealed that social media influences consumers’ shopping behaviour in all age groups. These authors’ studies contribute to the development of the conceptual framework; Past literature did not reveal the selected factors testing online shopping behaviour during the pandemic. Figure 1 shows the proposed conceptual framework.
  • 8. 8 Figure 1: Conceptual Framework Research Design and Questionnaire Development The study paradigm follows positivism, which shows the real measure, and establishes a quantitative research approach as a research design of the methodological procedures. To obtain the primary data for this research, the researcher used an online self-administered questionnaire (McLeod, 2018). The method of data collection used in this research is the online questionnaire survey. The reason for choosing this method is due to the time constraint, and this is the best and convenient approach to reach a wider target audience and get a quick response from the respondents (Hair et al., 2006). A probability purposive sampling technique adopted as Pillemer and Finkelhor (1988) opined about an acceptable sample size with no definitive and straightforward rule, which has attained a considerable debate in the research field. In this way, the population frame for the present study comprises 100 respondent located in Klang Valley Area Malaysia. The first section of the questionnaire identifies the respondent’s profile, such as gender, age group, nationality, ethnicity, education status, employment status, and income status. The second section of the survey characterises the respondent’s behaviour in online shopping such as respondent’s favourability, familiarity, and frequency towards online shopping. Then, it also asks the time and money spent on online shopping over some time and what product category respondents usually purchase online. Next, about devices and payment methods, respondents used to shop online. In the next four sections, it covers respondents’ online shopping behaviour towards the four variables, which are convenience, price, trust, and social media (Kwek, Tan & Lau, 2010; Takaya, 2016; Dube, Asiedu & Phiri, 2018; Scheinbaum & Kinney, 2009: Zendehdel et al. 2011; Athapaththu & Kulathunga, 2018; Sangurde, 2019; Voramontri & Klieb, 2019). The questions measured on a five-point Likert scale, ranging from 1 that describes “strongly disagree”, 2 describes “disagree”, 3 describes “neutral”, 4 describes “agree”, and 5 describes “strongly agree”. (Annex-A). Results and Findings Demographic Details Table 1 shows the profile of respondents. The details demonstrate that the majority of the respondents are male (52.3%), and the rest are female (47.7%). Regarding the age group, 92.5% of respondents belong to 20-29 years, while 4.7% to 15-19 years, 1.9% to 40-49 years. The ethnicity skewed towards Malays at 23.4%, with 20.6% Chinese, 10.3% Indian, and 45.7% belonging to other nationalities. Furthermore, the qualification of the respondents depicts 85.0 % having a bachelor’s degree, with 1.9 % having a master’s and 0.9 % with a doctoral degree. Regarding employment status, 80.4 % respondents are students while 8.4% full time employed, 1.9% part-time employed and 8.4% self-employed—the income status of the majority of the respondents 34.6% with RM 1500 and below.
  • 9. 9 Table 1: Demographic Details Variable Answer Frequency Percentage Cumulative Percentage Gender Male Female 56 51 52.3 47.7 52.3 100.0 Age 15 - 19 years old 20 - 29 years old 30 - 39 years old 40 - 49 years old 5 99 1 2 4.7 92.5 0.9 1.9 4.7 97.2 98.1 100.0 Nationality Bangladesh Brunei China Germany India Indonesia Iran Jordan Malawi Malaysia Maldives Mexico New Zealand Norway Pakistan Philippines Seychelles Sri Lanka Sudan U.A.E Zimbabwe 3 13 4 1 4 2 2 1 1 40 8 1 1 1 11 1 1 2 5 4 1 2.8 12.1 3.7 0.9 3.7 1.9 1.9 0.9 0.9 37.4 7.5 0.9 0.9 0.9 10.3 0.9 0.9 1.9 4.7 3.7 0.9 2.8 15.0 18.7 19.6 23.4 25.2 27.1 28.0 29.0 66.4 73.8 74.8 75.7 76.6 86.9 87.9 88.8 90.7 95.3 99.1 100.0 Ethnicity Malay Chinese Indian Others 25 22 11 49 23.4 20.6 10.3 45.7 23.4 43.9 54.2 100.0 Academic Qualification High School Diploma Bachelor’s Degree Master’s Degree Doctorate 7 6 91 2 1 6.5 5.6 85.0 1.9 0.9 6.5 12.1 97.2 99.1 100.0 Employment Status Student Full-time Part-time Self-employed Unemployed 86 9 2 9 1 80.4 8.4 1.9 8.4 0.9 80.4 88.8 90.7 99.1 100.0 Income Status RM1,500 and below RM1,501 - RM2,000 RM2,001 - RM3,000 RM3,001 - RM4,000 RM4,001 and above 37 29 15 7 19 34.6 27.1 14.0 6.5 17.8 34.6 61.7 75.7 82.2 100.0 Descriptive Analysis Table 2 depict the online shopping behaviour of respondents as (44.9%) strongly agree that they favor online shopping, (37.4%) agree, (14%) are neutral and remaining (3.7%) disagree in
  • 10. 10 favoring online shopping. Regarding familiarity with online shopping (15%), respondents only agree, and the rest remain neutral. In response to experience of online shopping (28%) respondents, shop more than once in a week, (10.3%) shop in a week, (13.1%) once in two weeks, (14%) shop more than once in a month, the majority of (30.8%) shop once in a month. About duration in one day to spend, online shopping majority (41.1%) spent up to 1 hour, (36.4%) spent up to 3 hours, (9.3%) 6 hours, and the remaining minimum of 7 hours. Regarding amount, spend in month for online shopping (30.8%) spent RM400 and over, (12.1%) RM300 -RM400, (18.7%) RM200 - RM300, (21.5%) RM100 - RM200 and the rest only spent up to RM100. Based on the product category, the majority of the respondents have selected to purchase online entertainment (62), technology (59), fashion clothing & accessories (58), food & drinks (58), health & beauty (41), and groceries (36). While a number is chosen sports & outdoor (22), personal care & pharmacy (21), home appliances (18) and stationery & hobby supplies (17) that still outweigh home & furnishing (10), books & magazines (9), pet care (9), DIY & Garden (6) and toys & baby equipment (1). 93 selected mobile phones and this may be because mobile phones are the closest and convenient device that they have on them, and people often use their mobile phone device to research before making a purchase. Fifty-three selected a laptop, 12 desktop, and other 12-selected tablets. Based on payment methods, the majority prefer to use credit or debit cards with 77 respondents. 24 used cash and followed by 20 that used bank transfer, PayPal or equivalent is the payment method respondents used the least with some 11 respondents. During the Movement Control Order (MCO) period, (80.4%) respondents have noticed that they have made more purchases as compared to the non-MCO period, and the rest of the respondents claimed that they did not purchase more. Out of 107 respondents, (83.2%) say that they would continue to make online purchases after the MCO is lifted, (7.5%) said no, and the remaining say that they may continue to shop online. Concerning the recommendation, (97.2%) respondents recommend online shopping to other people and (2.8%) chosen not to recommend. Table 2: Descriptive Details of Online Shopping Behavior of Respondents Variable Answer Frequency Percentage Cumulative Percentage Do you favors online shopping? 1 - Strongly Disagree 2 - Disagree 3 - Neutral 4 - Agree 5 - Strongly Agree 0 4 15 40 48 0 3.7 14.0 37.4 44.9 0 3.7 17.8 55.1 100.0 How familiar are you with online shopping? 1 - Strongly Disagree 2 - Disagree 3 - Neutral 4 - Agree 5 - Strongly Agree 0 0 14 16 77 0 0 13.1 15.0 72.0 0 0 13.1 28.0 100.0 How often do you shop online in a month? More than once a week Once a week Once in two weeks More than once in a month Once in a month Not at all 30 11 14 15 33 4 28.0 10.3 13.1 14.0 30.8 3.7 28.0 38.3 51.4 65.4 96.3 100.0 How many hours do you spend on online shopping per Less than 1 hour 1 hour to 3 hours 44 39 41.1 36,4 41.1 77.6
  • 11. 11 week? 4 hours to 6 hours 7 hours and above 10 14 9.3 13.1 86.9 100.0 How much do you spend on online shopping per month? Less than RM100 RM100 - RM200 RM200 - RM300 RM300 - RM400 RM400 and above 18 23 20 13 33 16.8 21.5 18.7 12.1 30.8 16.8 38.3 57.0 69.2 100.0 *What kind of products/services do you buy from online stores? Technology Household Appliances Groceries Food & Drinks Health & Beauty Fashion Clothing & Accessories Online Entertainment Home & Furnishing Sports & Outdoor Toys & Baby Equipment Books & Magazines Pet care Personal Care & Pharmacy DIY & Garden Stationery & Hobby Supplies 59 18 36 58 41 58 62 10 22 1 9 9 21 6 17 13.8 4.2 8.4 13.6 9.6 13.6 14.5 2.3 5.2 0.2 2.1 2.1 4.9 1.4 4.0 13.8 18.0 26.5 40.0 49.6 63.2 77.8 80.1 85.2 85.5 87.6 89.7 94.6 96.0 100.0 *Which device do you use when shopping online? Desktop Laptop Mobile Tablet 12 53 93 12 7.1 31.2 54.7 7.1 7.1 38.2 92.9 100.0 *Which type of payment do you prefer to use when shopping online? Credit Card / Debit Card Bank Transfer PayPal or equivalent Cash 77 20 11 24 58.3 15.2 8.3 18.2 58.3 73.5 81.8 100.0 Do you purchase more during the MCO? Yes No 86 21 80.4 19.6 80.4 100.0 Would you continue to shop online after the MCO is lifted? Yes No Maybe 89 8 10 83.2 7.5 9.3 83.2 90.7 100.0 Would you recommend other people to shop online? Yes No 104 3 97.2 2.8 97.2 100.0 Convenience Factor Table 3 shows the summary statistics of means and standard deviation of the convenience factor. The most strongly rated by the respondents were items related to convenience. Under the convenience factor, items such as C5; I can shop online whenever I want to, C4; shopping online helps me to avoid crowds, and C3; shopping online helps me to save the effort of visiting physical stores, were equally important to respondents with a mean score over 4.5. Items such as C6; online shopping has the advantage of a wide selection of products, C8; I can make discreet purchases, and C7; I always find the products/services I want online, were also important to persuade respondents to shop online with a mean score between 4 and 4.49. Items such as C1; shopping online helps me to save time and C2; shopping online helps me to save money, received a mean score of 3.9 and below. They were not the main reasons for respondents to shop online. Although there are many, who have agreed that online shopping saves money and time, nearly half of the respondents disagree with that statement.
  • 12. 12 Table 3: Descriptive Statistics for Convenience Factor Item Question Mean Std. Deviation C5 I can shop online whenever I want to. 4.63 0.694 C4 Shopping online helps me to avoid crowds. 4.60 0.738 C3 Shopping online helps me to save the effort of visiting physical stores. 4.58 0.615 C6 Online shopping has the advantage of a wide selection of products. 4.21 0.942 C8 I can make discreet purchases. 4.21 0.998 C7 I always find the products/services I want online. 4.16 1.011 C1 Shopping online helps me to save time. 3.90 1.303 C2 Shopping online helps me to save money. 3.25 1.353 Price Factor Table 4 shows the summary statistics of means and standard deviation of the price factor. Under the price factor, only item P3; I visited different online stores to take advantage of the best prices, received a mean score over four. It is the most important item in the price factor for respondents. Items such as P5; I take advantage of free shipping, P2; I compare prices to take advantage of special offers when I shop online, and P8; I pay extra for the quality, were rated highly with a mean score between 3.99 and 3.5. Items such as P1; I always compare prices between online and in-store, before I decide to purchase the product, P4; I often shop online to get points for discounts, and P6; I do not mind paying extra for express shipping, were equally important to respondents with a mean score above 3. Respondents disagree that they would pay extra for the brand reflected in the lowest mean score of 2.99, on item P7; I pay extra for the brand. Table 4: Descriptive Statistics for Price Factor Item Question Mean Std. Deviation P3 I visited different online stores to take advantage of the best prices. 4.19 1.158 P5 I take advantage of free shipping. 3.98 1.373 P2 I compare prices to take advantage of special offers when I shop online. 3.90 1.373 P8 I pay extra for the quality. 3.79 1.242 P1 I always compare prices between online and in-store, before I decide to purchase the product. 3.25 1.461 P4 I often shop online to get points for discounts. 3.17 1.495 P6 I do not mind paying extra for express shipping. 3.12 1.445 P7 I pay extra for the brand. 2.99 1.411 Trust Factor Table 5 summarized the statistics of means and standard deviation of the trust factor. There are no items with a mean score above four. Items such as T5; I often get the product that matches the description from the online seller’s website, T4; online websites offer secure personal privacy, T3;
  • 13. 13 online shopping websites are dependable in their claims, T1; products shown on online shopping websites are reliable, and T2; online shopping websites are authentic in their claims, were rated highly among the respondents with a mean score over 3.5. Item T7; I often receive malfunctioning products when shopping online, is the only item that received the lowest mean score of 1.98. It means most of the respondents receive functional products when they purchase online. Table 5: Descriptive Statistics for Trust Factor Item Question Mean Std. Deviation T5 I often get the product that matches the description from the online seller’s website. 3.98 0.879 T4 Online websites offer secure personal privacy. 3.76 0.845 T3 Online shopping websites are dependable in their claims. 3.75 0.912 T1 Products shown on online shopping websites are reliable. 3.56 1.083 T2 Online shopping websites are authentic in their claims. 3.55 1.057 T6 I have difficulty verifying product quality when shopping online. 3.39 1.392 T8 Online sellers respond on time when I contact them through email/online chat. 3.07 1.096 T7 I often receive malfunctioning products when shopping online. 1.98 1.141 Social Media Factor Table 6 depicts the summary statistics of means and standard deviation of social media factor. Respondents rated highly on items such as SM2; I look for product/services reviews on social media, and SM3; I find products and services reviews on social media are reliable, with a mean score above four. Social media reviews-related were also important to respondents. Items such as SM8; I find information on social media is sufficient to make a purchase, SM7; I use social media to communicate with online sellers, and SM4; I often take advantage of the special deals advertised on social media, were equally important to respondents as they have a mean score above 3.25. Items such as SM6; I use social media to keep up with the latest updates of online stores such as new products, events, promotions, etc., and SM1; I often buy products/services I see on social media, received a mean score above 3. Respondents disagree that they often purchase products/services recommended by social media influencers reflected in the lowest mean score of 2.79 on item SM5; I often purchase products/services recommended by the social media influencer Table 6: Descriptive Statistics for Social Media Factor Item Question Mean Std. Deviation SM2 I look for product/service reviews on social media. 4.05 1.041 SM3 I find products and services reviews on social media are reliable. 4.01 0.927 SM8 I find information on social media is sufficient to make a purchase. 3.73 1.112 SM7 I use social media to communicate with online sellers. 3.45 1.298 SM4 I often take advantage of the special deals advertised on social media. 3.36 1.368 SM6 I use social media to keep up with the latest updates of online stores such as new products, events, promotions, etc. 3.22 1.500 SM1 I often buy products/services I see on social media. 3.11 1.313 SM5 I often purchase products/services recommended by social media influencers. 2.79 1.505
  • 14. 14 Table seven, show the mean and the standard deviation of the independent variables; convenience, price, trust, and social media, and the dependent variable; online shopping behaviour. Convenience and price have a higher mean score of 4.88 and 4.79, respectively, which reflects that the respondents agree with the importance of convenience and price to online shopping behaviour. Online shopping behaviour is the lowest, which implicates that the respondents do not always purchase online. Table 7: Descriptive Statistics for All Variables Variable Mean Std. Deviation No. of Respondents No. of Items Online Shopping behaviour 2.58 0.32 107 11 Convenience 4.88 0.38 107 8 Price 4.79 0.46 107 8 Trust 4.42 0.74 107 8 Social Media 4.45 0.83 107 8 Reliability Test The reliability of the data is computed using Cronbach’s Alpha. Alpha coefficient range in value is between zero and one. Cronbach’s Alpha value that is lower than 0.6 is considered poor. A value between 0.6 and 0.7 is considered moderate, and anything above 0.7 is considered good. In Table 9, Cronbach’s Alpha value of online shopping is 0.685 indicating a moderate internal consistency of items. Convenience has the Cronbach’s Alpha value of 0.703; this indicates good internal consistency of items. Price has the Cronbach’s Alpha value of 0.875, which indicates an excellent internal consistency of items. Also, the price has the highest value of Cronbach’s Alpha in comparison to the other variables. Trust has the Cronbach’s Alpha value of 0.612; this indicates a moderate internal consistency of items. Social media has the Cronbach’s Alpha value of 0.602, which is approximately 0.6; this also indicates moderate internal consistency of items. Table 8: Reliability Test Variable Online shopping behaviour Convenience Price Trust Social Media Cronbach’s Alpha 0.685 0.703 0.875 0.612 0.602 Number of Items 11 8 8 8 8 Pearson’s Correlation In this study, the hypotheses were tested through the analysis of correlations. In correlation, when Pearson’s r is close to 1, it means that the relationship between the two variables is strong.
  • 15. 15 However, the relationship is weak when Pearson’s r is close to 0. Table 10 shows that convenience and online shopping behaviour are weakly correlated with the correlation value of 0.39, indicating that there is a significant positive correlation. It also shows that convenience has the strongest relationship with the dependent variable; online shopping behaviour, in comparison to the other independent variables; price, trust, and social media. Price and online shopping behaviour are also weakly correlated with the value of 0.36, which also indicates a significant positive correlation. Trust and online shopping behaviour show that they are also weakly correlated. It is showing a correlation of 0.37 that indicates a significant positive correlation. As for social media and online shopping behaviour, it demonstrates there is a weak correlation of 0.27, which is approximately 0.3 but still indicating a significant positive correlation. Therefore, when there is an increase in convenience, trust, and social media, this will increase online shopping behaviour. Still, when it comes to price, only a positive price change will lead to an increase in online shopping behaviour. Table 9: Pearson’s Correlation Matrix Online shopping behaviour Convenience Price Trust Social media Online shopping behaviour Convenience 0.39** Price 0.36** 0.66** Trust 0.37** 0.52** 0.41** Social media 0.27** 0.26** 0.26** 0.56** **Correlation is significant at the 0.01 level (2-tailed) Regression Analysis Table 10 shows that the R-value 45.8%, which means there is a significant correlation between the independent variables and the dependent variable. The R square determines the contribution of independent variables towards dependent variables. In the table, the R square is 21%. It means 21% of the time, the independent variables; convenience, price, trust, and social media, contribute towards the dependent variable; online shopping behaviour. Although R square is weak, this does not dismiss the model because other factors can influence online shopping behaviour such as an online store’s reputation, security, and many other factors. The regression model proves that there is a reliable relationship between independent variables with the dependent variable however small the percentage is. According to Neter, Wasserman & Kutner (1983), the regression model tends to show lower adjusted R square when it comes to human social behaviour, even though they are statistically significant. Table 1: Model Summary Model R R Square Adjusted R Square Std. Error of the Estimate 1 0.458a 0.210 0.179 0.28741 a. Predictors: (Constant), Convenience, Price, Trust, Social Media
  • 16. 16 Table 11 highlight F-value of 6.774 that it reaches to significance with a 0 p-value, which is less than the 0.01 alpha level. It means a statistically significant relationship present between independent variables; convenience, price, trust, and social media, and dependent variable; online shopping behaviour. The model is a good fit. Table 11: ANOVA ANOVAa Model Sum of Square df Mean Square F Sig. 1 Regression 2.238 4 0.560 6.774 0.000b Residual 8.426 102 0.083 Total 10.664 106 a. Dependent Variable: Online shopping behaviour b. Predictors: (Constant), Convenience, Price, Trust, Social Media Table 12 demonstrate that if all the independent variables are held constant, then online shopping behaviour will be 0.863. The coefficient of the constant is considered to be significant since the value of t is 2.305. The regression coefficient of convenience is 0.164, with a t-value of 1.561. It means one unit change convenience will result in 0.164 unit increase in online shopping behaviour. The regression coefficient of convenience is 0.097, with a t-value of 1.177. It means one unit change convenience will result in 0.097 unit increase in online shopping behaviour. The regression coefficient of convenience is 0.051, with a t-value of 1.270. It means one unit change convenience will result in 0.051 unit increase in online shopping behaviour. The regression coefficient of convenience is 0.037, with a t-value of 0.926. It means one unit change convenience will result in 0.037 unit increase in online shopping behaviour. However, the results of significant value are higher than p-value of 0.01, which will lead to the rejection of hypotheses. Table 12: Coefficients Coefficients Unstandardized Coefficients Standardized Coefficients Model B Std. Error Beta t Sig 1 (Constant) 0.863 0.374 2.305 0.023 Convenience 0.164 0.105 0.197 1.561 0.122 Price 0.097 0.082 0.139 1.177 0.242 Trust 0.065 0.051 0.152 1.270 0.207 Social media 0.037 0.040 0.099 0.926 0.357 a. Dependent Variable: Online shopping behaviour 4.3. Discussion Kwek, Tan & Lau (2010) stated that convenience is one reason consumers shop online because it is more complicated than quick checkout. Despite the stress, time, and effort, the finding in Table
  • 17. 17 3 shows that respondents rated highly on convenience. Isa, Shah, Palpanadan & Isa's (2020) research stated that convenience is 24 hours operation, of which respondents rated highly on item C5; I can shop online whenever I want to. It has the highest mean score of 4.63 compared to the other items. The respondent answered positively on item C5, believing that online shopping is available 24 hours. The finding also shows that respondents chose to shop online to avoid the crowds with a mean score of 4.6, which is supported by Katawetawaraks & Wang's (2011) research. Based on Table 7, respondents have answered items related to convenience on average, 4.88 out of 5, which means the majority have agreed and strongly agreed that online shopping brings convenience. The finding is reliable because convenience has the Cronbach's Alpha value of 0.703, indicating good internal consistency of items. Although the finding in descriptive statistics shows positive ratings, the result shows differently from correlation and regression analysis, contradicting the prior studies done by Kwek, Tan & Lau (2010), Isa, Shah, Palpanadan & Isa (2020), and Katawetawaraks & Wang (2011). The finding from Pearson's correlation analysis shows convenience is weakly correlated with online shopping behaviour with a correlation value of 0.39. means the relationship between the two variables is weak. In Table 12, the finding also demonstrates that when the convenience increases, online shopping behaviour increases. In theory, the result presents if convenience increases by one unit, the online shopping behaviour increases by 0.164. The finding also shows that convenience has a p-value of 0.122, which is above the significance level of 0.01. It means it is not significant, and hypothesis 1 is not supported. The reason that convenience does not affect online shopping behaviour is that apart from the delay in the product and service deliveries. The convenience of online shopping does not change much because of the COVID-19 pandemic such as finding products or services online, accessing the information on the online stores' websites, fast checkout, shop at any time, avoiding crowds, and other kinds of conveniences. Such convenience will remain the same and will not get affected by the COVID-19 pandemic. Consumers will continue to shop online and enjoy its conveniences as a part of the service characteristics which do not have a significant impact on their purchase behaviour. Furthermore, most of the respondent income is below RM3000, and they are usually more prudent during the pandemic, especially on the types of product to purchase. Convenience seems not important to them as long as they receive a good value of a purchase, i.e. monetary value. Therefore, the result has shown that convenience does not affect online shopping behaviour. Price is considered to be one of the critical factors for respondents during online shopping. According to Lo Hsieh & Chiu (2014), consumers are attracted to lower prices other than convenience. Additionally, Chua et al. (2006) stated that the prices are competitive in the online market. Although it takes time and effort to find an online store that sells products at a suitable price, respondents still believe they can find the best prices after visiting several websites, of which the finding is presented in Table 4. Furthermore, the price may be considered as a catalytic agent to attract the customer; if the company may offer special discount price for offered products and services, then it will stamp significant influence on customer motives and consumers' buying decisions (Satit, Tat, Rasli, Chin, and Sukati, 2012; Munusamy and Hoo, 2008). The consumer is always seeking a reasonable and discounted price for a product while making an online purchase and choose the best rate (Kusmawati et al., 2014; Andreti, Zhafira, Akmal and Kuamr, 2013; Clark. 2018). This is especially true since the respondents' income are mostly lower than RM3000.
  • 18. 18 However, the present study revealed that respondents rated highly on item P3: I visited different online stores to take advantage of the best prices. It has the highest mean score of 4.19 compared to the other items. Respondents rated high because they believe they can find the best prices after visiting several websites. Referring to Table 7, the overall average score for the price is 4.79 out of 5, which means the majority have agreed and strongly agreed that online shopping is essential when shopping online. The findings are reliable because the price has the Cronbach's Alpha value of 0.875, which is the highest compared to the other variables, i.e. online shopping behaviour, convenience, trust, and social media. The reliability test for the price indicated that an excellent internal consistency of items. However, the price has different findings from the correlation and regression analysis, contradicting the previous research done by Lo Hsieh & Chiu (2014) and Chua et al. (2006). In Pearson's correlation analysis shown in Table 9, the price has a correlation value of 0.36, which demonstrates that price is weakly correlated with online shopping behaviour. It would mean the two variables have a weak relationship. In Table 12, the finding shows that when price increases, online shopping behaviour increases too. In theory, the result presented shows if the price increases by one unit, the online shopping behaviour increases by 0.094. The finding also shows that price has a p-value of 0.242, which is higher than 1% the significance value. It indicates that the price is not significant, and hypothesis 2 is not supported. Here, why cost does not affect online shopping behaviour is because online stores have existed long before the COVID-19 pandemic spreading rapidly. Consumers have been purchasing products and services regardless of the COVID-19 epidemic, and the price of many products seem to change due to limitation of resources. Consumers, however, will continue to make online purchases, especially for products related to the daily necessities items such as food, since it is the basic needs of humans regardless of price since they need the products, and they are trying not to get out of the home to purchase safety and health reasons. Hence, price is not a big issue to consumers during the pandemic. Therefore, the price does not affect online shopping behaviour. Trust is a critical factor that influences the behaviour of consumers. According to Isa et al. (2020), it is expected that online stores should provide consumers with correct information concerning the product. Despite the risk that comes along with online shopping, consumers are still willing to shop online. In Table 6, respondents rated highly on item T5; I often get the product that matches the description from the online seller's website with a mean score of 3.98. Respondents rated highly because they usually receive products that fit with the description. Table 8 demonstrates that trust has an overall average score of 4.42 out of 5. Although the majority have agreed that trust is an important factor in online shopping, trust has the lowest average mean score compared to the other independent variables; convenience, price, and social media. The finding is reliable because trust has the Cronbach's Alpha value of 0.612, indicating the right internal consistency of items. Although the finding in descriptive statistics shows positive ratings, the result shows differently from correlation and regression analysis, contradicting the prior studies done by Zendehdel et al. (2011), which confirmed that trust has a strong relationship the online shopping behaviour of consumers. The finding in Table 9 shows that the correlation value for trust is only 0.37, which indicates a weak correlation. It means trust and online shopping behaviour has a weak
  • 19. 19 relationship. In Table 12, the finding presents that when trust increases, online shopping behaviour increases. In theory, the result demonstrates if trust increases by one unit, the online shopping behaviour increases by 0.065. Furthermore, the finding shows that trust has a p-value of 0.207, which is above the significance level of 0.01. It means it is not significant, and hypothesis 3 is not supported. Trust does not affect online shopping behaviour as trust lies between online sellers and consumers. It has no significant relation to the COVID-19 pandemic. Trust depends on the experience of online shopping. It is built on the quality of information, quality of products and services, online reviews, and its website's quality. Consumers will continue to make online purchases with the online sellers they trusted, and their service performance can only effect trust. Therefore, the result has shown that trust does not affect online shopping behaviour. Social media is an essential factor of online shopping as the source of information relating to products and services. The finding in Table 6 has shown that respondents rated highly on item SM2; I look for products/services reviews on social media, which is aligned with Elisabeta (2014) research, which stated that consumers look for information concerning desired products or services on social media. It has the highest mean score of 4.05 in comparison to the other items related to social media. Respondent also rated highly on item SM3; I find products and services reviews on social media are reliable. It receives an average of 4.01. Voramontri & Klieb (2019) stated that consumers tend to post their online shopping experience on social media, including products and service reviews. Respondents believe the reviews on social media are authentic, coming from social media users themselves. The finding is reliable because social media has the Cronbach's Alpha value of 0.602, indicating the right internal consistency of items. However, social media has different findings from the correlation and regression analysis, which contradicts the prior research done by Edosomwan et al. (2011), that stated social media influences consumers' shopping behaviour. The finding from Pearson's correlation analysis shows convenience is weakly correlated with online shopping behaviour with a correlation value of only 0.27. It means the relationship between the two variables is weak. In Table 12, the finding also demonstrates that when the convenience increases, online shopping behaviour increases. In theory, the result presented shows if convenience increases by one unit, the online shopping behaviour increases by 0.037. The finding also shows that convenience has a p-value of 0.357, which is above the significance level of 0.01. It means it is not significant, and hypothesis 4 is not supported. Notably, social media does not affect online shopping behaviour because, before the spreading of COVID-19, most internet users have been using social media to search for products and services reviews, online stores' updates, and more, apart from socializing. Thus, the use of social media has no shown a significant relation to COVID-19 pandemic. It is because consumers will continue to use social media for product and service reviews, make online purchases, and keep up with online stores' updates, before, during and after the pandemic. Recommendation and Conclusion
  • 20. 20 Based on the result and conclusion of this research, there are some recommendations which can help online businesses or potential online businesses formulate their strategies; marketing, pricing, and others. The finding in the research has shown that convenience has the highest importance compared to the other independent variables. Under the convenience factor, respondents scored highest on item C5; I can shop online whenever I want to. It means consumers favor online shopping because of the 24 hours operation. In order to increase consumers’ satisfaction, online sellers should provide a 24/7 chatbot during non-working hours. By adding this feature to the website, it can assist consumers in finding solutions to issues that they are facing. Another convenience item is C4; shopping online helps me to avoid crowds. This means there will be a time when many consumers are going to visit the online store. Therefore, online sellers need to maintain their websites to prevent it from crashing. The following item is C3; shopping online helps me to save the effort of visiting physical stores. Consumers usually visit physical stores because they want the product immediately. By offering more convenience, it can increase customer satisfaction and increase loyalty, such as providing same-day delivery. As for the price factor, one of the top items related to price is C5; I take advantage of free shipping. Based on the result, consumers enjoy free shipping when shopping online. In order to remain as one of the top items related to price, online sellers should create a strategy that keeps consumers shopping on their websites such as consumers may enjoy free shipping when they reach a certain price. Next is the trust factor. The top item related to trust is T5; I often get the product that matches the description from the online seller’s website. The overall average score for that item is 3.98 out of 5. This means there are online sellers that did not provide an accurate description of the product. Online sellers need to ensure that the information that they provide on their website is accurate. A positive online shopping experience will not only increase customers’ satisfaction but also trust. Consumers also rated highly on item T4; online websites offer secure personal privacy. This is because consumers appreciate privacy. Online sellers should take note that privacy is important to consumers and that they should not share any consumers’ details such as email, contact number and more, to a third party. Lastly, it is the social media factor. The top item related to trust is SM2; I look for products/services on social media. Online sellers need to keep their consumers happy. The reason for this is because not only this will increase customers’ satisfaction and loyalty, and improve brand image, but also consumers tend to share their experience on social media regarding a product or service they have purchased. In other words, when a consumer has a bad experience using a product or service, they tend to leave their (negative) review on social media, where other consumers can see and share the post. Online sellers should always monitor their social media account, responding to issues and inquiry. Online sellers should also keep their social media account up to date, as a result, has shown that there are consumers to follow and keep up with the latest news for new products, promotions and events, with a mean score of 3.22 out of 5. In addition to the above, marketers and businesses have to take into consideration the pandemic issue which will continue to deter their business for another year or two. They should be prepared to serve customers effectively via online, i.e. e-commerce and business transactions. Consumers today and soon will become more prudent with each purchase, and they will only choose the best products to purchase and repurchase. Therefore, marketers and businesses must be able to offer more product options with good value to keep a customer from switching to competitors’ products, and improvement on services is essential to retain the customers and to increase their satisfaction.
  • 21. 21 Limitations and Future Research There are several limitations to this research, such as the small sample size was used in this research. Larger sample size could have been attained, given that there is an adequate time frame to conduct the research and gather the data. Secondly, majority of the respondents are aged between 20 - 29 years old, as Taylor’s University has been used as the primary target location for data collection and targeting university students. However, non-student respondents participated in this study. Exploring other locations will not only increase the sample size but also respondents from different age groups. Thirdly, the distribution channels that were used to gather the data, which were email and social media such as Facebook group, and WhatsApp. The majority of the social media users are the younger people; therefore, the research was not able to cover much of people in the age group 30 and above. Fourthly, the possibility of multi-response when distributing the survey online, it is not possible to monitor the respondents, ensuring that they have submitted the online survey one time. This is the main issue when distributing surveys online. Additional software should be added to prevent the respondent from submitting the survey more than once. However, the software was not available. Future researches may cover the whole of Malaysia; increase the sample size, including people from different age groups, educational and employment backgrounds. With this kind of research, it can provide online businesses with information that can assist them in building marketing strategies that fit the business. It might also be interesting to conduct further research on other independent variables, i.e. speed of delivery, online transaction service, types of product, attitude towards the online purchase, intention to purchase, IT knowledge, consumer preference etc. in addition to the present independent variables, i.e. convenience, price, trust, and social media, with online shopping behaviour. Researchers could explore different aspects of online purchase behaviour through a mixed-method study or a purely qualitative study, to get a deeper understanding of how and why consumers behave a certain way. References Ahmed, Z., Ghingold, M., & Dahari, Z. (2007). Malaysian Shopping Mall Behavior: An Exploratory Study. Research Gate. Retrieved 20 September 2020, from https://www.researchgate.net/publication/235296810_Malaysian_shopping_mall_behavio r_An_exploratory_study. Andreti, J., Zhafira, N., Akmal, S., & Kumar, S. (2013). The Analysis of Product, Price, Place, Promotion and Service Quality on Customers' Buying Decision of Convenience Store: A Survey of Young Adult in Bekasi, West Java, Indonesia. Research Gate. Retrieved 27 September 2020, from https://www.researchgate.net/publication/323308768_The_Analysis_of_Product_Price_P lace_Promotion_and_Service_Quality_on_Customers'_Buying_Decision_of_Convenienc e_Store_A_Survey_of_Young_Adult_in_Bekasi_West_Java_Indonesia. Athapaththu, J., & Kulathunga, D. (2018). Factors Affecting Online Purchase Intention: Effects of Technology and Social Commerce. The Canadian Center of Science and Education.
  • 22. 22 Retrieved 27 September 2020, from http://www.ccsenet.org/journal/index.php/ibr/article/view/0/36933. Azami, S. (2019). Factors Affecting Customers’ Purchasing Behavior in Online Shopping. Social Science Research Network. Retrieved 27 September 2020, from https://papers.ssrn.com/sol3/papers.cfm?abstract_id=3377148. Babar, A., Rasheed, A., & Sajjad, M. (2014). Factors Influencing Online Shopping Behavior of Consumers. TextRoad. Retrieved 27 September 2020, from https://www.textroad.com/pdf/JBASR/J.%20Basic.%20Appl.%20Sci.%20Res.,%204(4)3 14-320,%202014.pdf. Bashir, et al. (2018) Online Shopping Behaviour Among University Students: Case Study of Must University. Advances in Social Sciences Research Journal, vol. 5, no. 4, pp. 228-242. [Online]. Available at: https://www.researchgate.net/publication/327175534 [Accessed 27/09/20] Bucko, J., Kakalejcik, L., & Ferencova, M. (2018). Online Shopping: Factors That Affect Consumer Purchasing Behavior. Research Gate. Retrieved 20 September 2020, from https://www.researchgate.net/publication/328319370_Online_shopping_Factors_that_aff ect_consumer_purchasing_behavior. Chew, J. (2018). The History of eCommerce in Malaysia. CustomerThink. Retrieved 19 December 2020, from https://customerthink.com/the-history-of-ecommerce-in-malaysia/. Clark, M. (2018). Infographic: Digital Shopping Habits of Men and Women. Stella Rising. Retrieved 1 November 2020, from https://www.stellarising.com/blog/digital-shopping- behaviors-men-women-mobile-shopping. Constantinides, E. (2014). Foundations of Social Media Marketing. ScienceDirect. Retrieved 27 September 2020, from https://www.sciencedirect.com/science/article/pii/S1877042814039202. Dachyar, M., & Banjarnahor, L. (2017). Factors Influencing Purchase Intention Towards Consumer-To-Consumer eCommerce. Research Gate. Retrieved 27 September 2020, from https://www.researchgate.net/publication/321830911_Factors_influencing_purchase_inte ntion_towards_consumer-to-consumer_e-commerce. Deloitte Digital. (2014). Navigating the New Digital Divide: Capitalizing on Digital Influence in Retail. Retrieved 27 September 2020, from https://www2.deloitte.com/content/dam/Deloitte/us/Documents/consumer-business/us- cb-navigating-the-new-digital-divide-051315.pdf. Dube, F., Asiedu, R., & Phiri, A. (2018). Factor Affecting Online Shopping Behaviour of International College Students in China. Research Gate. Retrieved 29 September 2020, from https://www.researchgate.net/publication/329841120_FACTORS_AFFECTING_ONLIN E_SHOPPING_BEHAVIOR_OF_INTERNATIONAL_COLLEGE_STUDENTS_IN_C HINA. Edosomwan, S., Prakasan, S., Kouame, D., Watson, J., & Seymour, T. (2011). The History of Social Media and its Impact on Business. Research Gate. Retrieved 4 October 2020, from https://www.researchgate.net/publication/303216233_The_history_of_social_media_and _its_impact_on_business. Elisabeta, I. (2014). Social Media and its Impact on Consumers Behavior. Research Gate. Retrieved 29 September 2020, from
  • 23. 23 https://www.researchgate.net/publication/313421625_Social_Media_and_its_Impact_on_ Consumers_Behavior. Garvin, R. (2019). How Social Networks Influence 74% of Shoppers for Their Purchasing Decisions Today. Awario. Retrieved 29 September 2020, from https://awario.com/blog/how-social-networks-influence-74-of-shoppers-for-their- purchasing-decisions-today/. Gozukara, E., Ozyer, Y., & Koçoğlu, İ. (2014). The Moderating Effects of Perceived Use and Perceived Risk in Online Shopping. Research Gate. Retrieved 27 September 2020, from https://www.researchgate.net/publication/292344731_THE_MODERATING_EFFECTS _OF_PERCEIVED_USE_AND_PERCEIVED_RISK_IN_ONLINE_SHOPPING. Gupta, A., Bansal, R., & Bansal, A. (2013). Online Shopping: A Shining Future. Research Gate. Retrieved 27 September 2020, from https://www.researchgate.net/publication/318224640_Online_Shopping_A_Shining_Futu re. Hair, J. F., Hult, G. T. M., Ringle, C., & Sarstedt, M. (2017b). A Primer on Partial Least Squares Structural Equation Modeling (PLS-SEM) (2nd ed.). London: Thousand Oaks: SAGE. Hsu, C. (2008). Dominant Factors for Online Trust. Griffith Research Online. Retrieved 2 October 2020, from https://research- repository.griffith.edu.au/bitstream/handle/10072/26828/57758_1.pdf;jsessionid=5AD42 FFF325725F29700DFE3D0F66B11?sequence=1 Isa, K., Shah, J., Palpanadan, S., & Isa, F. (2020). Malaysians’ Popular Online Shopping Websites during Movement Control Order (MCO). Universiti Malaysia Sabah. Retrieved 27 September 2020, from http://eprints.ums.edu.my/25690/1/Malaysians%E2%80%99%20popular%20online%20s hopping%20websites%20during%20movement%20control%20order%20%28Mco%29.p df. Isa, N., Annuar, S., Gisip, I., & Lajuni, N. (2020). Factors Influencing Online Purchase Intention of Millennials and Gen Z Consumers. Research Gate. Retrieved 27 September 2020, from Jothi, C., & Gaffoor, M. (2017). Impact of Social Media in Online Shopping. ICTACT Journals. Retrieved 29 September 2020, from http://ictactjournals.in/paper/IJMS_Vol_3_Iss_3_Paper_6_576_586.pdf. Katawetawaraks, C., & Wang, C. (2011). Online Shopper Behavior: Influences of Online Shopping Decision. Southwestern State University. Retrieved 24 September 2020, from https://swsu.ru/sbornik-statey/pdf/Online%20Shopper%20Behavior%20Influences.pdf. Kushwah, S., & Singh, A. (2019). From Traditional Shopping to Online Shopping: A Study of the Paradigm Shift in Consumer Behaviour. Research Gate. Retrieved 27 September 2020, from https://www.researchgate.net/publication/335740745_From_Traditional_Shopping_to_O nline_Shopping_A_Study_of_the_Paradigm_Shift_in_Consumer_Behaviour_Journal_of _General_ManaGeMent_research. Kusumawati, R., Oswari, T., Utomo, R., & Kumar, V. (2014). The Influence of 7P’s of Marketing Mix on Buying Intention of Music Product in Indonesia. Research Gate. Retrieved 27 September 2020, from https://www.researchgate.net/publication/275540895_The_Influence_of_7P%27s_of_Ma rketing_Mix_on_Buying_Intention_of_Music_Product_in_Indonesia.
  • 24. 24 Kwek, C., Tan, H., & Lau, T. (2010). Investigating the Shopping Orientations on Online Purchase Intention in the e-Commerce Environment: A Malaysian Study. Research Gate. Retrieved 20 September 2020, from https://www.researchgate.net/publication/288582068_Investigating_the_Shopping_Orien tations_on_Online_Purchase_Intention_in_the_e- Commerce_Environment_A_Malaysian_Study. Li, J., Hallsworth, A. G., & Coca‐Stefaniak, J. A. (2020). Changing grocery shopping behaviours among Chinese consumers at the outset of the COVID‐19 outbreak. Tijdschrift voor economische en sociale geografie, 111(3), 574-583. https://doi.org/10.1111/tesg.12420. Lo, S., Hsieh, A., & Chiu, Y. (2014). Why Expect Lower Prices Online? Empirical Examination in Online And Store-Based Retailers. Research Gate. Retrieved 27 September 2020, from https://www.researchgate.net/publication/269851216_WHY_EXPECT_LOWER_PRICE S_ONLINE_EMPIRICAL_EXAMINATION_IN_ONLINE_AND_STORE- BASED_RETAILERS. Luigi, D., Gheorghe, O., & Mircea, F. (2015). Understanding the Online Consumer Behaviour and The Usage of The Internet As A Business Environment - A Marketing Research. Research Gate. Retrieved 2 October 2020, from https://www.researchgate.net/publication/280087612_Understanding_The_Online_Consu mer_Behaviour_And_The_Usage_Of_The_Internet_As_A_Business_Environment_- _A_Marketing_Research. McLeod, S. (2018). Questionnaire: Definition, Examples, Design and Types. Simply Psychology. Retrieved 4 October 2020, from https://www.simplypsychology.org/questionnaires.html. Mehta, S., Bansal, S., & Bagga, T. (2017). Social Media and Online Shopping - Are the Choices Swayed? A Youth Perspective. Research Gate. Retrieved 27 September 2020, from https://www.researchgate.net/publication/316598308_Social_Media_and_online_shoppin g-are_the_choices_swayed_A_youth_perspective. Ministry of Health. (2020). Retrieved 27 September 2020, from https://www.moh.gov.my/. Monsuwe, T., Dellaert, B., & Ruyter, K. (2004). What Drives Consumers to Shop Online? A Literature Review. Penn State's College of Information Sciences and Technology. Retrieved 27 September 2020, from http://citeseerx.ist.psu.edu/viewdoc/download;jsessionid=7BB7C0FF791F210A366667D FACB919A8?doi=10.1.1.452.3260&rep=rep1&type=pdf. Munthiu, M. (2009). The Buying Decision Process & Types of Buying Decision Behaviour. Sibiu Alma Mater University Journals. Series A. Economic Sciences. Retrieved 27 September 2020, from https://d1wqtxts1xzle7.cloudfront.net/62024899/Dm20200207-80677- rejoul.pdf?1581076738=&response-content- disposition=inline%3B+filename%3DThe_buying_decision_process_and_types_of.pdf& Expires=1608433186&Signature=H2JXOg1y~AB0nTQf~UM59sNsfyBg- 7dep6k3eMzM9FiVjhv7bt1rJ4FAUyRDLoum0wJ4iHq2HvRI~n- jxOZ4Bm8FKnC8eJVTY8CrrlgL0RQ5ddkGf3ykIS0WjgUvf2oEDGn~CfUw20TIeu76Q rLM05fB-H2wS-0OKR7j~- b2rLQTtToDHQNjQoyMpvz6vxF4UMiNpZGLRSLHZD2Jj-G4FgYF9ewWY~0Oz6- Lv-VkpjZoAMygpC52nDEEG2d8xDD-T0ZLOJoVWXG5R- kGXjUONRG80RgNZY4C~R8JKlmtBGAW3rQTigf4yAizs7Se3SreD0iQ2N8YS6Y0Dl JozxzC-g__&Key-Pair-Id=APKAJLOHF5GGSLRBV4ZA.
  • 25. 25 Munusamy, J., & Hoo, W. (2008). Relationship Between Marketing Mix Strategy and Consumer Motive: An Empirical Study in Major Tesco Stores. Penn State's College of Information Sciences and Technology. Retrieved 27 September 2020, from https://citeseerx.ist.psu.edu/viewdoc/download?doi=10.1.1.519.506&rep=rep1&type=pdf . Natarajan, T., Balasubramanian, S., & Kasilingam, D. (2017). Understanding the Intention to Use Mobile Shopping Applications and Its Influence on Price Sensitivity. Science Direct. Retrieved 27 September 2020, from https://www.sciencedirect.com/science/article/pii/S0969698916303216. Neter, J., Wasserman, W., & Kutner, M. (1983). Applied Linear Regression Models. Instituto de Matemática, Estatística e Computação Científica Unicamp. Retrieved 1 November 2020, from https://www.ime.unicamp.br/~dias/John%20Neter%20Applied%20linear%20regression %20models.pdf. Noor, S., Isa, F. M., & Mazhar, F. F. (2020). Online teaching practices during the COVID-19 pandemic. Educational Process: International Journal, 9(3), 169- 184. https://doi.org/10.22521/edupij.2020.93.4 Olasanmi, O. (2019). Online Shopping and Customers' Satisfaction in Lagos State, Nigeria. Research Gate. Retrieved 27 September 2020, from https://www.researchgate.net/publication/337155805_Online_Shopping_and_Customers %27_Satisfaction_in_Lagos_State_Nigeria. Pham, Q., Tran, X., Misra, S., Maskeliunas, R., & Damasevicius, R. (2018). Relationship between Convenience, Perceived Value, and Repurchase Intention in Online Shopping in Vietnam. Research Gate. Retrieved 27 September 2020, from https://www.researchgate.net/publication/322372216_Relationship_between_Convenienc e_Perceived_Value_and_Repurchase_Intention_in_Online_Shopping_in_Vietnam. Pillemer, K., & Finkelhor, D. (1988). The prevalence of elder abuse: A random sample survey. The Gerontologist, 28(1), 51-57. https://doi.org/10.1093/geront/28.1.51 Povera, A., Harun, H., & Arumugam, T. (2020). PM: Malaysia Has Suffered RM63 Billion Losses Due to MCO. New Straits Times. Retrieved 20 September 2020, from https://www.nst.com.my/news/nation/2020/05/588982/pm-malaysia-has-suffered-rm63- billion-losses-due-mco. Punj, G. (2011). Effect of Consumer Beliefs on Online Purchase Behavior: The Influence of Demographic Characteristics and Consumption Values. Science Direct. Retrieved 27 September 2020, from https://marketing.business.uconn.edu/wp- content/uploads/sites/724/2014/08/effect-of-consumer-beliefs-on-online.pdf Sangurde, R. (2019). Impact of Social Media on Buying Behaviour of Consumer with Special Reference to Mumbai Youth. Research Gate. Retrieved 4 October 2020, from https://www.researchgate.net/publication/330618244_impact_of_social_media_on_buyin g_behaviour_of_consumer. Satit, R., Tat, H., Rasli, A., Chin, T., & Sukati, I. (2012). The Relationship Between Marketing Mix and Customer Decision-Making Over Travel Agents: An Empirical Study. Research Gate. Retrieved 27 September 2020, from https://www.researchgate.net/publication/265251058_The_Relationship_Between_Marke
  • 26. 26 ting_Mix_And_Customer_Decision- Making_Over_Travel_Agents_An_Empirical_Study. Scheinbaum, A., & Kukar-Kinney, M. (2009). Beyond Buying: Motivations Behind Consumers’ Online Shopping Cart Use. Research Gate. Retrieved 29 September 2020, from https://www.researchgate.net/publication/222416716_Beyond_buying_motivations_behi nd_Consumers%27_online_shopping_cart_Use. Statista. (2020). Most Used Social Media in 2020. Retrieved 27 September 2020, from https://www.statista.com/statistics/272014/global-social-networks-ranked-by-number-of- users/ Suleman, D., Zuniarti, I., Sabil, Setyaningsih, E., Yanti, V., & Susilowati, I. et al. (2019). Decision Model Based on Technology Acceptance Model (Tam) for Online Shop Consumers in Indonesia. Allied Business Academies. Retrieved 30 September 2020, from https://www.abacademies.org/articles/decision-model-based-on-technology-acceptance- model-tam-for-online-shop-consumers-in-indonesia-8624.html. Sundström, M. (2008). The Online Retail Customer and Convenient Shopping. Research Gate. Retrieved 30 September 2020, from https://www.researchgate.net/publication/228890681_The_Online_Retail_Customer_and _Convenient_Shopping. Sunitha, C., & Gnanadhas, M. (2014). Online Shopping - An Overview. Research Gate. Retrieved 2 October 2020, from https://www.researchgate.net/publication/264556861_Online_Shopping_- _An_Overview. Takaya, R. (2016). Antecedents Analysis of Purchase Intention. Research Gate. Retrieved 27 September 2020, from https://www.researchgate.net/publication/335848748_Antecedents_Analysis_of_Purchas e_Intention. The Star. (2004). eBay Malaysia Launched. Retrieved 2 October 2020, from https://www.thestar.com.my/business/business-news/2004/12/03/ebay-malaysia- launched. Voramontri, D., & Klieb, L. (2018). Impact of Social Media on Consumer Behaviour. Research Gate. Retrieved 30 September 2020, from https://www.researchgate.net/publication/326098250_Impact_of_Social_Media_on_Cons umer_Behaviour. World Health Organisation. (2020). Coronavirus Disease (COVID-19) Pandemic. Retrieved 20 September 2020, from https://www.who.int/emergencies/diseases/novel-coronavirus- 2019. Xhema, J. (2019). Effect of Social Networks on Consumer Behaviour: Complex Buying. Science Direct. Retrieved 29 September 2020, from https://www.sciencedirect.com/science/article/pii/S2405896319325157. Yeoh, O. (2020). Future Proof: Adapt in a Post-MCO World. New Straits Times. Retrieved 27 September 2020, from https://www.nst.com.my/lifestyle/sunday- vibes/2020/06/597251/future-proof-adapting-post-mco-world. Yun, Z. (2011). Testing A Theoretical Model to Examine the Relationships Among E-Social Shopping Motivation, Perception, And Behavioral Intention. Michigan State University. Retrieved 30 September 2020, from https://d.lib.msu.edu/etd/731/datastream/OBJ/download/Testing_a_theoretical_model_to
  • 27. 27 _examine_the_relationships_among_e- social_shopping_motivation__perception__and_behavioral_intention.pdf. Zendehdel, M., Paim, L., Bojei, J., & Osman, S. (2011). The Effects of Trust on Online Malaysian Students Buying Behavior. Research Gate. Retrieved 27 September 2020, from https://www.researchgate.net/publication/280311968_The_Effects_of_Trust_on_Online_ Malaysian_Students_Buying_Behavior. Annex-A VARIABLE ITEM QUESTION CONVENIENCE C1 C2 C3 C4 C5 C6 C7 C8 Shopping online helps me to save time. Shopping online helps me to save money. Shopping online helps me to save the effort of visiting physical stores. Shopping online helps me to avoid crowds. I can shop online whenever I want to. Online shopping has the advantage of a wide selection of products. I always find the products/services I want online. I can make discreet purchases. PRICE P1 P2 P3 P4 P5 P6 P7 P8 I always compare prices between online and in-store, before I decide to purchase the I compare prices to take advantage of special offers when I shop online. I visited different online stores to take advantage of the best prices. I often shop online to get points for discounts. I take advantage of free shipping. I do not mind paying extra for express shipping. I pay extra for the brand. I pay extra for the quality. TRUST T1 T2 T3 T4 T5 T6 T7* T8 Products shown on online shopping websites are reliable. Online shopping websites are authentic in their claims. Online shopping websites are dependable in their claims. Online websites offer secure personal privacy. I often get the product that matches the description from the online seller’s website. I have difficulty verifying product quality when shopping online. I often receive malfunctioning products when shopping online. Online sellers respond on time when I contact them through email / online chat. SOCIAL MEDIA SM1 SM2 SM3 SM4 SM5 SM6 SM7 SM8 I often buy products/services I see on social media. I look for product/service reviews on social media. I find products and services reviews on social media are reliable. I often take advantage of the special deals advertised on social media. I often purchase products/services recommended by social media influencers. I use social media to keep up with the latest updates of online stores such as new products, Events, promotions, etc. I use social media to communicate with online sellers. I find information on social media is sufficient to make a purchase. *Indicates that the items are coded in reverse