
Recommended
Recommended
More Related Content
Similar to Introduction If one examines the relative costs associated with .docx
Similar to Introduction If one examines the relative costs associated with .docx (20)
More from normanibarber20063
More from normanibarber20063 (20)
Recently uploaded
Recently uploaded (20)
Introduction If one examines the relative costs associated with .docx
- 1. Introduction If one examines the relative costs associated with managing a direct sales force and compares it to other marketing expenses, there would be surprise at the percentage of the total marketing budget that supports the sales effort and the cost of a direct sales force. With the cost of a typical business-to-business sales call averaging close to $500, and with selling cycles that can extend over several years, it is easy to imagine very large budgets. Along with these numbers comes a concomitant concern for the effective utilization of these precious resources. Firms grapple with the question of how to improve the productivity of their sales force. In order to better appreciate the magnitude of the challenge, this note discusses the “numbers” that drive the sales-force management process. Sales-force management can be a determinant of marketing success and yet this competence is sometimes neglected. You’d expect Sales and Marketing to be aligned in any successful organization— yet in fact the opposite is often true. The reality is that Sales and Marketing need to synch up or sink. The two need to be integrated in order to build customer relationships, enhance brand, capitalize on leads, improve market share, and to boost revenue.1 It stands to reason that sales-force management and its different elements should be aligned with the goals and objectives of the marketing strategy of which it is a part. Conflicts can arise in how people are allocated to territories or in how sales people are rewarded such that the best laid marketing plans can crumble under their own weight. Plans that emphasize a focus on larger key accounts in a small number of segments will fail if management has not thought to hire and train a select number of sales people who know how to sell at the c-level and have an appreciation for the complexity of calling on a large headquarters account. It is not uncommon for a single person, backed by a team of people, to have worldwide responsibility
- 2. for a single company. Sales Territories One of the first decisions made by sales executives is how many salespeople are needed to call on potential customers. Typically, this decision is made in conjunction with the assignment of salespeople to a region or sales territory. Thus, a territory is a salesperson’s battleground; it is the turf that they defend. Territory assignment can be quite a complex process in that it serves to accomplish certain objectives. On one level, the size is often drawn to minimize the travel expenses and time associated with serving one’s customer base within a specified geography. On another level, attempts are often made to balance the potential sales that each territory contains so that sales efforts and results can be compared easily across regions. Given the nature of certain businesses and the concentration of customers, it is a challenge to balance workloads. For instance, in the medical devices market, one salesperson could be assigned a city such as Philadelphia, Baltimore, or Boston where there are high concentrations of hospitals, medical schools, and clinics. But another person might find themselves traveling among four or five states in the western part of the United States to achieve the same potential. Depending on the differences between each territory, salespeople can either be given too much, or too little work to do. This can lead to the underservicing or overservicing of customers. Underservicing customers is harmful because sales are lost due to a lack of activity at all levels—fewer leads are being sought out and fewer prospects identified. In addition to lost sales from cultivating fewer new customers, spending less time with current customers will reduce potential sales and could ultimately cause customers to find another company to do business with. This all can be caused by a salesperson being stretched too thin. Overservicing, less obviously a problem, can result in lower sales both directly and indirectly. A direct result would be a
- 3. salesperson who is continually calling a customer until they become alienated. An indirect result is the loss from sales that could be made in an underserved territory. Unbalanced territories can raise the problem of unfair sales potential between members of the sales force. This will result in distorted compensation potential and can cause a talented salesperson to leave for a company with better balance and compensation. Achieving the correct balance between territories results in a happier customer, salesperson, and company. It is, however, primarily a matter of management judgment. The main considerations are trying to: (1) balance workloads; (2) balance sales potential; (3) develop compact territories; and (4) minimize disruptions during the redesign. The effect that each of these can have on different stakeholders is represented in Exhibit 1.2 Workload Before designing new territories, a sales- force manager should evaluate the current situation. A typical method to determine the workload for a territory could be calculated as follows: Workload (#) = [Current Accounts (#) × Average Time to Service an Active Account (#)] + [Prospects (#) × Time Spent Trying To Convert a Prospect into an Active Account (#)]3 Sales Potential To calculate the potential of a territory, it is necessary to collect some key facts about the area covered. Potential can be represented in a few different ways. The most basic is population. This is the number of potential accounts that exist in a territory. In the case of copier sales, this could represent the number of offices in a territory. At the same time sales potential can be decreased by the presence of a dominant competitor that might “own” a certain region or segment of the market. As a result, the potential market size is reduced by the expected value of winning that portion of the market. In this instance, potential is a less relevant number, and one can now speak of served market (i.e., that portion of the total market that
- 4. is available to your firm). If the market’s absolute size is $50 million and a key competitor has an 80% share of a segment worth $5 million, it follows that the likelihood of winning share from that competitor is quite low, and the size of your served market becomes the $50 million less the $4 million that is unavailable to your firm Yet another way to size the market is to estimate usage based on the size of the population in a territory. For instance, consumer product retailers might estimate store density based on the population in a territory. Closely tied to population is buying power. For copiers, this would be based on the sizes of the potential offices and the wealth of the companies in a territory. This could also be based on demographics of the territory if the end users are the citizens that populate the territory. Sales Potential ($) = Number of Possible Accounts ($) × Buying Power ($) Buying power is a dollar figure based on average office sizes, wealth of companies, industry sales, or demographics of end- user customers. _______________________________________ Example: There are six small, eight medium, and two large companies in a territory that have historically made copier purchases on the average of $500, $700, and $1,000 annually. The sales potential for the territory would be: Sales Potential = 6 * $500 + 8 × $700 × 2 × $1,000 = $10,600 _______________________________________ Once the workload and sales potential of a territory are calculated, the other key metric necessary in comparing territories is Size Finding. The size of the territory could simply be measuring the geographic area that it covers. More relevant is the time it takes to travel in the territory. Travel time is a better metric than size because it is a representation of what size implies—the time needed to reach each customer. Depending on the quality of roads, density of traffic, or grouping of businesses, territories of equal area could have very different travel-time requirements. A salesperson can keep track of the necessary time to travel from call to call, which can
- 5. either be recorded over time to find an average travel time in a territory, or calculated using specialized computer software.4 The manager’s goal is to balance territories among salespeople. This can be done initially by looking at workloads, but it may beneficial to combine potential and size into “Sales Potential/Travel Time” to draw an accurate comparison. Once a balanced territory assignment has been designed, it should then be taken to the sales force to gain recommendations and final approval and buy-in. Territory Changes Salespeople tend to be very protective of their sales territories and do not welcome change. They have spent a great deal of effort establishing relationships with buyers from whom they expect a long and fruitful association. At the same time, learning the habits, requirements, and buying criteria of new clients also takes time, and this is energy taken away from what they get compensated for. Despite the impact of the sales force, the primary consideration should be the affect any territory changes have on the customer base. Minimizing the disruption to the customers should be a priority with any change. The other major Considering the effect on both the customers and the sales force is important when making a beneficial change for the company. Setting Sales Goals Setting sales goals has several objectives, all of which must be aligned. Sales goals should align with the profit and sales objectives of the firm and should support the product plans of the product managers, as well as the channel and market plans of their respective managers, and should serve to motivate the sales force to direct their effort in ways that are consistent with each of the goals previously mentioned. In addition, sales goals can be utilized to emphasize a greater mix of new product sales or can be used to focus on customer retention as opposed to acquisition. Our point is that the rule is simple: show how people are compensated and you will know how they spend their time. Still, 85% of U.S. companies set goals for their
- 6. salespeople.6 Sales should follow some general guidelines. At the highest level, a manager can implement the SMART strategy.7 Goals should be Specific, Measurable, Attainable, Realistic, and Time-bound. Specific goals are detailed to a department, a territory, and even a salesperson. They are clear and applicable to the individual so that the salesperson does not have to derive their part of the goal. Measurable goals allow the salesperson to set an exact target and then track their progress toward their goal. This is a concrete number like “dollars of sales” or “percentage increase.” Vague goals like “more” or “increased” are not effective because of the difficulty in measuring progress. Attainable goals are in the realm of possibility. They can be visualized and understood by both the manager and salesperson. Realistic goals are set high enough to motivate but not so high that the salesperson gives up before they even start. Time-bound goals have an exact time frame in which they must be met. This applies pressure to reach them sooner, rather than later, and defines an end-point when the results should be checked. A sales-force manager should set the goals for each direct report with an eye to what the sales corporation believes possible. Think of the process cascading so that the totals at the salesperson level represent the disaggregated sales numbers that are rolled up from the field to the region, to the sales force Generally, these are figures passed down to the sales-force manager that must then be divided among the force. The corporation probably uses the previous year’s sales of the product, the previous year’s market sales, the previous year’s competitor’s sales, and the company’s current market share to forecast sales for a given year. A sales-force manager will need to reconcile their allocations to corporate projections. A manager will allot sales targets among the sales force in a district using specific measures of individual performances from the previous year. Of greatest importance are each salesperson’s percentage of sales and their sales potential (based on territory size/population and buying power).
- 7. Once a goal program has been determined, it is important to then take that program and apply it to the previous year. This will allow a sales- force manager to see how each member of the sales force would have done if they had their goals set using the same philosophy as the upcoming year. What a manager is checking for is to make sure that, based on their judgment from the previous year, each salesperson would have been rewarded and “punished” as their performance warranted. This will indicate that the correct allotment method is being used and also help to fine tune the weights if the weighting method is used. It is also important to reevaluate the sales goals during the year to make sure that they are on track. If it looks like there will be more than 90% or less than 50% achievement of the goal before the end of the period, there may be a need to alter the goal. This will keep the sales force from lowering their productivity too early and from either reaching their goal or giving up and waiting for next year. A possible rule of thumb is to plan for a success rate of 75% when setting the goals for your sales force. That will ensure that enough salespeople reach their reward and that the reward is sufficiently challenging. (Where “re- budgeting” takes place, ensure it is properly recorded. It is easy to see that revised sales goals become “out of whack” with financial budgets and senior management expectations unless care is taken). Remember managers may need to push back against the corporation when the sales forecast is too aggressive. If it looks like each person will need to increase their output by an implausible amount, then the purpose of setting the goal is lost. It is important to discuss with the sales force how they feel about the goals that are set to see if there is buy-in or outright resistance. While the sales force needs to be pushed, too much pressure can cause the company to lose valuable salespeople. Forecasting Sales There are three main ways of allotting the company forecast among the sales force. Each method tries to set fairly the goals that are achievable and in line with the territory and previous
- 8. year’s results. These are goals in the form of sales totals for an individual salesperson with a district being the collection of all the territories covered by a sales force. (1) Allocation based on the salesperson’s previous year’s sales:8 Sales Total ($) = Share of District’s Previous Year’s Sales from Salesperson (%) × Forecasted Sales for District ($) (2) Allocation based on salesperson’s previous year’s sales plus increased sales potential of the territory:9 Sales Total ($) = [Salesperson’s Previous Year’s Sales ($) + Forecasted Sales Increase for District ($)] × Sales Potential of District Located in Salesperson’s Territory (%) (3) Allocation based on the combination of the two: a Weighted Method.10 A weight decided by management must be assigned to both the previous year’s sales total for the salesperson and the sales potential of the territory. The weighting decision is really up to the sales-force manager’s judgment or desires. For instance, they may want to weight “territory potential” highly, but without totally disregarding last year’s sales. Another method is to use regression analysis to establish weights. Weighting can help compensate for unbalanced territories. Weighted Share of Sales Allotment (%) = Share of District’s Previous Year’s Sales from Salesperson (%) × Assigned Weighting (%) + Share of Sales Potential of District Located in Territory (%) × Assigned Weighting (%) Sales Total ($) = Weighted % of Sales Allotment (%) × Forecasted sales for District ($)Example:11 A salesperson had previous year’s sales of $1,620, which represented 18% of the sales in the district and was responsible for a territory with a sales potential of 12% of the district. The following are three ways to calculate the sales goal (SG) of a salesperson when a corporate-dictated $10,000 sales goal (increase of $1,000) for the upcoming year is put in place: (1) Sales goal based on salesperson’s previous year’s sales = 18% × $10,000 = $1,800 (2) Sales goal based on salesperson’s previous year’s sales plus
- 9. increased sales potential of the territory = $1,620 + 12% × $1,000 = $1,740 (3) Weighted average based on 50% previous years sales and 50% sales potential = 18% × 50% + 12% × 50% = 15% Sales goal = (15%) × ($10,000) = $1,500 Measuring Sales Results Performance is a difficult concept to measure—what does it entail? That is, sales performance is far more than booking a sale during the quarter. In fact, when the link between effort and outcome cannot be easily traced, sales performance is difficult to measure. If the selling cycle for a product or service is in excess of two years and the selling responsibility is diffused over a global sales team, it is easy to envision the difficulty in rewarding individuals. There is a debate regarding the use of outcome measures such as sales booked or contribution earned and the use of more behavioral measures that do not record sales per se. Yet, it is well established that certain behaviors are likely to lead to a sale over time. This is true especially as the sales effort shifts to consultation. The measures of performance are tied to the sales process and the marketing strategy. Is the goal to convert a new customer to your products or is the goal to gain greater share of an existing customers product mix? Effectiveness measures are driven by the length of the selling cycle, the complexity of the buying process, and the number of people who are part of the buying/decision-making process. While contribution margin is a critical number to measure, the ability to influence the buying process might be a key first step, since being perceived as a problem-solver/consultant is a necessary first step to gaining the confidence of the buyer. The challenge becomes finding a way to measure salesperson behaviors that will evoke the level of confidence needed to be taken seriously as a potential trusted partner. When analyzing the performance of a salesperson, there are a number of metrics that can be compared. These metrics tell
- 10. more about salespeople than just the obvious—amount of product sold. While this is an important measure, there are other measures that are also important to an organization. While overall sales and revenue are good indicators of success, it is generally the contribution that is more vital. This is the amount of money the company is actually making on each sale after costs are subtracted. If salespeople are selling many low- margin items with a big price tag, they may be costing the company money by not selling other products with a higher margin per sale. The effectiveness of a salesperson is the key measure when analyzing performance. While this metric can take many different forms, it is the role of the sales manager to get the most out of each salesperson by maximizing the appropriate measure of effectiveness. Calculating the effectiveness of a salesperson is not difficult, but it does require keeping track of a few important numbers. Fortunately, these are statistics that are commonly recorded in the sales industry. The most important is the amount of each sale (in a dollar figure) and the contribution from that sale. It may also be important to keep track of which items are sold if the salesperson has been instructed to push a certain product line. Less-obvious information required is the statistics on “Number of Calls Made” (combination of face-to-face and phone meetings), “Total Accounts Active,” and “Total Accounts in the Territory.” The latter two are necessary in calculating the buying power of a territory. A major problem with performance review is a tendency to rely on only one or two metrics. A complete review of a salesperson should include as many of the above metrics as possible. A salesperson that makes $30,000 per call can be more valuable than one that makes $50,000 per call. If only the “$ Sales per Call” is used, then it might be overlooked that the “$ Sales per Potential Account” is greater for the salesperson making less per call. Another problem is focusing on just contribution. If a
- 11. salesperson is in a small territory, they could have a low total contribution but a very high “$ Sales per Buying Power.” When this is true it may be time to increase the size of the territory for this salesperson. Another error that could be made would be to reward a salesperson that increased their “$ Sales per Active Account.” This could be done by just eliminating the weaker accounts without adding any additional sales. More difficult are metrics relating to customer service; there are no concrete numbers to look at other than customer complaints or retention rates. Each of those is telling, but how can a sales manager quantify the service being given to customers that are not leaving or complaining? One possible way is to develop a survey with an itemized scale to put some numbers to the opinions. Once enough of these surveys are completed, an average score for different service metrics can be calculated. Then, when compared against sales figures, a company can correlate sales with customer service and grade salesperson performance. ______________________________________ Example: This is an example of how a customer’s opinion could be translated to a metric. Please circle the level of service your business received from our sales staff after shipment of the industrial mixer: 12345678910 Extremely Poor Satisfactory Extremely Good While looking at Customer Service survey scores is straightforward, it may difficult to gather enough accurate data to use. Often, customers won’t fill out the surveys or will only do so when there is a problem. A small sample size or prevalence of negative responses can distort the results. Calculating Effectiveness Besides just looking at total sales or total contribution, there are other ways of looking at the data to draw deeper meaning. The basic idea of effectiveness is represented by the following formula:12 Effectiveness (I) = Sales ($) / Contacts with Clients (#) Common derivatives of this are: Effectiveness (I) = Sales ($) / Calls (#) Effectiveness (I) = Sales
- 12. ($) / Potential Accounts (#) Effectiveness (I) = $ Sales ($) / Active Accounts (#) Effectiveness (I) = $ Sales ($) / Buying Power ($) Each formula can be useful when comparing salespeople from different territories. Of course even a seemingly telling figure like “Total Sales” can be skewed in a district where certain salespeople have larger territories with more potential accounts or greater buying power. Different formulas give specific insight into the performance of the salesperson. If the “Sales per Call” is low, a salesperson might need training to get The customer making larger purchases, or more training on closing skills. If the “Sales per Potential Account” or “Sales per Buying Power” metric is low, the salesperson may not be doing enough to seek out new accounts in the territory. Each is based on the entire territory and includes possible customers along with current customers. More time spent on leads and prospecting could help to raise this value. The “Sales per Active Account” is a good indicator of how effective the salesperson is at getting the most out of a customer. While it is important to get the most out of every call, salespeople are not going to reach their goals in just one call. There is a certain amount of effort that is required to complete sales. This can be represented graphically:13 Although more attention and time paid to a customer can increase sales, there is a point of diminishing returns for placing more calls to the same customers. Eventually, the incremental business created by each call is worth less than the full cost making the call. One other performance metric of importance is sales compared to expenses. Sales for Expenses (%) = Expenses ($) / Sales ($) If this value is high for one salesperson in comparison to other members of the sales force, it may indicate the salesperson has poor control of their expenses. Examples of poor expense control could be making too many trips to the client when not necessary, overproducing product pamphlets, or hosting too many free dinners. Another possible reason for expenses to be a
- 13. high percentage of sales could be poor closing; they may not deliver desired sales after spending significant money on a potential customer. The topics of goal setting and compensation must be addressed simultaneously. The issues related to compensation range from questions regarding what form of compensation is appropriate for the selling task, to setting the metrics against which performance will be based, to finding the level of bonus, salary or commission that achieves the financial targets of the firm. As a general rule, as the linkage between performance and sales behavior becomes less direct and causality is less easily observed, the less useful are compensation models that rely heavily on a commission-based structure. Commission works best when sales effort can be linked directly to a sale. For instance, sales person X calls on a customer and the order is written on the spot. Yet, if the salesperson spends months developing the account, and her colleagues in other divisions and functions have also called on different people in the buying organization to coordinate a systems-sell or configure a total solution, it becomes more difficult to attribute sales effort to the work of one person. Perhaps now a bonus structure building on a team incentive becomes the more relevant approach to reward results. While there is no best answer, there are certain rules that do apply. Rule 1: Make the compensation plan easily understood so that the salesperson understands what behaviors are expected, what the sales objectives are, and what outcomes lead to financial reward. Rule 2: Don’t play games. State the compensation plan and don’t change it. This is especially true if the plan is changed to lessen the potential gain for the sales force. Rule 3: Try to set metrics that are objective. If metrics must be subjective, make sure the process is transparent and that the sales force is clear about what the rules are and how success is measured. Rule 4: Think about non- financial incentives such as recognition programs. Keep in mind that compensation cannot be treated in isolation
- 14. and that it is part of a sales performance measurement plan. As such, the plan should: · Achieve sales objectives · Control expenses · Develop customer support and encourage greater interaction with customers · Communicate with company · Foster non-selling behaviors that use and apply technical knowledge · Encourage sales people to work internally as part of team. Simply put, the good news and bad news about compensation plans is that they work. Sales compensation should drive the appropriate behavior among the sales force that is aligned with it and the marketing strategy of the firm. The incentive plan needs to align the salesperson’s activities with the firm’s objectives.14 A good plan can be either based on the past (growth), the present (comparison with others), or the future (% of goal achieved).15 Salary, bonus, and commission When designing a compensation plan for a sales force, there are four key areas: level of pay, mix between salary and incentive, measures of performance, and the performance-payout relationships.16 (1) The level of pay, or compensation, is the amount the company plans on paying the salesperson at the end of the year. This is usually thought of as a range, because the results will vary if there are bonuses or a commission plan. Compensation levels are usually determined by the availability of salespeople. The number of salespeople looking for work (with a product that is easier to sell), or the difficulty of selling the product play a key role. If selling requires high levels of knowledge due to industry complexity or requires multi-lingual ability, there may be fewer available salespeople and a need to have a higher level of pay.
- 15. (2) The mix between salary and incentive is the way a company chooses to allocate compensation. The salary is a guaranteed amount of money that the salesperson will make in a year. The incentive can take multiple forms such as a bonus or commission. In the case of a bonus, the salesperson will get a lump sum for reaching certain target levels of sales. With a commission, the incentive is incremental and comes with each sale. In order to give incentives, it is important to be able to accurately measure the role the salesperson plays in each sale. The higher the level of causality that can be attributed to the salesperson, the better the incentive system. (3) A variety of metrics can be used to measure a salesperson’s performance. The company will need to establish objectives and design their metrics around these goals. Metrics can gauge the salesperson’s success compared to: the past, by measuring percent growth over the previous year; the present, by ranking salespeople based on current results; or the future, by measuring percentage of goal achieved. The sales manager can also choose on what level to focus the incentive plan. It could be company- wide (e.g., home improvement tools), division-wide (e.g., cordless tools), or a single product line (e.g., screwdrivers). Again, it is the firm’s objectives that will determine the focus of the incentive program. Lastly, a time period should be defined for measuring the performance of each salesperson. (4) If an incentive program is instituted, there needs to be a defined performance-payout relationship. This can take many forms as long as it is clear and communicated well to the sales force. Having a simple system will allow the sales force to set individual goals for the year. This will motivate them to sell more when they can clearly see the path that must be followed to get to each incentive. Common measurements used in incentive plans are total sales, total contribution, market share, customer retention, and customer complaints.17 Because it is a system that rewards a salesperson for reaching a certain goal, the actual target must also be defined at the beginning of the year (or other time
- 16. period). Continual tracking of these metrics will help both the salesperson and the company plan for year-end compensation. Timing is a major consideration with incentive plans. The data needs to be collected in a timely fashion so that both the salesperson and the company know where they are in relation to their goals and can alter their behavior as appropriate. The actual timeframe that the plan covers is also important. If a company tries to reward with weekly incentives, it could be an expensive program to administer—too time consuming for both the company and the salespeople. A period that is too long runs the risk of having forecasts and goals that are drastically inaccurate. This could result in the sales force being paid too much or too little. One option is to mix the plan so that it rewards for both a simple metric like “Calls per Week” and a more complicated metric like “Market Share Achieved” per year. Another complication of using an incentive program is the issue of being able to assign causality to individual salespeople. This can become a problem in a number of instances, especially team-work—it is difficult to figure out which member of the team deserves what reward. In this instance, it might be better to reward the entire team with equal bonuses for meeting a goal. One last concern is that when an incentive program is implemented, it may reward the wrong salespeople. In order to avoid this, the sales manager would want to take any newly proposed incentive program and apply it to the previous year as if it had been in place. A good plan will usually reward the salespeople that the manager knows to be best. Calculating total compensation There is considerable freedom in designing a compensation system. The key is to start with a forecast for sales and a range wherein the salesperson’s compensation should fall. Once that is determined, there are many ways to motivate the salesperson. For a multi-bonus system, the following could represent the compensation for a salesperson: Compensation ($) = Salary ($) + Bonus 1 ($) + Bonus 2 ($)
- 17. In this system, the first bonus would kick in at a level approximately half way to the sales goal for the year, and then the second bonus will be awarded when the goal is met. In a commission system, the following would represent the compensation for a salesperson: Compensation ($) = Salary ($) + [Sales ($) * Commission (%)] It should be noted that theoretically the salary could go as low as $0 in a 100% commission position. Many jurisdictions place limits on such schemes, however. Managers should ensure that the plan they decide upon complies with any local employment law. There is also a way to combine the two concepts by either awarding bonuses on top of commissions at certain sales levels or by increasing the commission percentage at certain sales levels. _______________________________________ Example: Tina makes a commission of 2% on each sale up to $1,000,000 and then 3% on each sale after that. Her salary is $20,000 per year. Her compensation for a year when she sold $1,200,000 worth of product would be: Compensation = $20,000 + (.02)*($1,000,000) + (.03)*($200,000) = $46,000 _______________________________________ Once the compensation plan for the sales force has been created, the sales-force manager may want to reevaluate the size of the sales force. Based on forecasts for sales in the coming year, there may be room to hire more sales people or a need to cut back on the size of the force. If a value is known for expected sales, a formula to determine the breakeven number of employees with no expected profit would be as follows: Breakeven Number of Employees (#) = Sales ($) * [Margin (%) - Commission (%)] / [Salary ($) + Expenses ($) + Bonus ($)] Pipeline Analysis Pipeline analysis is used to keep track of all potential customers and current customers so as to forecast short-term sales and sales-force workload. When salespeople determine that a potential customer could be
- 18. a prospect (known as a suspect) due to their willingness and ability to buy, they need to confirm that the prospect has the authority to make the purchase. A salesperson should take the necessary time when prospecting to verify that the customers they are dealing with can make the purchase decision without additional approval. (Companies should beware of overprospecting. If the incremental contribution a customer is bringing to the company is less than the cost of acquiring that customer, the prospecting is producing a negative result for the salesperson. The salesperson should use the customer lifetime value when making this determination. Trying to increase the pre-purchase numbers is not worthwhile if the numbers down the pipeline do not also rise.) The Funnel A convenient way to forecast sales in the short term and also keep an eye on the sales- force activity is to create a sales funnel, represented graphically by a pipeline of data stored electronically. The concept of the funnel comes from a simple principle: From a large number of possible customers, only a much smaller number will actually make purchases. After each stage of customer interaction, fewer potential customers remain. Keeping track of the number of customers at each stage allows a sales-force manager to balance the workload within the team and make an accurate forecast of not only sales, but salesperson workload in the near future. In order to keep the funnel populated correctly, each salesperson must keep and share records of where all of their potential and current customers are in the purchase process. Aggregated, this information represents a database of sales- force activities. Using assumptions such as historical sales data allows predictions of future sales. For example, if 25% of warm leads are usually converted to sales within two months, the sales manager can -11- UV1417 estimate that 25 of the 100 warm leads present in the sales
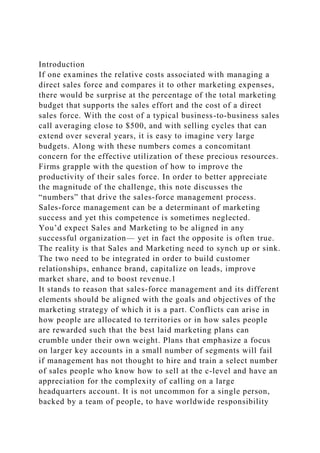
- 19. funnel will be converted to sales within two months. In order to conceptualize what the sales funnel represents, it is helpful to draw a diagram that shows the pipeline of work that a salesperson is dealing with at any one time. It is likely that at any point in the year all phases of the pipeline will have customers. As the diagram illustrates, while there may be a large number of cold and warm leads, the number that actually makes purchases is only a percentage of the original leads. For the exclusive use of S. Gan, 2017. Sales-Force Funnel This document is authorized for use only by Shaohua Gan in Sales Management Fall 2017 taught by Fisher, Matt, San Francisco State University from August 2017 to February 2018. Cold Leads Warm Leads Prospects 1st Meeting 2nd Meeting 3rd Meeting Delivery Support Interest creation This can take the form of activities such as trade shows, direct mail, or advertising, and can also include the sales force actively identifying specific targets to add to the pool of potential customers (generating leads). Cold Lead: A lead that has not specifically expressed interest. These could come from mailing lists, the phone book, business listings (for B2B), etc. Warm Lead: A lead that is expected to be responsive. They may have registered through a Web site or requested product information, for example. Pre-purchase: This stage involves identifying prospects from among cold and warm leads. Typically, initial meetings allow the salesperson to explain product features and benefits, and to cooperate in problem solving with the customer. The desired result is not a sale but the identification of a prospect and the scheduling of another meeting. Prospect: A potential customer who has been identified as a likely buyer, possessing the ability and willingness to buy. This
- 20. includes current customers that will need to make future purchases. Prospecting: A process by which salespeople acquire the information they need to ensure that their prospects and clients will benefit and ensure that they have enough information to make an intelligent sales presentation.18 Purchase: Once a prospect has been identified and commits for additional calls, there will be further contact. In these meetings, more traditional selling occurs—persuading, negotiating, or bidding. If a purchase is agreed upon, the salesperson will close the deal— possibly requiring proposals/contracts/orders. Post-purchase: After purchase, there remains considerable work to be done. This might include delivery of the product or service, installation, collection of payments, training, and ongoing customer support. Once a sales force is able to visualize the different stages represented in the funnel, they will then be able to accurately keep track of their customers and accounts. An electronic solution utilizes a database or spreadsheet. If the file is kept on a shared drive, any member of the sales force can update the data on a regular basis. This also allows the sales manager to view the progress of the team at any point in time. Exhibit 2 is an example of a spreadsheet form of a sales funnel. The manager can then use the information stored in the sales funnel and her/his experience and assumptions to prepare for sales in the near future. Pipeline Analysis is vital when there are possible issues with inventory or concerns that goals are not being met. This can be done manually or through the use of specialized software. The following example illustrates this bottom-up forecasting: ____________________________________ Example: Using the sales funnel above, the number of sales that will need fulfillment in the next five months can be predicted. Historical Averages: · 2% of cold calls are converted to sales in five months · 14% of warm calls are converted to sales in four months
- 21. · 25% of prospects are converted to sales in three months · 36% of customers having a pre-purchase meeting are converted to sales in two months · 53% of customers having a purchase meeting are converted to sales in a month. UpcomingSales=[(56+79)×2%]+[(30+51)× 14%]+[(19+33)×25%]+[(5+16)×36%)]+[(8 +4)×53%]=41 Note: This example is just for one product. Often there could be a need for multiple sales funnels for different products or product lines. Additionally, a sale could apply to a single item or to thousands of items. In the latter case, it would be appropriate to use “Average Sale Size/Customer” for forecasting. ____________________________________ Summary Understanding how a sales force works can be a vital skill for marketers. This note outlines a number of ways of using metrics to inform sales-force decisions. An efficient, well motivated sales force can make a major difference in marketing success.