Downloaded 38 times


![Getting a Trace
From an elevated command prompt:
• Simple trace of system events
o xperf.exe -on latency
o [run scenario]
o xperf.exe -stop -d myscenario.etl
(latency = PROC_THREAD+LOADER+DISK_IO+HARD_FAULTS+DPC+INTERRUPT+CSWITCH+PROFILE)
• Stack-Walking on sample profiling events
o xperf.exe -on latency -stackwalk profile -setprofint 1224
o [run scenario]
o xperf.exe -stop -d myscenario.etl
• IE events
o xperf.exe -on latency -start ie -on Microsoft-IE+Microsoft-IEFRAME+Microsoft-Windows-WinINet+PerfTrack
o [run scenario]
o xperf.exe -stop -stop ie -d myscenario.etl](https://image.slidesharecdn.com/debuggingieperformanceissueswithxperfetwandnavigationtiming-120925094008-phpapp02/85/Debugging-IE-Performance-Issues-with-xperf-ETW-and-NavigationTiming-5-320.jpg)
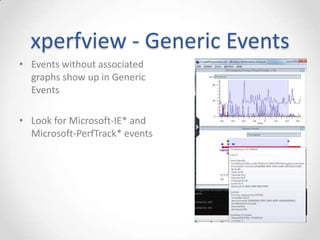
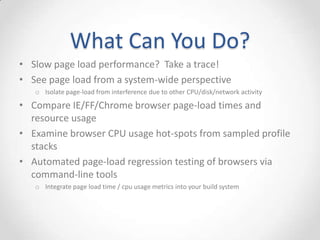

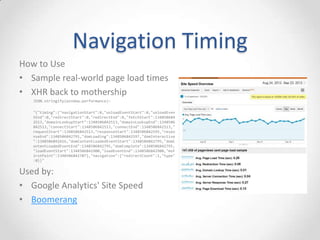


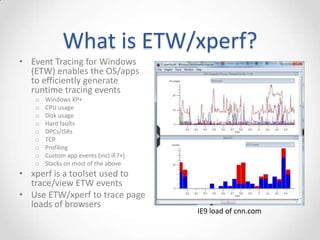
This document discusses using ETW/xperf and Navigation Timing to analyze website performance. It covers: 1) ETW/xperf - tools for capturing system-level event traces on Windows, which can show browser performance events. 2) Navigation Timing API - a W3C spec that provides page load timing metrics via JavaScript for real-world performance monitoring. 3) How to use these tools to analyze page load times, resource usage, and CPU hot spots, both for debugging issues and monitoring performance over time.