
Recommended
Recommended
More Related Content
What's hot
What's hot (19)
Similar to Rr85
Similar to Rr85 (20)
Rr85
- 1. RESEARCH REPORT The Use of Remote Sensing 85 Data for Drought Assessment and Monitoring in Southwest Asia Thenkabail, P. S., Gamage, M. S. D. N. and Smakhtin, V. U. Postal Address P O Box 2075 Colombo Sri Lanka Location 127, Sunil Mawatha Pelawatta Battaramulla Sri Lanka Telephone +94-11 2787404 Fax +94-11 2786854 E-mail iwmi@cgiar.org Website http://www.iwmi.org International Water Management IWMI is a Future Harvest Center I n s t i t u t e SM International ISSN 1026-0862 supported by the CGIAR Water Management IWMI is a Future Harvest Center I n s t i t u t e supported by the CGIAR ISBN 92-9090-575-1
- 2. Research Reports IWMI’s mission is to improve water and land resources management for food, livelihoods and nature. In serving this mission, IWMI concentrates on the integration of policies, technologies and management systems to achieve workable solutions to real problems— practical, relevant results in the field of irrigation and water and land resources. The publications in this series cover a wide range of subjects—from computer modeling to experience with water user associations—and vary in content from directly applicable research to more basic studies, on which applied work ultimately depends. Some research reports are narrowly focused, analytical and detailed empirical studies; others are wide-ranging and synthetic overviews of generic problems. Although most of the reports are published by IWMI staff and their collaborators, we welcome contributions from others. Each report is reviewed internally by IWMI’s own staff and Fellows, and by external reviewers. The reports are published and distributed both in hard copy and electronically (www.iwmi.org) and where possible all data and analyses will be available as separate downloadable files. Reports may be copied freely and cited with due acknowledgment.
- 3. Research Report 85 The Use of Remote Sensing Data for Drought Assessment and Monitoring in Southwest Asia Thenkabail, P. S., Gamage, M. S. D. N. and Smakhtin, V. U. International Water Management Institute PO Box 2075, Colombo, Sri Lanka i
- 4. IWMI receives its principal funding from 58 governments, private foundations, and international and regional organizations known as the Consultative Group on International Agricultural Research (CGIAR). Support is also given by the Governments of Ghana, Pakistan, South Africa, Sri Lanka and Thailand. The authors: Prasad Thenkabail is a Senior Researcher in Remote Sensing; Nilantha Gamage is a Research Officer in Remote Sensing and GIS; and Vladimir Smakhtin is a Principal Scientist in Hydrology and Water Resources, all of the International Water Management Institute, Colombo, Sri Lanka. This study formed part of the Project on Drought Assessment and Mitigation Potential in southwest Asia, funded by the US Department of State through the USAID. This contribution is hereby gratefully acknowledged. Thanks are due to Dr. Hugh Turral (IWMI) for valuable comments and suggestions to an earlier version of this report and to an anonymous external referee for a comprehensive review of the document. Thenkabail, P. S.; Gamage, M. S. D. N.; Smakhtin, V. U. 2004. The use of remote- sensing data for drought assessment and monitoring in Southwest Asia. Research Report 85. Colombo, Sri Lanka: International Water Management Institute. / drought / assessment / data processing / monitoring / remote sensing / Afghanistan / Pakistan / India / Southwest Asia / vegetation indices /drought indices / drought severity / ISBN 92-9090-575-1 ISSN 1026-0862 Copyright © 2004, by IWMI. All rights reserved. Please send inquiries and comments to: iwmi@cgiar.org. ii
- 5. Contents Abbreviations iv Summary v Introduction 1 Data and Methods 3 Results and Discussion 8 Conclusion 22 Literature Cited 23 iii
- 6. Abbreviations AVHRR Advanced Very High Resolution Radiometer DAAC Distributed Active Archive Centers EDC EROS Data Center EROS Earth Resources Observation Systems GIS Geographic Information System GPS Global Positioning System GSFC Goddard Space Flight Center DS Drought Severity (NDVI deviation from long-term mean) ISRO Indian Space Research Organization IWMI International Water Management Institute MIR Mid-Infrared MODIS Moderate-Resolution Imaging Spectro-Radiometer NASA National Aeronautics and Space Administration NDVI Normalized Difference Vegetation Index NESDIS National Environmental Satellite Data and Information System NGDC National Geophysical Data Center NIR Near-Infrared NOAA National Oceanic and Atmospheric Agency NPOESS National Polar Operational Environmental Satellite System NPP NPOESS Preparatory Project TBVI Two Band Vegetation Indices TCI Temperature Condition Index Terra Earth Observing System (EOS) satellite-NASA flagship satellite under Earth System Enterprise VCI Vegetation Condition Index VNIR Visible and Near-Infrared VIIRS Visible and Infrared Imaging Radiometer Suite NRSA National Remote Sensing Agency iv
- 7. Summary Droughts are recurring climatic events, which from year 2000 onwards. The unique feature of often hit South Asia, bringing significant water the study is the development of regression shortages, economic losses and adverse social relationships between drought-related indices consequences. Preparedness for drought should obtained from MODIS and AVHRR data, which form an important part of national environmental have different pixel-resolution and optical charac- policies. At present, countries of the region have teristics. These relationships were established for limited institutional and technical capacity to each month of the year separately, as well as for prepare for a drought and to mitigate its impacts. the pooled data of all months, and explained up Information on drought onset and development is to 95 percent of variability. The relationships were not readily available to responsible agencies and validated in randomly chosen districts outside the to the general public. This report describes the study area. The results ensure the continuity of the first results of the development of the near-real- two data sets and will allow the reports on drought time drought-monitoring and reporting system for development in the region to be made in near-real the region, which includes Afghanistan, Pakistan time with a spatial resolution of 500 meters and at and western parts of India. The system is being 8-day intervals. A continuous stream of MODIS developed using drought-related characteristics data is available free of charge, on the Internet, (indices), which are derived from remote-sensing from the USGS EROS data centre. The opera- data. The indices include a deviation from the tional mode for the MODIS-AVHRR-based drought- normalized difference vegetation index (NDVI) reporting system is currently being developed. The from its long-term mean and a vegetation condi- goal is to make the system available, via Internet, tion index (VCI). to all stakeholders in the region, including govern- The study first investigated the historical ment agencies, research institutions, NGOs and pattern of droughts in the region using monthly the global research community. It may be used as time-step AVHRR satellite data for 1982–1999. a drought-monitoring tool and as a tool for decision Droughts in recent years were studied using 8- support in regional drought assessment and day time-interval MODIS satellite images available management. v
- 8. The Use of Remote-Sensing Data for Drought Assessment and Monitoring in Southwest Asia Thenkabail, P. S., Gamage, M. S. D. N. and Smakhtin, V. U. Introduction Droughts are recurring climatic events, which importantly, difficult to obtain in near-real time. often hit South Asia, bringing significant water In contrast, the satellite-sensor data are shortages, economic losses and adverse social consistently available and can be used to detect consequences. In the last 20 years, increasing the onset of drought, its duration and magnitude population has added to the growing demand for (Thiruvengadachari and Gopalkrishna 1993). water and other natural resources in the region. Even crop yields can be predicted 5 to 13 The latest drought in South Asia (2000–2003) weeks prior to harvests using remote-sensing affected more than 100 million people, with techniques (Ungani and Kogan 1998). severe impacts felt in Gujarat and Rajasthan Vegetative conditions over the world are States in western India, in Pakistan’s Sind and reported occasionally by NOAA National Baluchistan provinces, as well as in parts of Iran Environmental Satellite Data and Information and Afghanistan. Political instability, war and System (NESDIS) using the Advanced Very economic isolation have further exacerbated the High Resolution Radiometer (AVHRR) data effects of drought. (Kogan 2000). The need for proper quantification of drought Drought indicators can be derived for any impacts and monitoring and reporting of drought world region using these data, but the development is of critical importance in politically, characteristic spatial resolution of 10 km (at economically and environmentally sensitive which well-calibrated long-term historical data countries of South Asia. The ability of governments are freely available), is likely to be coarse for in the region and international relief agencies to effective drought monitoring at small scales (a deal with droughts is constrained by the absence of district or a village). A recent successor to reliable data, weak information networks as well as AVHRR is the Moderate-Resolution Imaging the lack of technical and institutional capacities. Spectrometer (MODIS), an advanced narrow- Some countries, like Afghanistan, are just beginning band-width sensor, from which composited to establish relevant drought monitoring and reflectance data are made available at no cost management procedures and institutions. Existing every 8 days by NASA and USGS, through the drought monitoring and declaration procedures Earth Resources Observation Systems (EROS) (e.g., in India) lag behind the development of data center (Justice and Townshend 2002a). drought events. Raw images are available on a daily basis, but Traditional methods of drought assessment their use involves considerable extra processing. and monitoring rely on rainfall data, which are Time series of MODIS imagery provide near- limited in the region, often inaccurate and, most real-time, continuous and relatively high- 1
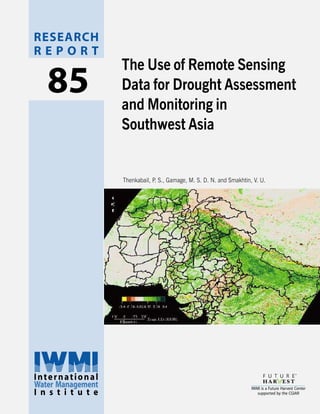
- 9. resolution data, on which the assessment of which could contribute towards drought drought development and severity in regions monitoring are the Vegetation wide-field sensor with scarce and inaccurate on-the-ground on SPOT satellites, and the MERIS sensor on meteorological observations (like southwest Envisat, although neither is available as simply in Asia) could be based. near-real time as MODIS. At present, there is no efficient system in the The primary goal of this study is to develop region to analyze and deliver drought-related methods that allow two generations of sensors information to the stakeholders on the ground. (AVHRR and MODIS) to be combined Only the Indian National Remote Sensing Agency beneficially for a drought assessment and (NRSA) has undertaken drought assessment and monitoring on a regional and a near-real-time reporting since 1986, using Indian satellite basis. A challenge, therefore, is to develop sensors and AVHRR (Thiruvengadachari et al. reliable inter-sensor relationships in order to 1987; Kumar and Panu 1997; Johnson et al. monitor drought continuously, over as long a 1993). The Indian IRS-1C/D wide field sensor time period as possible. This would help (WiFS) could be a strong tool for regional compare the characteristics of the future drought assessment with its spatial resolution of droughts to past events and allow the future 188 m and weekly repeat coverage. However, at drought severity to be interpreted. A reporting present these data and results are available only system should also allow drought development within the Indian space and remote sensing in the region to be monitored at different scales community (Barbosa et al. 2002). It is, of over the entire study area (southwest Asia, course, possible that regional cooperation to figure 1), through to country level and further to combat droughts will result in relevant data the level of individual states, provinces, and sharing between countries, at which point, WiFS smaller administrative subdivisions within data may be put to good use. Other new sensors countries. FIGURE 1. The topographic map of the study area, showing the country boundaries and the boundaries of smaller administrative subdivisions. 2
- 10. Geographically, this study covers Afghanistan, a larger geographical area covering the entire Pakistan and western parts of India. These South Asia from Iran to Bangladesh and from regions/countries are known to be drought-prone, Nepal to Sri Lanka. and socioeconomic studies were, and are still The report first describes the historical and being, conducted here by different government modern-day datasets and their characteristics agencies and NGOs to assess the impacts of the used for drought assessment and reporting. This latest drought and to analyze drought-coping is followed by a description of satellite sensor- strategies of local communities. It was envisaged derived vegetation indices, their derivative that the results of such studies may be utilized in drought indices and thresholds for drought the future to assess the performance of the assessment. The developed inter-sensor drought-monitoring system under development. relationships between AVHRR and MODIS data However, as will be demonstrated in this report, are then described and their use for drought the principles of the system may be expanded to monitoring in the region is demonstrated. Data and Methods AVHRR Data Acquisition and 1982 to 2001. These radiance data were Preprocessing preprocessed by NASA Goddard Space Flight Center (GSFC) and are available at their web The MODIS and its predecessor AVHRR, carried site www.daac.gsfc.gov/data/dataset/AVHRR for on board Terra-Aqua and NOAA-series satellites, free downloading. Preprocessing includes the respectively, are cost-effective sensors, which derivation of maximum value composite (MVC) cover the globe at least once a day. The AVHRR monthly images from original daily radiance data. sensor (Kidwell 1991) collects radiance data in The procedure of deriving monthly MVCs five spectral bands including red visible (0.58–0.6 includes the examination of daily radiance values µm), near-infrared (0.725–1.1 µm), mid-infrared for each wave band, together with NDVI values, (3.55–3.93 µm) and two thermal infrared bands for each month for each pixel. The highest daily (10.3–11.3 µm and 11.5–12.5 µm). Only four radiance/NDVI value in a month is identified and bands, together with the normalized difference retained. This minimizes problems of cloud vegetation index (NDVI, described in the next impacts typical of single-date remote-sensing subsection), are useful for this study (table 1) studies (Goward et al. 1994; Eidenshink and due to unresolved calibration issues with the mid- Faundeen 1994). Data are further corrected for infrared band (Smith et al. 1997). The well- atmospheric attenuation (e.g., dust or haze, calibrated, long-time-series AVHRR radiance data Cihlar et al. 1994), and distortions due to sun o have the spatial resolution of 0.1 (pixels of angle and satellite sensor-view angle (Kogan and approximately 10 X 10 km) and are available Zhu 2001; Flieg et al. 1983; Cracknell 1997; with a monthly step resolution for the period from NGDC 1993). 3
- 11. TABLE 1. Remote sensing data, indices and thresholds relevant to drought assessment used in the study. Drought index Band or index used to Range Normal Severe Healthy compute the index condition drought vegetation AVHRR MODIS 1. Normalized Band 1 Band 1 -1 to +1 Depends on difference (0.58-0.68µm) (0.62-0.67µm) the location -1 +1 vegetation index (NDVI) Band 2 Band 2 (0.73-1.10µm) (0.84-0.87µm) 2. Drought severity NDVI NDVI -1 to +1 0 -1 +1 index ( DEVNDVI ) NDVI long-term NDVI long-term mean mean 3. Vegetation NDVI NDVI 0 to 100 % 50 % 0% 100% condition NDVI long-term NDVI long-term index (VCI) minimum minimum NDVI long-term NDVI long-term maximum maximum 4. Temperature Band 4 no thermal 0 to 100 % 50 % 0% 100% condition (10.3-11.30µm) band in 7 index (TCI) band data Band 4 temp long-term minimum Band 4 temp long-term maximum The preprocessed monthly MVC data were range is scaled to 0 to 255), BT is brightness downloaded from the NOAA GSFS web site and temperature, BRj is band radiance for bands 4 or then converted to four secondary variables (e.g., 5 (j = 4 or 5), TS is surface temperature NDVI), using the procedures described in Smith calculated using split window technique, and T4 et al. (1997) and Rao (1993a, b). These and T5 are the temperatures in AVHRR band T4 variables are a) at ground reflectance and T5, respectively. These conversions are (percentage), b) top of the atmosphere necessary to enable comparisons of brightness temperature (degrees Kelvin), c) measurements made using different sensors. By surface temperature (degrees Kelvin), and d) converting AVHRR data into percent reflectance, NDVI (nondimensional): comparisons can be made with percent reflectance measured from MODIS. Reflectance = (BRi – 10) * 0.002 (1) The converted AVHRR monthly time series for NDVI = (SNDVI – 128) * 0.008 (2) 1982–1999 were used for historical drought BT = (BRj+ 31990)*0.005 (3) analysis, while 2000–2001 data were used for TS = T4 + 3.3 (T4 – T5) (4) regression analysis between AVHRR and MODIS, where, BRi is band radiance for bands 1 or 2 when data from both sensors were available. There (i = 1 or 2), SNDVI is scaled NDVI (since 1 to +1 were 212 images for each band and for NDVI 4
- 12. during 1982–1999 (one MVC for each month, were composed into 2 mega files for the 2000– except for 4 months of missing data in 1994, when 2003 period: a) a file of 1,250 wave bands (45 the satellite failed). For the purpose of further images per year * 7 bands per image * 4 years), analyses, the 1982–1999 data were composed into and b) a file of 180 NDVI layers (45 NDVI layers two mega files. The first file contained 848 layers per year * 4 years). (4 bands, each of 212 months) and the second, While MODIS data are coarser than Indian NDVI data for 212 months. IRS-1C/D WiFS data, the latter are not easily MODIS, a successor of AVHRR, is the available at present, which makes MODIS data primary sensor for monitoring the terrestrial the only feasible candidate for regional drought ecosystem in the NASA Earth Observing System monitoring. There are also a few other issues (EOS) program (Justice et al. 2002) and has that make the use of MODIS data more several advances on AVHRR (table 1). MODIS is attractive. First, the IRS WiFS data come at a more sensitive to changes in vegetation cost, while MODIS data are free. Second, unlike dynamics (Huete et al. 2002) and was found to the IRS WiFS, the most recent MODIS data are be a more accurate and versatile instrument to available within 8 days (in near-real time). Third, monitor the global vegetation conditions than the MODIS Internet data sources have excellent AVHRR (Gitelson et al 1998; Justice et al. 2002). search and browse facilities that are currently not The MODIS sensor acquires data in 36 implemented for IRS WiFS. Fourth, MODIS spectral bands, with variable spatial resolution of products undergo numerous calibrations, 250–1,000 meters (depending on band), in preprocessing and normalizations (e.g., narrow bandwidths and are recorded in 12-bit atmospheric correction) and the data are format. The 36 MODIS bands are a compromise available as processed products (e.g., for atmospheric, land and ocean studies, and reflectance) in contrast to raw digital numbers seven bands are considered optimal for land supplied for WiFS. These capabilities facilitate applications (Justice et al. 2002). Composite multi-date comparisons. MODIS data continuity MODIS data have a temporal resolution of 8 from Terra and Aqua satellites is guaranteed over days and are available from 2000 onwards. The time with successor satellite and sensor systems 8-day, 7-band data are made available by USGS already planned and assured, at least, until 2018, EROS DAAC (similar to the preprocessed with National Polar-Orbiting Operational AVHRR reflectance data by NOAA GSFC), after Environmental Satellite System (NPOESS) series corrections for molecular scattering, ozone of satellites (Justice and Townshend 2002b). absorption and aerosols. The data are also Unlike the MODIS, data continuity plans are not adjusted to nadir (sensor looking straight down) yet announced by the Indian Space Research and standard sun angles, using bidirectional Organization (ISRO). Finally, WiFS has only 2 reflectance (BRDF) models (Vermote et al. 2002; spectral bands, while MODIS has 36, of which 7 Justice et al. 2002). The 7 bands have waveband are considered optimal for land studies (Vermote centers at 648 nm, 858 nm, 470 nm, 555 nm, et al. 2002). 1240 nm, 1,640 nm, and 2,130 nm. All MODIS data are directly downloadable free of charge from the USGS EROS data center Drought-Monitoring Indices (http://edcdaac.usgs.gov). The downloaded data are available as radiance, which needs to be Drought-monitoring indices are derived from divided by 100 to obtain reflectance in percent. AVHRR and MODIS data (table 1). They are For the entire study area (figure 1), MODIS data normally radiometric measures of vegetation 5
- 13. condition and dynamics, exploiting the unique the spectrum) may be defined as NDVI deviation spectral signatures of canopy elements, from its long-term mean (DEVNDVI). This deviation particularly in the red and near-infrared (NIR) is calculated as the difference between the NDVI portions of the spectrum (e.g., Huete et al. 1997, for the current time step (e.g., January 1995) 2002) and are sensitive to vegetation type, and a long-term mean NDVI for that month (e.g., growth stage, canopy cover and structure an 18-year long mean NDVI of all Januaries from (Clevers and Verhoef 1993; Thenkabail 2003). 1982 to 1999) for each pixel: They utilize reflectance data in two or more spectral bands, thus enhancing the vegetation DEVNDVI = NDVIi - NDVImean,m (6) signal and canceling out the effects of topography, sun angle and atmosphere. where, NDVIi is the NDVI value for month i and Normalized Difference Vegetation Index NDVImean,m is the long-term mean NDVI for the (NDVI). NDVI was first suggested by Tucker same month m (e.g., in a data record from 1982 (1979) as an index of vegetation health and to 1999, there are 18 monthly NDVI values for density. the same month, e.g., 18 Aprils), and 12 long- term NDVI means (one for each calendar NDVI = (λNIR – λred) / (λNIR + λred) (5) month). When DEVNDVI is negative, it indicates the below-normal vegetation condition/health and, where, λNIR and λred are the reflectance in the therefore, suggests a prevailing drought situation. NIR and red bands, respectively (table 1). NDVI The greater the negative departure the greater reflects vegetation vigor (Teillet et al. 1997), the magnitude of a drought. In general, the percent green cover, Leaf Area Index (LAI (Baret departure from the long-term mean NDVI is and Guyot 1991) and biomass (Thenkabail et al. effectively more than just a drought indicator, as 2002; Thenkabail et al. 2004). it would reflect the conditions of healthy The NDVI is the most commonly used vegetation in normal and wet months/years. This vegetation index (Jensen 1996). It varies in a indicator is widely used in drought studies (e.g., range of -1 to + 1. However, NDVI a) uses only Johnson et al. 1993). Its limitations are that the two bands and is not very sensitive to influences deviation from the mean does not take into of soil background reflectance at low vegetation account the standard deviation, and hence can cover, and b) has a lagged response to drought be misinterpreted when the variability in (Reed 1993; Rundquist and Harrington 2000; vegetation conditions in a region is very high in Wang et al. 2001) because of a lagged any one given year. vegetation response to developing rainfall deficits Vegetation condition index (VCI). VCI was due to residual moisture stored in the soil. first suggested by Kogan (1995, 1997). It shows Previous studies have shown that NDVI lags how close the NDVI of the current month is to behind antecedent precipitation by up to 3 the minimum NDVI calculated from the long-term months (Justice et al. 1986; Farrar et al. 1994; record. Wang 2000; Wang et al. 2001). The lag time is (NDVIJ-NDVImin ) dependent on whether the region is purely rain- VCIJ = ----------------------------*100 (7) fed, fully irrigated, or partially irrigated (Farrar et (NDVImax – NDVImin ) al. 1994; Wang 2000). The greater the dependence on rainfall the shorter the lag time. where, NDVImax and NDVImin are calculated from NDVI itself does not reflect drought or non- the long-term record (e.g., 18 years) for that drought conditions. But the severity of a drought month (or week) and j is the index of the current (or the extent of wetness, on the other end of month (week). NDVI values are calculated using 6
- 14. equation (5) above. The condition/health of the brightness temperature for this month, BTj, is ground vegetation presented by VCI is measured equal to maximum long-term brightness in percent. The VCI values around 50% reflect temperature for the pixel. Consistently low TCI fair vegetation conditions. The VCI values values over several consecutive time intervals between 50 and 100% indicate optimal or above- may point to drought development/presence. normal conditions. At the VCI value of 100%, the In combination with meteorological NDVI value for this month (or week) is equal to observations, the relationship between surface NDVImax. Different degrees of a drought severity temperature and the moisture regime on the are indicated by VCI values below 50%. Kogan ground will detect drought-affected areas before (1995) illustrated that the VCI threshold of 35% biomass degradation occurs and hence TCI can may be used to identify extreme drought play an important role in drought monitoring. With conditions and suggested that further research is high radiometric and temporal resolution, thermal necessary to categorize the VCI by its severity in infrared data from MODIS allow changes in the range between 0 and 35%. The VCI value surface thermal regime to be more accurately close to zero percent reflects an extremely dry inferred and drought conditions to be more month, when the NDVI value is close to its long- accurately identified. term minimum. Low VCI values over several consecutive time intervals point to drought development. Linking AVHRR and MODIS Data for Temperature condition index (TCI). TCI was Continuous Drought Assessment also suggested by Kogan (1995, 1997) and its algorithm is calculated similar to VCI but its Even though MODIS is a successor to AVHRR, formulation was modified to reflect vegetation’s both sensors and their related data types have response to temperature (the higher the distinctly different features, as was described in temperature the more extreme the drought). TCI relevant sections above (table 1). Apart from this, is based on brightness temperature and the two data sets have other differences represents the deviation of the current month’s including, but not limited to, preprocessing (week’s) value from the recorded maximum. methods (e.g., atmospheric correction) and spatial resolution (10 km for AVHRR versus 0.5 (BTmax – BTj ) TCIJ= -------------------------*100 (8) km for MODIS). To ensure continuous flow of (BTmax – BTmin ) data for drought assessment, inter-sensor relationships are needed. The two data sets where, BT is the brightness temperature (e.g., overlap for the 2-year period from 2000 to 2001. AVHRR band 4). The maximum and minimum This offers the opportunity to explore the values of BT are calculated from the long-term relationships between the two data sets (e.g., (e.g., 18 years) record of remote-sensing images linking NDVIAVHRR with NDVIMODIS). To establish for each calendar month or week j. At the TCI these links, the NDVI values from both sensors of around 50%, the fair or normal temperature were derived for a wide range of land-use and conditions exist. When TCI values are close to land-cover (LULC) classes that included 100%, the brightness temperature for this month, mountains, irrigated areas, rain-fed agricultural BTj, is equal to the long-term minimum brightness lands, rangelands, water bodies, wetlands, temperature for the pixel. Low TCI values (close deserts and mixed LULC types. to 0%) indicate very hot weather in that month or During years 2000 and 2001, there were 19 week. When TCI is equal to zero percent, months (from February 2000 to August 2001) of 7
- 15. concurrent data for both AVHRR and MODIS exhibits a higher dynamic range than sensors. The AVHRR data are monthly, while atmospherically corrected NDVIAVHRR. This is MODIS data have the temporal resolution of 8 attributed to the narrow band width of MODIS days. To make both data sets comparable, the (Huete et al. 2002). The narrow bands result in four 8-day MODIS NDVI images were a greater dynamic range of NDVI for the same composed into 32-day NDVI images through a given biomass. The NDVIAVHRR is therefore likely maximum-value compositing (MVC) procedure. to “saturate” faster in the study of vegetation Then the NDVIAVHRR and NDVIMODIS were biomass than NDVIMODIS, saturation being the calculated for the randomly selected large loss of sensitivity of a sensor after full canopy number of administrative units during the 19- cover is achieved. The study established month long concurrent period. Even for the regression models for two NDVI types for each concurrent period, the NDVIMODIS will not be month (as well as for the pooled data of all 19 exactly the same as NDVIAVHRR due to different months) for all terrestrial biomes in the study sensor characteristics. For example, the area. The established relationships between narrower MODIS spectral bands eliminate the NDVI from two sources allow drought water absorption region in the NIR and also occurrences to be examined across sensors and render the red band more sensitive to time periods from 1982 to the present day, and chlorophyll absorption (e.g., Huete et al. 2002). well into the future. The results of regression Atmospherically corrected NDVIMODIS generally analyses are discussed in the next section. Results and Discussion Historical Drought Interpretation and relative to it, the driest (1987) and the wettest (1993) years’ NDVI values for each The extent of negative deviation of NDVI from its month for the entire study area (shown in figure long-term mean for a pixel, district or region, and 1). Averaging NDVI values over the entire study the duration of continuous negative deviations area was done primarily to illustrate that, overall, are powerful indicators of drought magnitude and the whole region was dry in 1987 or wet in 1993 persistence. Figure 2 shows the long-term normal (figure 2) despite the spatial variability of wetness NDVI conditions (NDVI means for each month) or dryness throughout the region in both years. 8
- 16. FIGURE 2. A monthly NDVI time series for a drought year (1987) and a wet year (1993) compared to the NDVI long-term mean (averaged for the study area). The differences between the long-term NDVI India and eastern Pakistan, with a drought in mean values and the NDVI values in specific Gujarat persisting until December. These results months are the deviations (DEVNDVI) described in match well with the regional drought pattern equation (6) above. A month-by-month spatial studied using rainfall (Sivasami 2000). The distribution of DEVNDVI in the study area during Himalayas, central India and the Indus flood- the dry year of 1987 is illustrated in figure 3, plain/irrigation network areas remain relatively where areas in different shades of yellow are “drought-free” throughout the year. Similar to the “drought-affected” and areas in different shades monitoring of the entire region, the drought of blue are those with a denser, and healthy onset, magnitude and duration/persistence can vegetation. Most of the pixels in the study area be monitored at the scale of a country, any have persistent shades of yellow, indicative of administrative unit level (e.g., vector boundaries the negative deviation from the NDVI mean. It shown in figure 1), or a single pixel level (10 by can be seen how a major drought-affected area 10 km with AVHRR data and 0.5 by 0.5 km with is developing in August–November primarily MODIS) using the series of consecutive over the States of Gujarat and Rajasthan of images. 9
- 17. FIGURE 3. Regional monthly images of DEVNDVI for the drought year of 1987 in the study area. 10
- 18. The biomass levels (measured in terms of two countries. In Pakistan, with its significant NDVI) are normally higher in Pakistan as a irrigation development, NDVI reflects the whole through most of the months when impacts of irrigation on crops and, therefore, on compared with Afghanistan (figure 4). There is the vegetation condition in general. The major also a clear seasonality in biomass fluctuations part of Afghanistan’s vegetation is rain-fed and within and across seasons and years for NDVI follows a predominantly unimodal Afghanistan and Pakistan. The pattern of vegetation condition cycle, determined by fluctuation is however very different between the precipitation. 11
- 19. FIGURE 4. The NDVI variability for Afghanistan and Pakistan over 18 years. Similar patterns of total biomass and its dependent on a combination of water available temporal variability may be traced at smaller for irrigation (from the Indus river) and scales, such as the provinces within Pakistan precipitation. In the Punjab province, a large (figure 5). In arid Baluchistan, the biomass proportion of the area is irrigated, which is magnitude is a clear function of rainfall. In the reflected in higher NDVI values relative to Sindh arid, but partially irrigated, Sindh province, it is and Baluchistan. FIGURE 5. The NDVI variability for three provinces in Pakistan (Punjab, Sindh and Baluchistan). 12
- 20. The variability of three drought-related to the magnitude of the deviation below indices (DEVNDVI, VCI, and TCI) for the period normal. The duration of the successive months 1986–1994 (containing a few successive below normal conditions and the magnitude of droughts) is illustrated in figure 6 using the deviation are two powerful indicators of Afghanistan as an example. The thick black drought severity. In this context, the period line indicates the normal condition of the from January 1986 to June 1990 was vegetation. When an index deviates below the predominantly a continuous drought in line for a few successive months, it points to a Afghanistan, interrupted only by a few wet drought condition. Deviations above the normal months (figure 6). Throughout these years, for a few successive months in a year point to continuously dry conditions prevailed over the better-than-normal vegetation conditions. The country, adversely affecting biomass, livestock magnitude of a drought is directly proportional and agriculture. FIGURE 6. The illustration of the variability of three AVHRR derived drought-related indices for Afghanistan. Similar arguments apply to smaller spatial mid-1990 when drought was severe in rain-fed scales, like Punjab province in Pakistan (figure Afghanistan, the conditions were above-normal in 7). The fluctuation in both VCI and DEVNDVI in irrigated Punjab. This suggests that during irrigation-dominated Punjab is similar to that in severe drought periods, even irrigated areas are the predominantly rain-fed Afghanistan (figure 6). affected, but during years of moderate drought, However, in certain periods, as from mid-1989 to the impacts are limited to rain-fed areas. 13
- 21. FIGURE 7. The illustration of the variability of three AVHRR derived drought-related indices for the Punjab province of Pakistan. In most cases, the VCI and DEVNDVI Validation of Inter-Sensor complement each other and, therefore, strong Relationships correlations should exist between the two (figures 6 and 7). This does not always apply to TCI (figures The established regression relationship between 6 and 7), which often fluctuates differently from concurrent NDVI values of MODIS and AVHRR both VCI and DEVNDVI (e.g., during 1991–1992). at regional scale is given below This can be partially explained by the fact that TCI reflects surface (“skin”) temperature. Wherever NDVIMODIS = 1.0256* NDVIAVHRR + 0.1151 (9) stress or stunted growth of vegetation and crops due to moisture excess occur, the VCI values are This relationship is illustrated in figure 8. low, the DEVNDVI is below normal, but TCI remains The relationships were also developed based on high. For example, this may apply to wetland and/ data from specific months (table 2). The or flooded agriculture. When NDVI is close to its monthly models explain up to 95 percent of long-term minimum and BT close to its long-term variability in the data of two sensors. The maximum (e.g., for example, many months during models presented in equation (9), table 2 and 1988–1991), the continuously low consecutive figure 8 are critical in linking the data from two values of VCI, and DEVNDVI indicate severe drought sensors and facilitating continuous monitoring of (or vegetation stress) conditions. The TCI variability, vegetation conditions, in a drought context, over however, remains inconsistent with that of the other time and well into the future. two indices, which puts a question mark on the utility of a TCI as a drought indicator. 14
- 22. FIGURE 8. Regression relationship between NDVIMODIS and NDVIAVHRR. The regression model is built on the data for 19 months (February 2000 to September 2001) from all administrative units in the study area. TABLE 2. Regression models relating 500-m MODIS NDVI data and resampled 500-m AVHRR NDVI values for individual months. Month Equation R2 January MODIS NDVI (January) = 0.0799 + 1.0868 AVHRR NDVI (January) 0.9189 February MODIS NDVI (February) = 0.0109 + 1.013 AVHRR NDVI (February) 0.9479 March MODIS NDVI (March) = 0.0314 + 1.0357 AVHRR NDVI (March) 0.9528 April MODIS NDVI (April) = 0.0862 + 0.7714 AVHRR NDVI (April) 0.8705 May MODIS NDVI (May) = 0.121 + 0.8217 AVHRR NDVI (May) 0.667 June MODIS NDVI (June) = 0.1152 + 1.0463 AVHRR NDVI (June) 0.7373 July MODIS NDVI (July) = 0.1282 + 1.2181 AVHRR NDVI (July) 0.7494 August MODIS NDVI (August) = 0.0998 + 1.1546 AVHRR NDVI (August) 0.9119 September MODIS NDVI (September) = 0.0672 + 1.2539 AVHRR NDVI (September) 0.9374 October MODIS NDVI (October) = 0.0586 + 1.0949 AVHRR NDVI (October) 0.8913 November MODIS NDVI (November) = 0.1183 + 1.0256 AVHRR NDVI (November) 0.7769 December MODIS NDVI (December) = 0.1664 + 0.823 AVHRR NDVI (December) 0.6354 15
- 23. The limited period of concurrent MODIS and simulated values over 4 districts outside the AVHRR observations (19 months) does not offer study area (76 data points from 19 months of full possibilities for validating these regression test data in 4 districts). For these districts, relationships. However, the validity of the NDVIMODIS values were simulated from AVHRR equations in table 2 and figure 8 could be data using equations from table 2 and then illustrated using independent datasets, from compared with actual NDVIMODIS values. The outside of the study area. NDVIMODIS values results show (figure 10) that the simulated simulated using the established models are NDVIMODIS explained 88 percent variability relative referred to as “simulated NDVIMODIS,” since they to actual NDVIMODIS. were derived from AVHRR. Two arbitrarily Figure 11 compares the spatial distribution selected districts outside the study area (Mathura of actual versus simulated DEVNDVI MODIS for in Uttar Pradesh State, and Ambala in Haryana Afghanistan at the resolution of 500 m X 500 m State, India) are used here for illustration. for 3 (arbitrarily selected) months of the year Figures 9a and b illustrate that there is a clear 2000. The left figure in each row shows the similarity between the observed and simulated actual DEVNDVI MODIS coverage, while the right NDVI values in the two districts. The marginal one shows simulated DEVNDVI MODIS values. differences result from the uncertainties inherent Overall, the comparison of each pair of images in the models (equation 9, table 2). per month (figure 11) reveals clear similarities in A more general accuracy assessment has the NDVI magnitude and spatial distribution. The been done through comparison of “observed” and level of similarity repeats itself for other months. FIGURE 9a. Actual and simulated NDVIMODIS for Mathura district in Uttar Pradesh State, India. 16
- 24. FIGURE 9b. Actual and simulated NDVIMODIS for Ambala district in Haryana State, India. FIGURE 10. Correlation between actual and simulated NDVIMODIS values for 4 districts outside the study area. 17
- 25. FIGURE 11. Spatial distribution of actual and simulated values of DEVNDVI for Afghanistan for 3 (arbitrarily selected) months of the year 2000. Images showing actual DEVNDVI values are in the left column and images showing simulated values are on the right. 18
- 26. Implications for Future Drought • Routine downloads of MODIS 500-m Monitoring land-surface reflectance data from USGS data gateway every 8 or 16 days. The An important implication for a future drought- data are downloaded in “tiles,” six tiles monitoring program is the possibility of combining covering the entire study area. the estimates of maximum, minimum and long- Downloading the data from six tiles takes term mean NDVI values derived from the AVHRR about 5 hours at a speed of 45 kilobytes data with the actual MODIS data. MODIS data per second. The downloaded data for one have so far only a “short life” (2000 to the date for the entire study area occupy present) and the long-term estimates of three approximately a gigabyte of disk space. If mentioned NDVI drought characteristics (DEVNDVI, a similar system is to be reproduced for a VCI, TCI) at the MODIS level of spatial resolution specific country in the region, the time are missing. The equations in table 2 may be and space requirements could be less. used to estimate 500-m MODIS characteristics • The downloaded data need to be from the available AVHRR data. Therefore, the processed using the commercially required minimum, maximum and long-term NDVI available ERDAS software package. mean values may be estimated at the finer scale Other packages are also available, but and, consequently, DEVNDVI and VCI estimates ERDAS was found to be the most may be made available at this scale (500-m efficient processing tool. All raw resolution). As the MODIS NDVI data “build up” downloaded data are imported into with time, long-term NDVI characteristics can be ERDAS and re-projected into geographic determined directly from the MODIS data. latitude and longitude coordinates, using Therefore, the advantage may be made of facilities provided by ERDAS. complementary features of both types of data, where MODIS data form the basis on which to • The re-projected data of all six tiles are develop a prototype for a near-real-time drought combined into one file covering the entire monitoring system at the scale of a country, study area (the procedure known as state, district or pixel with an 8– or 16–day time “mosaicking”). This is followed by the interval. The results described feed directly into calculation of NDVI values for each pixel the development of the regional drought- in the study area, using equation (5). The monitoring system. The prototype monitoring “NDVI file” is stored as part of the array system is currently being set up on the Internet of similarly processed images for and will include the facilities to explore drought- previous dates. Thus preprocessed data related characteristics (DEVNDVI and VCI), form the time series of images, which are averaged at the level of districts and other small then used for continuous drought administrative subdivisions in three countries. monitoring. The fully functional system will eventually allow • Formulae (6) and (7) are used to these characteristics to be examined at the pixel calculate current VCI and DEVNDVI for level (0.5 by 0.5 km) and for different types of each pixel from NDVI data. Long-term land uses, including rain-fed and irrigated areas, means, maxima and minima, required to mountainous areas, rangelands and deserts. The calculate these indices for each pixel, are common steps involved in the maintenance of obtained using relationships listed in table the system will include the following: 2. Current drought-related vegetation indices can be averaged for all pixels 19
- 27. over a district, state or country. However, sensing information exclusively. For this, the the information is obviously most DEVNDVI and VCI values of all 0.5 X 0.5 km valuable at the fine resolution, pixels or pixels in each district of Rajasthan and Gujarat districts, in the current setup. Subdistrict were averaged for the latest MODIS image in administrative divisions (e.g., talukas, each month. Thus one monthly value of DEVNDVI tensils) can be incorporated into the and one monthly value of VCI per district were system as well. calculated. The next step was to calculate the number of districts in each state per each month, • The user of the system will be able to where monthly indices were below the drought interactively select the required district thresholds. For the DEVNDVI the threshold was 0.0 and display the land-use coverage, the and for VCI, where two thresholds were used, it VCI and DEVNDVI coverages and the time was 50% and 35%. The first VCI threshold is series graph, showing the long-term normally perceived as the one below which the mean NDVI for each month of the year, vegetation starts to lose its vigor, which is the and the current NDVI time series. The first indication of an emerging drought. The start of the plotting period can be second VCI threshold may be perceived as the interactively selected. beginning of a severe drought (Kogan 1995). • Categorization of the drought severity In Gujarat, in the month of drought based on the available data is being declaration (October 2002), the number of developed. It is also planned to include districts, which had their averaged indices values short reports, which interpret current below the selected thresholds (VCI50, VCI35 and drought conditions in a lucid format. DEV NDVI) were 14, 10 and 17, respectively. In An operational drought-monitoring system the previous month of September 2002, the could positively impact the efficiency of existing corresponding numbers were 6, 1 and 9, drought policies and declaration procedures. This indicating that the state was already moving into can be illustrated using the example of the most a drought (although only one district was found recent drought of 2002, which severely hit to be under severe drought conditions). Rajasthan and Gujarat States of India. The In Rajasthan, in the month of drought recent publication of the Department of declaration (July 2002), the number of districts, Agriculture and Cooperation (2004) reviews, which had their averaged indices’ values below amongst the others, the events that occurred in the selected thresholds (VCI50, VCI35 and each state during the drought of 2002. At the DEVNDVI), were 21, 18 and 18, respectively. But end of July 2002, on the basis of ground in the previous months of May and June, the observations on rainfall and the conditions of number of districts with index values below any crops, the Government of Rajasthan declared of the three thresholds was always, at least, 16 that droughts hit all 27 districts of the state. with May showing all 27 districts as drought-hit in Similarly, in the middle of October 2002, the terms of all thresholds. As an example, figure 12 Government of Gujarat declared that droughts hit illustrates the distribution of the VCI values over 14 out of the 20 districts of the state. Rajasthan (the district boundaries are shown in MODIS images for several successive black) from May to October. The low VCI values months from the beginning of 2002 were dominated over the state since May 2002 and analyzed to establish how many districts could became extremely low by October. have been identified as drought-hit using remote- 20
- 28. FIGURE 12. Spatial distribution of the VCI values over the State of Rajasthan, India, during the drought of 2002. While such assessment is very crude due to actual declaration dates in both states. A more averaging of pixel values by district, no detailed evaluation of the remote-sensing data distinction was made between rain-fed and (e.g., against rainfall and/or ground observations irrigated areas, and this remote-sensing on crop density) in different parts of the region is information would effectively allow drought onset certainly necessary before predictions based on to be predicted 2 months in advance of the such data can be used reliably in drought 21
- 29. mitigation. The categorization of the VCI severity will allow droughts to be predicted earlier, their values below 50% should also be carried out impact areas to be delineated more accurately (currently, these validations and categorizations and their impacts on crops diagnosed before are being conducted). Enhancement of the harvest. This should eventually contribute to the drought-monitoring system with these features food security in the region. Conclusions The report suggested methods and techniques reliable relationships between NDVI values for continuous drought monitoring by linking derived from both sensors and created the historical AVHRR sensor data with modern day options for the enhancement of existing free MODIS sensor data. The methodology was remote-sensing data. The best option tested for a study area in southwest Asia, which incorporates the long-term NDVI characteristics includes Afghanistan, Pakistan and two states in calculated from AVHRR into MODIS at 500-m western India. spatial resolution. This option is particularly The results indicate that out of the three attractive for the future drought monitoring, as it remote-sensing indices used, DEVNDVI, and VCI will have all the advantages of the better are complementary and were found to be MODIS technology. The availability of MODIS sensitive indicators of drought conditions. data is guaranteed at least till 2018, with However, TCI was found to be an unreliable continuity missions planned with its successors indicator for drought assessment and is not NPP and NPOESS. Therefore, the AVHRR- recommended for future drought monitoring. MODIS-NPP-NPOESS data sets may effectively The development of new indices, which could form one continuous data stream from 1982 to be used for drought monitoring, was not part of 2018, and possibly beyond. This would make it this particular study, and earlier suggested the single largest source of spatial data indices (NDVI and VCI) are used. Both are available for the South Asia region (and for the based on the same two thermal channels out of entire globe). the available seven (in MODIS). The alternative The results of this study are being used for channels however suggest a possibility to explore the development of a regional drought- and possibly develop more effective indices, monitoring system. Considering the spread and which could be better indicators of drought frequency of droughts in the region on the one conditions. This could be an interesting direction hand, and the lack of ground climate for future research. observations and technical capacity in the The study established and validated countries of the region to deal with droughts on methods and techniques of drought assessment the other, such a system could play an invaluable across two different sensors. It established role for drought preparedness. 22
- 30. Literature Cited Barbosa, P.; San-Miguel-Ayanz, J.; Martinez, B.; Schmuck, G. 2002. Burnt area mapping in southern Europe using IRS- WiFS. In Forest fire research & wildland fire safety, ed. X. Viegas. Millpress, Rotterdam: ISBN 90-77017-72-0. Baret, F.; Guyot, G. 1991. Potentials and limits of vegetation indices for LAI and APAR assessment. Remote Sensing of Environment 35:161–173. Cihlar, J.; Manak, D.; D’Iorio, M. 1994. Evaluation of compositing algorithms for AVHRR data over land. IEEE Trans. Geosciences Remote Sensing 32: 427–437. Clevers, J. G. P. W.; Verhoef, W. 1993. LAI estimation by means of the WDVI: A sensitivity analysis with a combined PROSPECT-SAIL model, Remote Sensing of Environment 7: 43–64. Cracknell, A. P. 1997. The advanced very high resolution radiometer. London: Taylor and Francis. Department of Agriculture and Cooperation. 2004. Drought-2002: States report. Part 2 (Volumes 1-4). New Delhi, India: Ministry of Agriculture, Government of India. Eidenshink, J. C.; Faundeen, J. L. 1994. The 1-km AVHRR global land data set: First stages in implementation. International Journal of Remote Sensing 15: 3443–3462. Farrar, T. J.; Nicholson, S.E.; Lare, A.R. 1994. The influence of soil type on the relationships between NDVI, rainfall, and soil moisture in semiarid Botswana. II. NDVI response to soil moisture. Remote Sensing of Environment 50: 121– 133. Fleig, A. J.; Heath, D. F.; Klenk, K. F.; Oslik, N.; Lee, K. D.; Park, H.; Bartia, P. K.; Gordon, D. 1983. User’s guide for the Solar Backscattered Ultraviolet (SBUV) and the Total Ozone Mapping Spectrometer (TOMS) RUT-S and RUT-T data Sets. October 31, 1978 to November 1980. NASA Reference Publication 1112. Gitelson. A.A.; Yoram, J.; Kaufman, Y.J. 1998. MODIS NDVI optimization to fit the AVHRR data series—Spectral considerations: Short communication. Remote Sensing of Environment 66:343–350. Goward, D. G.; Turner, S.; Dye, D. G.; Liang, J. 1994. University of Maryland improved Global Vegetation Index. International Journal of Remote Sensing 15:3365–3395. Huete, A. R.; Liu, H. Q.; Batchily, K.; van Leeuwen, W. 1997. A comparison of vegetation indices over a global set of TM images for EOS-MODIS. Remote Sensing of Environment 59: 440–451. Huete, A.; Didan, K.; Miura, T.; Rodriguez, E. P.; Gao, X.; Ferreira, L. G. 2002. Overview of the radiometric and biophysical performance of the MODIS vegetation indices. Remote Sensing of Environment 83: 195–213. Jensen, J. R. 1996. Introductory digital image processing: A remote sensing perspective. Upper Saddle River, New Jersey: Prentice Hall. Johnson, G. E.; Achutuni, V. R.; Thiruvengadachari, S.; Kogan, F. N. 1993. The role of NOAA satellite data in drought early warning and monitoring: Selected case studies. Chapter 3. In Drought assessment, management, and planning: Theory and case studies, ed. D. A. Wilhite, 31-48. New York, NY: Kluwer Academic Publishers. Justice, C.O.; Holben, B. N.; Gwynne, M. D. 1986. Monitoring East African vegetation using AVHRR data. International Journal of Remote Sensing 7: 1453–1474. Justice, C.; Townshend, J. 2002a. Special issue on the moderate resolution imaging spectroradiometer (MODIS): A new generation of land surface monitoring. Remote Sensing of Environment 83: 1–2. Justice, C. O.; Townshend, J. R.G. 2002b. Towards operational monitoring of terrestrial systems by moderate-resolution remote sensing. Remote Sensing of Environment 83: 351–359. Justice, C.O.; Townshend, J.R.G.; Vermote, E. F.; Masuoka, E.; Wolfe, R. E.; Saleous, N.; Roy, D. P.; Morisette, J. T. 2002. An overview of MODIS land data processing and product status. Remote Sensing of Environment 83: 3–15. 23
- 31. Kidwell, K. 1991. NOAA polar orbiter data user’s guide. Washington, D.C.: National Climatic Data Center. Kogan, F. N. 1995. Droughts of the late 1980s in the United States as derived from NOAA polar orbiting satellite data. Weather in the United States. Bulletin of American Meteorological Society 76: 655–668. Kogan, F. N. 1997. Global drought watch from space. Bulletin of American Meteorological Society 78:621–636. Kogan, F. N. 2000. Contribution of remote sensing to drought early warning. In Early warning systems for drought preparedness and drought management, ed. D.A. Wilhite and D.A. Wood. 75–87. Geneva: World Meteorological Organization. Kogan, F. N.; Zhu, X. 2001. Evolution of long-term errors in NDVI time series: 1985–1999. Advances in Space Research 28: 149–153. Kumar, V.; Panu, U. 1997. Predictive assessment of severity of agricultural droughts based on agro-climatic factors. Journal of the American Water Resources Association 96062. 33: 1255–1264. NGDC (National Geophysical Data Center). 1993. 5 minute gridded world elevation. NGDC data annoucement DA 93- MGG-01. Boulder. Rao, C. R. N. 1993a. Nonlinearity corrections for the thermal infrared channels of the Advanced Very High Resolution Radiometer: Assessment and recommendations. NOAA Technical Report NESDIS-69. Washington, D.C.: National Oceanic and Atmospheric Agency/NESDIS National Environmental Satellite Data and Information System. Rao, C. R. N. 1993b. Degradation of the visible and near-infrared channels of the Advanced Very High Resolution Radiometer on the NOAAP9 spacecraft: Assessment and recommendations for corrections. NOAA Technical Report NESDIS-70. Washington, D. C.: National Oceanic and Atmospheric Agency/National Environmental Satellite Data and Information System. Reed, B. C. 1993. Using remote sensing and Geographic Information Systems for analyzing landscape/drought interaction. International Journal of Remote Sensing 14: 3489–3503. Rundquist, B. C.; Harrington, Jr., J. A. 2000. The effects of climatic factors on vegetation dynamics of tallgrass and shortgrass cover. GeoCarto International 15: 31–36. Sivasami, K.S. 2000. Drought and rainfall pattern, 1877–1999. Economic and Political Weekly. Pp. 1991-1992. Smith, P. M.; Kalluri, S. N. V.; Prince, S. D.; DeFries, R. S. 1997. The NOAA/NASA Pathfinder AVHRR 8-km land data set. Photogrammetric Engineering and Remote Sensing 63: 12–31. Teillet, P. M.; Staenz, K.; Willams, D. J. 1997. Effects of spectral, spatial, and radiometric characteristics on remote sensing vegetation indices of forested regions. Remote Sensing of Environment 61: 139–149. Thenkabail, P. S. 2003. Biophysical and yield information for precision farming from near-real-time and historical Landsat TM images. International Journal of Remote Sensing 24: 839–877. Thenkabail, P.S.; Enclona, E.A.; Ashton, M. S.; Legg, C.; Jean De Dieu, M. 2004. Hyperion, IKONOS, ALI, and ETM+ sensors in the study of African rainforests. Remote Sensing of Environment 90: 23–43. Thenkabail, P. S.; Smith, R. B.; De-Pauw, E. 2002. Evaluation of narrowband and broadband vegetation indices for determining optimal hyperspectral wavebands for agricultural crop characterization. Photogrammetric Engineering and Remote Sensing 68: 607–621. Thiruvengadachari, S.; Gopalkrishna, H. R. 1993. An integrated PC environment for assessment of drought. International Journal of Remote Sensing 14:3201–3208. Thiruvengadachari, S.; Prasad, T. S.; Harikishan, J. 1987. Satellite monitoring of agricultural drought in Anantapur district in Andhra Pradesh State. Report No.: RSAM - NRSA - DRM - TR - 03/87. India: Drought Mission Team, Department of Space, Government of India. pp. 35. 24
- 32. Tucker, C. J. 1979. Red and photographic infrared linear combinations for monitoring vegetation. Remote Sensing of Environment 8:127–150. Ungani, L.S.; Kogan, F. N. 1998. Drought monitoring and corn yield estimation in southern Africa from AVHRR data. Remote Sensing of Environment 63:219–232. Vermote, E. F.; Saleous, El; Justice, N.Z. 2002. Atmospheric correction of MODIS data in the visible to middle infrared: first results. Remote Sensing of Environment 83: 97–111. Wang, J. 2000. Relations between productivity, climate, and Normalized Difference Vegetation Index in the central Great Plains. Lawrence: University of Kansas (Ph.D. Dissertation). Wang, J.; Price, K. P.; Rich, P. M. 2001. Spatial patterns of NDVI in response to precipitation and temperature in the central Great Plains. International Journal of Remote Sensing 22: 3827–3844. 25
- 33. Research Reports 72. Development Trajectories of River Basins: A Conceptual Framework. François Molle. 2003. 73. A Method to Identify and Evaluate the Legal and Institutional Framework for the Management of Water and Land in Asia: The Outcome of a Study in Southeast Asia and the People's Republic of China. Ian Hannam. 2003. 74. A Diagnostic Model Framework for Water Use in Rice-based Irrigation Systems. Wilfried Hundertmark and Ali Touré Abdourahmane. 2004. 75. Prospects for Adopting System of Rice Intensification in Sri Lanka: A Socioeconomic Assessment. Regassa E. Namara, Parakrama Weligamage and Randolph Barker. 2004. 76. Small Dams and Social Capital in Yemen: How Assistance Strategies Affect Local Investments and Institutions. Douglas L. Vermillion and Said Al-Shaybani. 2004 77. Simulating the Hydrology of Small Coastal Ecosystems in Conditions of Limited Data. V. U. Smakhtin, S. C. Piyankarage, P. Stanzel and E. Boelee. 2004. 78. Irrigation Kuznets Curve, Governance and Dynamics of Irrigation Development: A Global Cross-Country Analysis from 1972 to 1991. Madhusudan Bhattarai. 2004. 79. Strategic Analysis of Water Institutions in India: Application of a New Research Paradigm. R. Maria Saleth. 2004. 80. Robbing Yadullah’s Water to Irrigate Saeid’s Garden: Hydrology and Water Rights in a Village of Central Iran. François Molle, Alireza Mamanpoush and Mokhtar Miranzadeh. 2004. 81. Inadequacies in the Water Reforms in the Kyrgyz Republic: An Institutional Analysis. Mehmood Ul Hassan, Ralf Starkloff and Nargiza Nizamedinkhodjaeva. 2004. 82. Valuing Nutrients in Soil and Water: Concepts and Techniques with Examples from IWMI Studies. Pay Drechsel, Mark Giordano and Lucy Gyiele. 2004. 83. Spatial Variation in Water Supply and Demand across River Basins of India. Upali A. Amarasinghe, Bharat R. Sharma, Noel Aloysius, Christopher Scott, Vladimir Smakhtin and Charlotte de Fraiture. 2004. 84. An Assessment of Small-Scale User's Inclusion in Large-scale Water User Associations of South Africa. Nicolas Faysse. 2004. 85. The Use of Remote Sensing Data for Drought Assessment and Monitoring in Southwest Asia. P. S. Thenkabail, M. S. D. N. Gamage and V. U. Smakhtin. 2004.
- 34. RESEARCH REPORT The Use of Remote Sensing 85 Data for Drought Assessment and Monitoring in Southwest Asia Thenkabail, P. S., Gamage, M. S. D. N. and Smakhtin, V. U. Postal Address P O Box 2075 Colombo Sri Lanka Location 127, Sunil Mawatha Pelawatta Battaramulla Sri Lanka Telephone +94-11 2787404 Fax +94-11 2786854 E-mail iwmi@cgiar.org Website http://www.iwmi.org International Water Management IWMI is a Future Harvest Center I n s t i t u t e SM International ISSN 1026-0862 supported by the CGIAR Water Management IWMI is a Future Harvest Center I n s t i t u t e supported by the CGIAR ISBN 92-9090-575-1