Achieving and Ensuring Business Process Acceptance for Systems and Software Engineering and Management
•
0 likes•85 views

Değerli, M. and Özkan, S. (2014). Achieving and Ensuring Business Process Acceptance for Systems and Software Engineering and Management. In Business Performance Measurement and Management. Cambridge Scholars Publishing, UK. ISBN- 13: 978-1443861397 - ISBN-10: 1443861391 - https://www.google.com/books/edition/_/5yxQBwAAQBAJ

Recommended
Recommended
More Related Content
What's hot
What's hot (12)
Similar to Achieving and Ensuring Business Process Acceptance for Systems and Software Engineering and Management
Similar to Achieving and Ensuring Business Process Acceptance for Systems and Software Engineering and Management (20)
More from Dr. Mustafa Değerli
More from Dr. Mustafa Değerli (20)
Recently uploaded
Recently uploaded (20)
Achieving and Ensuring Business Process Acceptance for Systems and Software Engineering and Management
- 1. CHAPTER THIRTEEN ACHIEVING AND ENSURING BUSINESS PROCESS ACCEPTANCE FOR SYSTEMS AND SOFTWARE ENGINEERING AND MANAGEMENT MUSTAFA DEGERLI AND SEVGI OZKAN Abstract Business processes related to systems and software engineering and management business practices are truly invaluable assets for organisations developing or acquiring systems and software. However, unless business processes are accepted by employees in organisations and implemented to achieve targeted cost, quality, scope and schedule objectives for projects, all efforts for business processes are going to be nothing more than wasting time, effort, and money. Hence, in organisations, employees’ acceptance of business processes is crucial and required. To address this issue, a model for the acceptance of business processes by employees was developed. A questionnaire was designed to collect data from people having interaction with certain process-focused models and standards used for the improvement of systems and software engineering and management business processes. After reviews, refinements, and piloting, the questionnaire was distributed, and 368 usable responses collected. Principally, the partial least squares structural equation modelling (PLS SEM) approach was applied. Thereafter, the model was developed with 18 imperative factors and their statistically significant relationships. A checklist was drawn up to test and promote the acceptance of business processes. Both the model and pertinent checklist might prove truly beneficial for business process definition, deployment, implementation, and maintenance activities related to systems and software engineering and management. This chapter provides details for
- 2. Achieving and Ensuring Business Process Acceptance for Systems 293 the development of the model, explanation and practical interpretation of the model, and the pertinent checklist. 13.1 Introduction 13.1.1 Background and Statement of the Problem Many research studies have been conducted in an attempt to explain the factors that influence the acceptance of a variety of subjects or technologies with a variety of models and theories on the subject of people’s acceptance of new systems and software. For instance, Rogers’s (2003) innovation diffusion theory (IDT); Fishbein and Ajzen’s (1975) theory of reasoned action (TRA); Davis’s (1989) technology acceptance model (TAM); Thompson, Higgins, and Howell’s (1991) model of personal computer utilisation (MPCU); Davis, Bagozzi, and Warshaw’s (1992) motivational model (MM); Ajzen’s (1991) theory of planned behaviour (TPB); Taylor and Todd’s (1995) combined TAM-TPB, Compeau and Higgins’s (1995) social cognitive theory (SCT) application; Venkatesh and Davis’s (2000) technology acceptance model 2 (TAM 2); Venkatesh et al.’s (2003) unified theory of acceptance and use of technology (UTAUT) model; and Venkatesh and Bala’s (2008) technology acceptance model 3 (TAM 3). The models listed above are the main models and theories exploited and employed to understand and explain the acceptance by people of a variety of subjects, systems or technologies designed for certain contents and contexts. Dillon and Morris (1996) defined user technology acceptance as the demonstrable willingness of users to employ information technology (IT) for the tasks that it is intended to support. Dillon and Morris claimed that for acceptance, the demonstrable willingness of users to use related systems must be achieved and ensured. Furthermore, they noted that every acceptance process for its envisioned purposes can be modelled and predicted. In this context, Davis (1993) suggested that acceptance is the key factor that determines whether a project or system is successful or not. Projects or systems are going to be useless or meaningless unless they are accepted by the intended users for the intended purposes. Identifying interventions influencing the acceptance and use of new projects or systems can help managerial decision making on effective enactment strategies (Jasperson, Carter, & Zmud, 2005). Therefore, managers or responsible people must develop and implement effective interventions with the aim of taking full advantage of employees’ acceptance and use of
- 3. Chapter Thirteen 294 the designated systems or contexts. Acceptance matters because it will govern the success of the systems directly. Organisations are constantly interested in standards and models based on business processes for the purpose of achieving their strategic goals and objectives and in order to ensure anticipated schedules and cost performances, product quality, return on investment and other measures of performance outcomes. In the technology environment of the 21st century, organisations are required to build and deliver ever more complex products and services better, faster and cheaper for the customers. Generally, components of a product or service are not developed by a single unit of an organisation or by a single company; rather, some parts are built internally and other parts are acquired from different units or companies. Then, all the parts are integrated into the ultimate and absolute product or service. In such settings and circumstances, organisations are required to manage and control this complex development and maintenance process to survive and provide products or services for their customers (Chrissis, Konrad, & Shrum, 2006). To achieve the best out of the productivity of people and maximise the use of technology to be more competitive in order to deal with an ever- changing world, a focus on process (process-focus) delivers the expected groundwork. The manufacturing industry has acknowledged the importance of process effectiveness and efficiency and the benefits of a process-focus for many years (Chrissis et al., 2006). An integrated approach is required for organisations providing enterprise-wide solutions. Therefore, organisational assets are commendably managed via an integrated approach for business success. Happily, maturity models, standards, methodologies and guidelines are there for these organisations to improve the way they do business in such settings. The Software Engineering Institute (SEI) of Carnegie Mellon University (CMU) claimed that people, procedures and methods, and tools and equipment are the three critical dimensions that organisations typically use to come to grips with and improve their businesses with the purpose of developing and maintaining quality products and services. These three core and critical dimensions are kept together by means of business processes. Business processes are there in order to align the way for doing business, address scalability and provide a way to integrate knowledge of how to improve doing things, leverage resources and examine business trends (Chrissis et al., 2006; Garcia & Turner, 2006). The process management principle “the quality of a system or product is highly influenced by the quality of the process used to develop and maintain it” (CMMI Product Team, 2010, p. 5) has been taken by the SEI
- 4. Achieving and Ensuring Business Process Acceptance for Systems 295 of CMU, and the belief in this evidence is appreciated worldwide in quality movements, as demonstrated by the body of standards of the International Organization for Standardization/International Electrotechnical Commission (ISO/IEC) (Chrissis et al., 2006). The acceptance of business processes is invaluable and vital. Obviously, there is an imperative to elicit, determine and explain the major and prominent factors influencing the acceptance of business processes especially in systems and software engineering and management contexts. 13.1.2 Evolution of the Research We started with the literature review on the subjects of acceptance and business processes. After reviewing relatable literature, we defined constructs and formed hypotheses for the acceptance of business processes content and context for systems and software product delivery or acquiring organisations. This step was tailed by model development and proposal. After proposing the model, we developed the instrument (questionnaire). Throughout and after development of the instrument, content validity of the instrument was assessed. This step was followed by granting ethical permission to deploy the questionnaire. After obtaining the ethical permission for deployment, we deployed the instrument and collected some data for pilot study. Subsequent to this step, the data collected for the pilot study was analysed, and thereafter, the questionnaire was deployed and data collected for the main study. Collected data for the whole study were analysed using descriptive statistics. After descriptive statistics analyses, we screened the entire data set for incorrectly entered data, missing data, outliers and normality. Then, reliability of the instrument was tested based on the collected data. We principally used the partial least squares structural equation modelling (PLS SEM) approach. In this context, after ensuring the reliability and validity of the data, we applied the exploratory factor analysis (EFA). The EFA was followed by the confirmatory factor analysis (CFA). Subsequent to applying the CFA, we estimated and evaluated a model (initial). Subsequent to first estimation and evaluation, we modified the model. The modified model was again subjected to the CFA. After this CFA, we again estimated and evaluated another model (modified final). Finally, we documented all statistically significantly meaningful and distilled conclusions for the acceptance of business processes in systems and software engineering and management content and context.
- 5. Chapter Thirteen 296 13.2 Literature Review 13.2.1 Prominence of the Acceptance, and Models and Theories for Acceptance IT or information systems (IS) projects are going to be useless and meaningless unless they are accepted by the intended users for the intended purposes. Identifying the interventions influencing the acceptance and use of new IT can help managerial decision making on effective IT enactment strategies (Jasperson et al., 2005). Therefore, managers or responsible people must develop and implement effective interventions with the aim of taking full advantage of employees’ acceptance and use for the designated systems or contexts. Acceptance truly matters because governs the success of systems directly. Models and theories that try to explain and shape the technology acceptance (TA) process and its characteristics exist. For instance, IDT includes five characteristics of a technology that determine IT or IS TA (Rogers, 1995). These characteristics are trialability, complexity, compatibility, relative advantage and observability. As suggested by Rogers, with the proviso that these five concerns are taken seriously and managed well, related IT or IS are accepted by intended users when aimed at intended purposes. In addition, Davis’s (1989) TAM, Ajzen’s (1991) TPB, Venkatesh and Davis’s (2000) TAM 2, and Venkatesh et al.’s (2003) UTAUT are the models in the literature, customarily used to design, implement and test the TA of IT or IS. Of these models, the most commonly cited one is the Davis’s (1989) TAM. Davis’s work not only provides a major contribution to the TA literature, but the model is used as a reference by many other studies. The TAM of Davis (1989) predicts that TA of any IT is determined by two factors. These are perceived ease of use (PEOU) and perceived usefulness (PU). PEOU can be expressed as a degree to which the users consider that using a system or project will be easy and stress-free. PU can be expressed as the degree to which users consider that using a system or project will improve performance for its intended purposes. In accordance with TAM, both PU and PEOU have major effects on a user’s attitude toward using IT and determining its TA. There is also TAM 2 by Venkatesh and Davis (2000), which extends the first TAM. Recently, there is still another technology acceptance model by Venkatesh and Bala (2008). This extended model, called TAM 3, added new constructs to the TAM 2 to broaden and clarify the PU aspect of the TAM 2.
- 6. Achieving and Ensuring Business Process Acceptance for Systems 297 13.2.2 Significance of Business Processes Business processes are a set of organised activities for transforming inputs into outputs with the purpose of accomplishing a prearranged aim (CMMI Product Team, 2010). Having many technological and infrastructural facilities and opportunities in the 21st century, organisations are required to build and deliver ever more multifaceted products or services that are improved, quicker, and economical. Generally, components of a product or service are not developed by a single unit of an organisation or by a single organisation; rather some parts are built internally, other parts are acquired from different units or organisations, and then the integration is performed to produce and realise the ultimate and absolute products or services. In such settings and circumstances, organisations are required to cope with and regulate these multifarious and composite development and maintenance processes to survive and provide products or services for their customers (Chrissis et al., 2006). Shewhart (1931) began working in business process improvement using principles of statistical quality control to discover more about the quality factors and their statistical relationships. After Shewhart, these principles were refined by Crosby (1979), Deming (1986), and Juran (1988), according to the CMMI Product Team, (2010). To achieve the best out of personnel productivity and throughputs and make best use of the use of technology and systems with the aim of being more competitive in order to deal with an ever-changing world and sector realities, a focus on process (process-focus) delivers the expected groundwork. In the manufacturing industry, the importance of business process effectiveness and efficiency and the benefits of process-focus have been acknowledged for many years (Chrissis et al., 2006). An integrated approach is required for organisations providing enterprise-wide solutions. Therefore, organisational assets are commendably managed via an integrated approach for business success. Maturity models, standards, methodologies and guidelines are there for these organisations to improve the way they do business in such settings. The CMU’s SEI claimed that there are three critical dimensions that organisations typically must master to improve their businesses for the purposes of developing and maintaining quality products and services. These are simply procedures and methods, people, and tools and equipment. However, these three core and critical dimensions are kept together by means of business processes. Business processes exist with the aim of aligning the manner for doing business; providing and ensuring scalability; ensuring a method to incorporate the understanding of how to do things better-quality and value-added to weight staff, infrastructure and
- 7. Chapter Thirteen 298 other resources; and observing business and understanding trends regarding the businesses (Garcia & Turner, 2006). 13.2.3 Defining Constructs and Items for Constructs Principally, our research used some constructs from the selected technology acceptance models and theories, and its own special and contextual constructs were added to provide an extended acceptance model for the acceptance of business processes. Specifically, PU, PEOU and behavioural intention (BI) constructs of the TAM of Venkatesh and Davis (2000), the facilitating conditions (FC) construct of the UTAUT of Venkatesh et al. (2003), and the subjective norm (SN), output quality, results demonstrability, job relevance (JR), and objective usability (OU) constructs of the TAM 3 of Venkatesh and Bala (2008) were used from the selected acceptance models and theories. In addition, new constructs were added to include the business process acceptance content and context. These are organisational culture (OC), audit (AUD), tailoring (TLR), operations and maintenance (OM), stability (STB), granularity (GRN), participation in development (PD), training (TRN), medium (MED), and modelling (MDL). Not all of the constructs of previous models and theories are included in the research. The reason for this is that the model was evaluated to omit constructs that are not associated with the business process acceptance content and context. The fundamental code to determine the constructs to include in the research was the appropriateness and relevancy of the constructs with the business process acceptance content and context for systems and software engineering and management. In total, 19 constructs were defined for the acceptance of business processes context and content. Brief definitions and explanations for each construct are given below in an alphabetical order because they are crucial for understanding the model. • Audit (AUD) is defined as a careful check or review of something, or an objective examination of work product(s) or business processes pertaining to specific set of criteria (CMMI Product Team, 2010). • Behavioural intention (BI) is the extent to which a person has formulated aware ideas to do or not do an identified behaviour (Davis 1989). For the context of this research, it is whether people use and implement business processes or not. • Facilitating conditions (FC) is the organisational and technical/procedural groundwork and arrangements available to assist and encourage the use
- 8. Achieving and Ensuring Business Process Acceptance for Systems 299 of a nominated system (Venkatesh et al., 2003). In this research, a related system is the business processes and their assets. • Granularity (GRN) indicates the details level of a business process in definition and documentation. It is assumed that for business processes, a good GRN means not too much or too little information or details in the defined processes. To be exact, there should be just the required and sufficient amount of information and steps in business processes, nothing more or less, for a good GRN business process. • Job relevance (JR) deals with a system’s applicability and relevance to jobs or tasks (Venkatesh & Davis, 2000). That is, relevance and applicability are required for the JR construct. More specifically, for business processes context, the aim is to highlight and underline the need for relevance and applicability of business processes for projects or organisations. • Medium (MED) implies three main characteristics for business processes content and context. These are the language of the business process documentations, the media of the business process systems online or in hard-copy, and the elements contained in the business process definitions such as texts, visuals, etc. • Modelling (MDL) implies business process modelling, and business process modelling means the abstract depiction of a business processes architecture, design, or definition (Feiler & Humphrey, 1992). For the context of this research, modelling is defined as either prescriptive or descriptive. A prescriptive business process model is a model that describes how to do information, and a descriptive business process model is a model that describes what to do information (Wang & King, 2000). • Objective usability (OU) is the assessment of arrangements regarding a concrete and real amount of work necessary on the way to complete a specific task instead of one that is perceived (Venkatesh & Davis, 2000). For business processes, OU means the real amount of work for using and implementing the business processes rather than the expected or perceived ones. • Operation and maintenance (OM) aims to make sure efforts and resources are devoted to the operations and maintenance of business processes. With good OM practices, it is assumed that actively and proactively defined deployment and maintenance of business processes is achieved by devoted and proficient people or systems. This construct was aimed at addressing some noble characteristics of an ideal OM for business processes.
- 9. Chapter Thirteen 300 • Organisational culture (OC) is a set of collective mental conventions shaping understandings and behaviours in organisations by way of describing proper actions meant for a number of circumstances (Ravasi & Schultz, 2006). • Output quality (OQ) is the extent to which an individual has confidence in the system to accomplish job tasks well and in an expected manner (Venkatesh & Davis, 2000). • Participation in development (PD) is participation in or share of management people, practitioners, or doers in development of business processes before deployment or during definition to ensure their applicability and appropriateness. With this construct, the importance of the right personnel for the development and commitments of people before deployment is emphasized. • Perceived ease of use (PEOU) means the extent to which a person considers that the use of something to be easy and stress-free (Davis 1989). For business processes context and content, PEOU means the easiness and stress-freeness of business processes for employees while using and implementing business processes. • Perceived usefulness (PU) is the extent to which a person considers that using a system will provide aid and advantage to achieve improvements in performances (Davis, 1989). Especially for business processes, the PU means aids and advantages to achieve improvements in performance for people and organisations. • Result demonstrability (RD) is the extent to which an individual considers that the results of using a system are concrete, noticeable, and communicable (Moore & Benbasat, 1991). • Stability (STB) is defined as the condition in which business processes are updated not too frequently or disturbingly. It was assumed business processes should be generally stable and changes and improvements should be incorporated as planned and required. • Subjective norm (SN) is the extent to which a person acknowledges that most people who are significant to her/him consider that she/he ought to or ought not to use a system, for example, a business process system (Fishbein & Ajzen, 1975). • Tailoring (TLR) means efforts for assembling, shifting, or adjusting defined business processes for an unambiguous aim (CMMI Product Team, 2010). Specifically, for business processes, TLR is there to ensure that business processes are suitable with respect to the lifecycle realities of the projects. • Training (TRN) is the option for formal and informal learning, including lecture hall training, causal guiding, e-training/learning,
- 10. Achieving and Ensuring Business Process Acceptance for Systems 301 steered self-learning, and official on the job training (CMMI Product Team, 2010). The aim of this construct is to identify requirements for training with respect to business processes, business process purposes, and business process systems, structures and interactions. Because this research does not replicate or re-apply an acceptance model to a previously studied content or context, not all but some of the defined items were factors used from the study of Venkatesh and Davis (2000), for example PU, PEOU, BI; the FC construct was adapted from the study of Venkatesh et al. (2003); and the SN, OQ, RD, JR, and OU factors were generally taken from the study of Venkatesh and Bala (2008). In addition, for the distinctive constructs of OC, AUD, TLR, OM, STB, GRN, PD, TRN, MED and MDL, the items were designed and defined in accordance with the construct definitions and pertinent literature. In total 70 items were defined for constructs. 13.2.4 Formulating Hypotheses and Model Proposal for Development Owing to the fact that there are three core elements (PU, PEOU, and BI) in the TAM, in the research, hypotheses were formulated based on these core elements. As proposed and proven in the TAM, while formulating the hypotheses, first, we linked the PU and PEOU to the BI, and the PEOU to the PU. Furthermore, to formulate additional hypotheses, each of the remaining constructs (FC, SN, OQ, RD, JR, OU, OC, AUD, TLR, OM, STB, GRN, PD, TRN, MED and MDL) were linked to these three constructs to decide on which construct(s) promoted which construct(s). In total, 51 hypotheses were formulated. Based on the formulated hypotheses, the proposed model (business process acceptance model, BPAM) is depicted in Figure 13-1.
- 11. Chapter Thirteen 302 Figure 13–1 Proposed BPAM with hypotheses Perceived Usefulness Perceived Ease of Use Behavioral Intention for Business Process Acceptance Subjective Norm Organizational Culture Tailoring Results Demonstrability Job Relevance Objective Usability Facilitating Conditions Operations & Maintenance Granularity Training Modelling Medium Audit Participation in Development Stability Output Quality
- 12. Achieving and Ensuring Business Process Acceptance for Systems 303 13.3 Research Methodology 13.3.1 Study Setting and Sample Selection This research used probability sampling; the sample was taken in a way that each and every member of the target population had an equal probability of being picked (Thompson, 2002). Random samples and probability samples are both given names for the selected samples as results of probability sampling techniques (Fuller, 2009). Therefore, the samples in this research can be named as random samples because participants were randomly selected from the target population. This research’s target population included people from organisations delivering products or services in systems and software engineering and management contexts. That is, people working in these kinds of organisations, and people having auditor, contributor, or assessor roles for certifications appreciated in these sorts of organisations in Asia, Europe, and America were included in the target population. 13.3.2 Instrument Development Based on the defined constructs and items for these constructs, a survey instrument (questionnaire) was designed to collect data. After initial design of the questionnaire, a number of steps were followed to make the questionnaire mature, valid in content, and refined before deployment. These steps for review and refinement resulted in 21 changes being incorporated into the questionnaire. Subsequently, design and development of the questionnaire were completed. The questionnaire was prepared in both English and Turkish versions and made available as both online and printed forms. 13.3.3 Instrument Deployment, Data Collection and Analysis for the Pilot Study After completing the design, review and refinement of the questionnaire, the questionnaire was applied for a one-week period. At the end of one-week, 60 responses were collected. The purpose for this piloting was to re-check and re-evaluate the appropriateness and adequacy of the developed instrument. Overall reliability of the instrument was calculated based on the answers of the 60 participants in the pilot study. Cronbach’s alpha value for the pilot study was 0.949. This confirmed the reliability of the developed instrument.
- 13. Chapter Thirteen 304 After analysing descriptive statistics, the answers of the participants to the questions in the questionnaire were also individually analysed to detect if anything could be improved. Nothing important was found to change or improve as a result of these analyses. This is probably owing to the previously done extensive review and refinement steps. Hence, nothing needed to be changed from pilot study to main study, so it was decided to include the pilot study sample in the main study sample. 13.3.4 Instrument Deployment and Data Collection for the Main Study The questionnaire was applied to collect data for a one-month period. At the end of the month, 368 responses were collected. Note, these numbers reflect the cumulative results, including the samples from the pilot study. Of these responses, 77 were obtained via printed questionnaires and 291 via online questionnaires. Certain descriptive statistics details for the collected data are given in Table 13-1, 13-2, and 13-3. Table 13–1 Frequency Statistics of Participants – Genders Gender Frequency % Valid % Cum. % Male 227 61.7 61.7 61.7 Female 140 38.0 38.0 99.7 Other 1 0.3 0.3 100.0 Total 368 100.0 100.0 Table 13–2 Frequency Statistics of Participants - Total Work Experiences Total Work Experience Frequency % Valid % Cum. % 12 years + 158 42.9 42.9 42.9 3-6 years 66 17.9 17.9 60.9 6-9 years 60 16.3 16.3 77.2 9-12 years 48 13.0 13.0 90.2 0-3 years 36 9.8 9.8 100.0 Total 368 100.0 100.0
- 14. Achieving and Ensuring Business Process Acceptance for Systems 305 Table 13–3 Frequency Statistics of Continents in which Participants Live/Work Continents Frequency % Valid % Cum. % Asia 210 57.1 57.1 57.1 Europe 111 30.2 30.2 87.2 America 42 11.4 11.4 98.6 Australia 4 1.1 1.1 99.7 Africa 1 0.3 0.3 100.0 Total 368 100.0 100.0 13.3.5 Exploratory Factor Analysis Exploratory factor analysis (EFA) was used to explore and review the causal and principal correlational relations in a set of data. In this study, the following 11 steps were tailored to apply the EFA. These steps were not sequentially or linearly followed; certain steps were applied simultaneously. However, the details were listed in succession to let the readers easily capture details of the applied EFA. - Sample size adequacy was checked. To ensure that sample size is adequate, there must be no less than 10 samples for each focus in the questionnaire used, and a sample of 200 or more is desirable (Fabrigar et al., 1999; Garson, 2012). In all, 19 subjects and 368 cases were available for this research. Therefore, size adequacy was correctly met. That is, the subject to variable (cases) ratio for this research was 19.4, which is greater than the suggested value of 10. The sample size for this research was 368, which is also greater than the suggested value of 200. - The anti-image correlation matrix was analysed. The measuring of sampling adequacy values on the diagonals of the anti-image correlation matrix was used to check if correlations among the individual items were strong enough to advocate that the correlation matrix was factorable, as suggested by Pett, Lackey, and Sullivan (2003). To provide this factorability and to ensure strong correlations among items, measuring of sampling adequacy values on the anti- image correlation matrix should be greater than 0.50 (Schwab, 2007). The anti-image correlation matrix-measuring of sampling adequacy values for the items in this research varied between 0.665 and 0.954. That is, they were all greater than the recommended value.
- 15. Chapter Thirteen 306 - The Kaiser-Meier-Olkin (KMO) and Bartlett’s test were applied. A KMO sampling adequacy value of 0.6 or above was required (Tabachnick & Fidell, 2001), and as Hutcheson and Sofroniou (as cited in Field 2009) noted, values between 0.5 and 0.7 are average, values between 0.7 and 0.8 are good, values between 0.8 and 0.9 are great and values for KMO above 0.9 are excellent. Moreover, Garson (2012) noted that a value of 0.6 or greater is accepted as satisfactory, and a value of 0.8 or greater is recognised as noble factorability. In this study, the KMO of the sampling adequacy was 0.906: the superb (excellent) criterion was satisfied for sampling adequacy and factorability. Bartlett’s test of sphericity can be used to accept or reject the null hypothesis that variables are uncorrelated in a population. If null hypothesis cannot be vetoed, the suitability and correctness of factor analysis must be probed (Malhotra, 2004). That is to say, the null hypothesis is vetoed and appropriateness of factor analysis is safeguarded when the Bartlett’s test of sphericity result is statistically significant (Garson, 2012). Specifically, the significance value for Bartlett’s test of sphericity should be less than 0.05. Bartlett’s test of sphericity value for this study was calculated as zero. Therefore, the appropriateness of factor analysis for the subject study was also confirmed. - Extracted communalities were checked and addressed. For EFA, extracted communality values for the items should be greater than 0.50 (Cretu & Brodie, 2009; Schwab, 2007). In our research, we first calculated the initial extracted communality values for all items. After analysing the values of all items, an item of the questionnaire was excluded whose extracted communality value was 0.496, or less than 0.50. After removal of the item from the item list, communalities values for the remaining 69 items were recalculated, and it was seen that final extracted communalities for the items varied between 0.519 and 0.918 range. Explicitly, they were all in the accepted range for extracted communalities. - A factor analysis extraction method was defined and applied. There are two main approaches to EFA: Principal components method (PC) and principal axis factoring (PAF). PC is used to reduce the data to a set of factor scores for use in other data analyses. When compared with the PAF, the PC is more common and more practical, and the PC analyses all the variance, while PAF analysis only the shared variance (Neill 2012). For this reason, in our research, we used PC as the factor analysis extraction method to draw conclusions.
- 16. Achieving and Ensuring Business Process Acceptance for Systems 307 - Rotation method was defined and applied. Vogt (as cited in Brown 2009) defines rotation as methods in factor analysis by which a researcher attempts to relate the calculated factors to theoretical entities, although researchers do this in a different way depending upon whether the factors are supposed to be correlated (oblique) or uncorrelated (orthogonal).Kim and Mueller (as cited in Brown, 2009) noted that whether factors are correlated or not may not make much difference in the exploratory stages of analysis, and employing a method of orthogonal rotation may be preferred over oblique rotation. Gorsuch (as cited in Brown 2009) listed four different orthogonal methods for rotation: Equamax, orthomax, quartimax and varimax. Kim and Mueller (as cited in Brown, 2009) advised the selection of the commonly available methods of rotation, such as varimax if orthogonal rotation is pursued by beginners in the field. The best orthogonal rotation is widely believed to be varimax (DeCoster, 1998). Costello and Osborne (2005) also asserted that in spite of the availability of different options for rotation, a varimax rotation is undoubtedly the most often used option, and it is the default option for statistical packages that have defaults (Tabachnick & Fidell, 2001). To relate the calculated factors to theoretical entities, a varimax rotation was applied. - Item main loadings (coefficients) were checked. As recommended by Neill (2012), item main loadings (coefficients) whose absolute values were below 0.4 were suppressed in the composition of factor structure to make the data more interpretable. Obtained factor structures (rotated matrix) with values below 0.4 were suppressed. - A rotated component matrix was created. It was created in relation to the results and justifications provided in the previous steps applied with the EFA. - The number of factors was determined. The number of factors extracted ought to be equal to the number of the eigenvalues of the correlation matrix that are greater than one. Moreover, eigenvalues of the correlation matrix should be plotted in descending order, and the number of factors equal to the number of eigenvalues that occur before the last specified drop in eigenvalue. Magnitude should be determined as the number of factors extracted (DeCoster, 1998; Habing, 2003; Tabachnick & Fidel, 2001). In this research, eigenvalues of numbers greater than one was the decision, and the number of factors was decided according to this pronouncement. As a result, the number of factors was determined as 18.
- 17. Chapter Thirteen 308 - Total variance explained was evaluated and analysed. Researchers are generally happy with 50-75% of the total variance explained (Neill, 2012). The total variance explained value for this study was calculated as 71.583. The results of the research are above the thresholds suggested to achieve and provide pleasing and justifiable results for the body of knowledge and its practitioners. - Factors and items per factors were defined and analysed. The results of the applied EFA demonstrated that the designed and proposed items for RD and OQ collected on the same factor. Therefore, these two factors were combined as a new factor, and this factor was named as Outputs and Results (OR). This change was considered appropriate because RD and OQ address very similar concepts and concerns with respect to business process acceptance. - Outputs and results (OR): OR includes both the degree to which a person relies on the results of using a system being concrete, noticeable, and communicable and the degree to which a person who has confidence in that the system performs job tasks well and in an expected manner. In consequence of the applied EFA completed with the 11 steps listed and explained above, 18 factors (components) were determined. These are PU, PEOU, BI, FC, SN, OR, JR, OU, OC AUD, TLR, OM, STB, GRN, PD, TRN, MED, and MDL. 13.3.6 Confirmatory Factor Analysis Confirmatory factor analysis was used to check whether factors (components) and loadings of measured variables (items) on them complied with what is projected based on previously formed theories. A CFA model may arise from theoretical considerations or be based on the results of the EFA (Everitt & Hothorn, 2011). In this study, the following seven steps were tailored to apply the CFA based on the results of the applied EFA. These steps were not sequentially or linearly followed, certain steps were applied simultaneously. The details are listed in succession to let the readers easily capture the details of the applied CFAs. - A model was drawn with SmartPLS, with the intention of specifying associations and interactions between latent variables (constructs/factors) and observed variables (items). The model was drawn as recommended by Schumacker and Lomax (1996) with the SmartPLS (Ringle, Wende, & Will, 2005).
- 18. Achieving and Ensuring Business Process Acceptance for Systems 309 - A partial least squares (PLS) algorithm was run. After drawing the model, we ran the PLS algorithm in order to confirm or refute convergent validity and discriminant validity of the measurement model. - Factor loadings were checked. In PLS, individual item reliabilities are evaluated by means of investigation of factor loadings (or basic correlations) of measures with corresponding factors (Hulland, 1999). For CFA, factor loadings should be greater than 0.6 (Bagozzi and Yi, 1988). In this research, all factor loadings were greater than the recommended 0.6 value. Hence, the factor loadings requirement of the applied CFA was accurately met. - Composite reliabilities (CR) were checked. The CR is there to check how well a construct (factor/component) is measured by its assigned items (Gotz, Liehr-Gobbers, & Krafft, 2010). CR values larger than 0.6 are normally judged satisfactory (Bagozzi & Yi, 1988). Furthermore, a block is considered homogenous as long as the CR is larger than 0.7 (Vinzi, Trinchera, & Amato, 2010). In this research, all CR values were larger than the recommended 0.7 value. The CR requirement of the applied CFA was correctly met. - Average variance extracted (AVE) values were checked. AVE comprises a variance of factor’s indicators (items) collected by a factor with regard to a total extent of variance, which contains a variance caused by a measurement error (Gotz et al., 2010). In their work, Homburg and Giering, and Rodgers and Pavlou (as cited in Gotz et al., 2010) noted that AVE values of less than 0.5 are considered unsatisfactory because this means more variance is owing to the error variance than caused by the item variance. In this research, all AVE values were higher than the recommended 0.5 value. Therefore, the AVE requirement of the applied CFA was also met. - Convergent validity was confirmed. It can be expressed as the degree to which results of an indicator (item) are similar to the results of another measure or item (Byrne, 1998). The convergent validity assessment confirmed convergent validity for the items of constructs with respect to gathered answers. Convergent validity is checked and confirmed with the previous steps; more specifically, factor loadings, CR values, and AVE values are calculated and evaluated to check and ensure convergent validity. Because this research truly met the factor loadings, CR values, and AVE values requirements, convergent validity was confirmed. - Discriminant validity was checked and confirmed. It is defined as the unlikeness of the constructs (factors/components) in a measurement
- 19. Chapter Thirteen 310 model (Gotz et al., 2010). Fornell and Larcker (1981) noted that AVE values ought to be used to ensure or refute discriminant validity. Hulland (1999) remarked that this measure ought to be larger than a variance shared between a construct and other constructs in a model, specifically, squared correlations among constructs. Discriminant validity can be revealed in a correlation matrix. Correlations in a correlation matrix are among constructs in the lower left off-diagonal elements of a matrix with the square roots of AVE values calculated for each of constructs along the diagonal (Hulland, 1999). To be precise, in order to ensure discriminant validity, square roots of the AVE values for each factor must be greater than the correlations among factors. In this study, discriminant validity was revealed in a correlation matrix comprising the correlations among the constructs in the lower left off-diagonal components of the matrix, and the square roots of the AVE values were calculated for each of the constructs along the diagonal of the matrix. All the square roots of the AVE values for each construct were greater than the correlations among constructs. The discriminant validity was also revealed and confirmed. 13.3.7 Structural Equation Modelling Structural equation modelling (SEM) might be supposed as a fusion of factor analysis and path analysis; yet main distinction between a SEM and other methods is a SEM’s capability to estimate and test associations and interactions among factors/latent variables in a model (Weston and Gore 2006). SEM might be used to express the extent to which IS researches fulfil recognised benchmarks for superior and high-grade statistical analyses (Gefen, Straub, & Boudreau, 2000). The covariance based SEM and PLS SEM (partial least squares structural equation modelling) are types of available and widely used and exploited SEMs in the literature (Gefen et al., 2000). The latter is also refereed as a component based SEM. Pertaining to analysis purposes, statistical suppositions, and natures of suitable statistics, these two distinct types of SEM show a discrepancy (Gefen et al., 2000). Thompson, Barclay, and Higgins say (as cited in Gefen et al., 2000) that the overall statistical aim of a PLS SEM is to show high R2 and significant t-values, accordingly refusing the null hypothesis of no- influence. However, Bollen, Hair, Anderson, Tatham, and Black, and Joreskog and Sorbom (as cited in Gefen et al., 2000) said that the aim of a
- 20. Achieving and Ensuring Business Process Acceptance for Systems 311 covariance-based SEM is to demonstrate that an operationalisation of a theory being studied is verified and/or confirmed and not vetoed by data. It was decided to use PLS SEM over covariance based SEM, for the following reasons: • PLS SEM requires only very limited distributional assumptions (Chin, Peterson, & Brown, 2008). • In PLS SEM, bootstrapping is used to empirically estimate standard errors for its parameter estimates, which saves escape from constricting distributional assumptions (Gefen, Rigdon, & Straub, 2011). • PLS PM (partial least squares path modelling) does not necessarily necessitate a sound theory base. That is to say, PLS supports both exploratory and confirmatory research (Gefen et al., 2011). • Wold (as cited in Gefen et al., 2011) noted that PLS PM is a tool for situations that are data-rich but theory-primitive. • PLS SEM ought to be chosen when the research is exploratory or an extension of an existing structural theory (Hair, Ringle, & Sarstedt, 2011). • If there are many constructs and many indicators in the structural model, that is, if the structural model is complex, PLS SEM should be selected (Hair et al., 2011). Hoyle, Kaplan, Kline, and Schumacker as well as Lomax (as cited in Weston & Gore, 2006) noted that scholars working with SEM practices agree on six fundamental steps required for model testing. These are data collection, model specification, identification, estimation, evaluation, and modification. In this study, PLS SEM was applied via the seven steps listed below: • Data were collected. • EFA was applied. • CFA was applied. • Model estimation and evaluation were done. • Model modification was done. Modification of the model (re- specification) was done by freeing or setting parameters to achieve the best-fitting model (Weston & Gore, 2006). In the research, the model was iteratively and consciously modified, as required by the SEM to accomplish the best-fitting model. • CFA was repeated. • Model estimation and evaluation were repeated.
- 21. Chapter Thirteen 312 Estimation is the determination of the values of the unknown parameters and the errors related with the estimated values. Generally a SEM software programme is used to calculate the estimates of the unknown parameters (Weston & Gore, 2006). In PLS SEM, bootstrapping is performed, meaning estimating the significance (t-values) of the paths (Gefen et al., 2000). During bootstrapping, the minimum number of bootstrap samples should be 5,000 and the number of cases should be equal to the number of observations in the original sample (Hair et al., 2011). Based on these recommendations, in this study, bootstrapping was applied with cases (actual number of sample size) as 368 and samples (bootstraps re-samples) as 5,000 parameters. Results are provided in the Section 13.4.2. 13.4 Data Analyses and Results 13.4.1 Reliability and Validity of the Instrument In order to calculate and evaluate the reliability of the questionnaire, the whole sample was included, 368 participants. As a result of calculations, the Cronbach’s alpha value was found as 0.947, which is greater than the required minimum reliability of 0.70. The reliability of the instrument can also be categorised as excellent because it is also greater than the 0.9 value, which is the lower limit for excellent reliability, as George and Mallery noted (as cited in Gliem & Gliem, 2003). In addition, the Cronbach’s alpha of deleted values for each item was analysed with the aim of analysing and reflecting the weight of each item on the reliability of the instrument. With the purpose of confirming the content validity of the questionnaire, the general content to be characterised was identified. After this, items were chosen from the content that would correctly represent the information in all determined areas. A group of items that was descriptive of the content of the features/constructs/factors to be measured was obtained (Key, 1997). The review of the instrument by professionals was elicited to decide whether the developed instrument adequately covered or sufficiently represented the determined content areas (Kimberlin & Winterstein, 2008).
- 22. Achieving and Ensuring Business Process Acceptance for Systems 313 13.4.2 Estimations and Evaluations of the Initial and Modified Final Models Bootstrapping technique was used to estimate the significance (t- values) of the paths with 5,000 bootstrap samples’ values and 368 cases’ values. Model fit was tested with significant path coefficients, high R2 values, and CR for each factor. R2 values for the initial model are given in Table 13-4. Hypotheses testing results based on the initial model and initially set hypotheses are given in Table 13-5. Table 13–4 R2 Values (Initial Model) Factor R2 BI 0.3735 PEOU 0.5373 PU 0.4997 Table 13–5 Hypothesis Testing Results (Initial Model) No. Relation t-Statistics Value Significance Value Result of Hypothesis Test 1 AUD->BI 0.1071 Rejected 2 AUD->PEOU 1.9713 0.0250 Accepted 3 AUD->PU 1.7321 0.0500 Accepted 4 FC->BI 1.7839 0.0500 Accepted 5 FC->PEOU 1.5674 Rejected 6 FC->PU 2.4698 0.0100 Accepted 7 GRN->BI 0.8884 Rejected 8 GRN->PEOU 0.7879 Rejected 9 GRN->PU 1.1367 Rejected 10 JR->BI 0.0757 Rejected 11 JR->PEOU 1.1454 Rejected 12 JR->PU 1.2907 Rejected 13 MDL->BI 2.4958 0.0100 Accepted 14 MDL->PEOU 0.6818 Rejected 15 MDL->PU 0.1532 Rejected 19 MED->BI 1.7097 0.0500 Accepted
- 23. Chapter Thirteen 314 No. Relation t-Statistics Value Significance Value Result of Hypothesis Test 20 MED->PEOU 4.1989 0.0005 Accepted 21 MED->PU 0.8668 Rejected 22 OC->BI 0.3144 Rejected 23 OC->PEOU 1.0695 Rejected 24 OC->PU 0.9713 Rejected 25 OM->BI 0.1044 Rejected 26 OM->PEOU 3.1863 0.0050 Accepted 27 OM->PU 1.4071 Rejected 28 OR->BI 0.5181 Rejected 29 OR->PEOU 2.9631 0.0050 Accepted 30 OR->PU 2.7720 0.0050 Accepted 31 OU->BI 1.2530 Rejected 32 OU->PEOU 2.4108 0.0100 Accepted 33 OU->PU 1.4606 Rejected 34 PD->BI 2.1268 0.0250 Accepted 35 PD->PEOU 0.9155 Rejected 36 PD->PU 0.7551 Rejected 37 PEOU->BI 1.9368 0.0500 Accepted 38 PEOU->PU 2.6087 0.0050 Accepted 39 PU->BI 2.3921 0.0100 Accepted 40 SN->BI 0.7305 Rejected 41 SN->PEOU 2.8461 0.0050 Accepted 42 SN->PU 3.0311 0.0050 Accepted 43 STB->BI 1.6002 Rejected 44 STB->PEOU 1.7006 0.0500 Accepted 45 STB->PU 1.5692 Rejected 46 TLR->BI 0.5658 Rejected 47 TLR->PEOU 1.3175 Rejected 48 TLR->PU 0.3408 Rejected 49 TRN->BI 1.8838 0.0500 Accepted 50 TRN->PEOU 1.2056 Rejected 51 TRN->PU 0.9166 Rejected
- 24. Achieving and Ensuring Business Process Acceptance for Systems 315 As a result of the data analyses, R2 values for the initial model varied between 0.25 and 0.75. Therefore, in our research, the model fit is at a moderate level with respect to these calculated R2 values for the major factors. In addition, composite reliability values were all above recommended value of 0.7. As a result, the composite reliability dimension of the model fit was also ensured and secured owing to the achieved values with respect to composite reliability. However, there were some insignificant path loadings for some factors/constructs, and some of the initially set hypotheses were not accepted or verified as a result of hypothesis testing. Under these circumstances, it was decided to apply model modification by freeing or setting parameters to achieve the best-fitting model, as is explicitly required by the applied PLS SEM. In the related step of the applied SEM, the model was iteratively and consciously modified, as required by the SEM, in order to accomplish the best-fitting model for the business processes content and context for systems and software engineering and management. The bootstrapping technique was used with the intention of estimating the significance (t-values) of the paths with 5,000 bootstrap sample values and 368 case values. Moreover, for this research model fit was tested with significant path coefficients, high R2 values, and CR for each construct/factor. R2 values calculated for the modified final model are given in Table 13-6. Estimated t-statistics values (the significance of the paths), significance values for each path, and the results of hypothesis tests for the finally set hypotheses for the model with respect to the acceptance of business processes for systems and software engineering and management are given in Table 13-7. Table 13–6 R2 Values (Modified Final Model) Factor R2 BI 0.3673 PEOU 0.5273 PU 0.4772 OR 0.3152 JR 0.2181 SN 0.1447 STB 0.0895
- 25. Chapter Thirteen 316 Table 13–7 Hypothesis Testing Results (Modified Final Model) No. Relation t- statistics value Significance value Result of hypothesis test 1 AUD->PEOU 2.2295 0.0250 Accepted 2 AUD->PU 2.0909 0.0250 Accepted 3 FC->BI 1.8801 0.0500 Accepted 4 FC->PU 3.0906 0.0050 Accepted 5 GRN->STB 5.2925 0.0005 Accepted 6 JR->OR 13.8509 0.0005 Accepted 7 MDL->BI 2.6567 0.0050 Accepted 8 MED->BI 1.8813 0.0500 Accepted 9 MED->PEOU 4.9004 0.0005 Accepted 10 OC->SN 6.7268 0.0005 Accepted 11 OM->PEOU 3.6106 0.0005 Accepted 12 OR->PEOU 3.6478 0.0005 Accepted 13 OR->PU 4.3769 0.0005 Accepted 14 OU->PEOU 2.2765 0.0250 Accepted 15 PD->BI 2.5278 0.0100 Accepted 19 PEOU->BI 2.3907 0.0100 Accepted 20 PEOU->PU 3.4571 0.0005 Accepted 21 PU->BI 2.9331 0.0050 Accepted 22 SN->PEOU 3.1361 0.0050 Accepted 23 SN->PU 3.4779 0.0005 Accepted 24 STB->PEOU 2.0643 0.0250 Accepted R2 values for the BI, PEOU and PU constructs for the modified final model varied between 0.25 and 0.75. Therefore, the model fit can be treated as moderate level with respect to R2 values. In addition, CR values were all above the recommended value of 0.7. Therefore, the CR dimension of the model fit was also confirmed. Finally, listed hypotheses test results were accepted owing to significant t-statistics values.
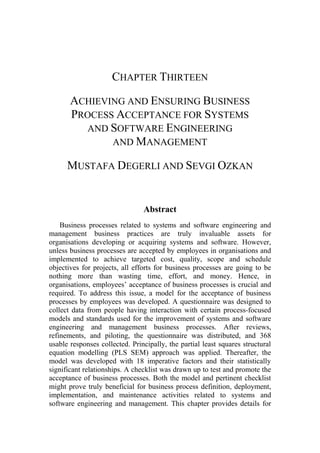
- 26. Achieving and Ensuring Business Process Acceptance for Systems 317 13.5 Conclusions 13.5.1 The Business Process Acceptance Model As a result of extensive data analyses and interpretation, there were 18 prominent and distilled factors determined for the content and context of the acceptance of business processes for systems and software engineering and management practices for development and acquisition practices of systems and software products. These identified and distilled factors for the business process acceptance in systems and software engineering and management are PU PEOU, BI, FC, SN, OR, JR, OU, OC, AUD, TLR, OM, STB, GRN, PD, TRN, MED and MDL. These factors and their statistically significant meaningful relationships were further analysed and interpreted quantitatively, and the BPAM was developed. The depiction of the BPAM is given in Figure 13-2. We confidently supposed that the BPAM would be accurate, noteworthy and advantageous for business process definition, deployment, maintenance and management activities for the engineering and management business processes in systems and software engineering and management contents and contexts and result in remarkable improvements in the schedule and cost performance, product quality, return on investment, and other measures of performance outcomes. These findings are intended to enlighten organisations, employees and managers regarding the ways in which they ought to refer and base their practices throughout defining, deploying, implementing and maintaining their business processes on the way to providing and sustaining, stress-free and low-cost acceptance of useful, easy to use and implemented systems and software engineering and management business processes for individuals, and by this means to achieve the organisation’s strategic goals, objectives and performance, quality, and return on investment objectives related to the development or acquisition of products and services. For each of the identified relations among factors, practical interpretations for statistically significantly meaningful relations among factors are given in Section 13.5.2
- 27. Chapter Thirteen 318 Figure 13–2 The BPAM Perceived Usefulness Perceived Ease of Use Behavioral Intention for Business Process Acceptance Subjective Norm Organizational Culture Tailoring Outputs & Results Job Relevance Objective Usability Facilitating Conditions Operations & Maintenance Granularity Training Modeling Medium Audit Participation in Development Stability
- 28. Achieving and Ensuring Business Process Acceptance for Systems 319 13.5.2 Interpreting Statistically Significant Meaningful Relations among Factors for Business Process Acceptance For the content and context of the acceptance of business processes for systems and software engineering and management practices, a number of prominent relations were identified, as shown in Figure 13-2. For each of these explored and proven relations, certain practical interpretations are given in the bulleted items below: - AUD positively affects PEOU and PU. AUD is there to provide a careful check or review against a specific set of criteria for work products and business processes. In addition, audits in business settings are there for improvement and facilitation of practices and activities. That is, as a result of audits, it is quite common to elicit and detect improvement and facilitation opportunities for business activities and processes. These sorts of results, in turn, may and can result in remarkable improvements in the levels of both usability and ease of use of business processes by employees. That is, by means of facilitation and easing that stemmed from improvements detected in audits, PEOU of business processes is going to rise. Moreover, owing to improvements detected in audits, aid and advantage to achieve improvements in performances become more frequent, and these may increase the PU of business processes in systems and software engineering and management. As a result, the relation saying audit positively affects PEOU and PU is legitimate and meaningful. - FC positively affects PU and BI. Organisational and technical or procedural groundwork and arrangements available in an attempt to assist and encourage use of business processes are defined as the FC for business processes. In such a context, with the help of FC, people may consider that using business processes will provide aids and advantages to achieve improvements in their work and product performances as they have organisational and technical or procedural groundwork and arrangements available. In addition, it is quite normal that FC available in organisations add to people’s formulated ideas to use business processes in organisations because assistance and encouragements exist that facilitate organisational and technical or procedural groundwork and arrangements for the use of business processes. Claiming that FC positively affects PU and BI is also justifiable and significant. - GRN positively affects STB. For the business processes context, we decided that the details level of a business process be treated as its
- 29. Chapter Thirteen 320 GRN. We assumed that a good GRN means not too much or too little information or details in business processes. Explicitly, we suggested that there should be just the required and enough information and steps in business processes, nothing more or less, for a good GRN. In addition, for business process settings, we defined the STB as the condition in which business processes are updated not too frequently or disturbingly. We assumed business processes should be generally stable, and changes and improvements should be incorporated as planned and required. When these two definitions and explanations were evaluated together, it is appropriate to expect that when a good GRN exists, there will be stability in business processes. That is, owing to a good GRN, there will be no or a relatively small number of disturbing changes and fixes in business processes. Too much or too little information lead to more changes and fixes, and these are truly eliminated via a good GRN in business processes. In view of that, claiming that GRN positively affects stability is reasonable and essential for business processes context. - JR positively affects OR. We defined the JR as the relevancy and applicability of business processes. In addition, outputs and results of business processes mean both the degree to which a person relies on the results of using business processes as concrete, noticeable, and communicable and the degree to which people have confidence that business processes help them perform their job tasks well and in an expected manner. It is sound to suppose that outputs and results of business processes are directly influenced by job relevancy because applicable and relevant definitions and practices endow and ensure concrete, noticeable, and communicable results and aids in performing tasks well and in an expected manner. Thus, the association revealed and confirmed the JR and OR of business processes is expected and logical for the business processes context. - MDL positively affects BI. Once business processes are modelled with proper notations or methods, abstract depictions of business process architectures, designs or definitions become clearer and more concrete for employees in organisations. With such abstractions, drawings and definitions, people in the organisations formulate ideas to use and implement business processes on account of being given enough information about the individual business processes, interactions of business processes and value chains generated by business processes. People generally formulate conscious ideas to do something once they are entirely aware of it and once they appreciate the added value of the practices. Modelling of business processes adds to the motivation to
- 30. Achieving and Ensuring Business Process Acceptance for Systems 321 use the business processes because modelling provides abstract depictions of business process architectures, designs or definitions for employees. Hence, the association between MDL and BI is fairly reasonable and anticipated for business processes context. - MED positively affects PEOU and BI. In the research, to imply the MED of business processes, we exploited three main aspects. These are the language of the business process documentation, the media of the business process system online or in hard-copy, and the elements contained in the business process definitions as texts, visuals, etc. When separately or cumulatively evaluated, all three elements for business processes’ content and context extend the extent to which people consider that the use of business processes is easy and stress- free. Furthermore, with such conventions as proper language use in the documentation of business processes, the use of online systems for business process deployments and the inclusion of both visuals and texts in business process definitions, it is reasonably normal to expect and suppose that people’s intentions to use business processes are positively influenced. Consequently, the idea claiming that MED positively affects PEOU and BI is level-headed and indispensable for business processes context. - OC positively affects SN. In organisations, a set of collective mental conventions shaping understandings and behaviours as per describing proper actions meant a number of circumstances or perspectives are generally defined as the organisation’s culture. Similarly, the extent to which a person acknowledges that most people who are significant to him or her deliberate upon what he or she ought to do or not do something means the SN exists in social settings. When these two definitions are evaluated, it is pretty rational that these are closely linked concepts. Therefore, it is normal to expect that these constructs are also linked in the organisations for business processes context. In point of fact, this was what was revealed as a result of the data analyses in the determination of the factors for business process acceptance in systems and software engineering and management. The relationship discovered and proven between the OC and SN is expected and valid. - OM positively affects PEOU. With good OM practices for business processes, we assumed that there would be active and proactive definition, deployment and maintenance of business processes by devoted and proficient bodies or systems. With these practices for business processes, we envisaged that the extent to which people consider use and implementation of business processes is easy and stress-free. This is a quite predictable relation. Once the stated
- 31. Chapter Thirteen 322 operations and maintenance practices are ensured, that is the efforts and resources devoted for the operations and maintenance of business processes are ensured, people do not have much difficulty and stress while using the business processes. This is confirmed in consequence of data analyses accomplished in our research, namely, for business processes contexts, OM positively affects PEOU. - OR positively affects PU and PEOU. OR of business processes imply both the degree to which a person believes that the results of using business processes are concrete, noticeable, and communicable and the degree to which a person has confidence that business processes help him or her to perform job tasks well and in an expected manner. Once the results of business processes are concrete, noticeable and communicable, people’s perceptions for the usefulness of business processes are confidently influenced. Furthermore, once business processes help people to perform their job tasks well and in an expected manner, people’s view of business processes regarding ease of use is also going to be positively influenced. Explicitly, outputs and results of business processes are of the essence as they truly outline people’s views in organisations, especially with respect to the usefulness and ease of use of business processes in systems and software engineering and management settings. Thus, the link revealed and confirmed between the OR and PEOU and PU of business processes is responsible and practical for the business processes context. - OU positively affects PEOU. OU addresses the assessment of arrangements of the concrete and real amount of work necessary on the way to complete a specific task, rather than what is perceived. To be precise, it pragmatically deals with the actual spent effort. For business processes context, as long as the OU of business processes are arranged and ensured, easy and stress-free use of business processes can also be arranged and provided routinely with no additional extra effort. The link between OU and PEOU is obvious and usual for business processes, as revealed by the results of data analyses. PD positively affects BI. We aimed to delineate the PD as participation or share of management of people, practitioners or doers in the development of business processes, before deployment or during definition, to ensure its applicability and appropriateness. With this construct, the importance of qualified personnel in the development and commitments of people before deployment is emphasised. These are imperative elements to ensure the people’s use of defined business processes. Once people and actual doers become part of business
- 32. Achieving and Ensuring Business Process Acceptance for Systems 323 process definitions and deployments, they more conveniently and readily accept and apply the business processes. As long as relevant people’s comments are ensured for the applicability and appropriateness of business processes, BI will add to the applicable and appropriate business processes definition, which is very important for the BI for the use of business processes. Hence, the association between PD and BI is fairly rational and predictable for business processes context. - PEOU positively affects PU and BI. The extent to which a person considers that use of something is easy and stress-free and the extent to which a person has formulated aware ideas to do or not do an identified behaviour are strongly related. This key link is also revealed and confirmed by the state-of-the-art theories in the TAM and TAM 3. Similarly, for the business processes context, the extent to which a person considers that use and implementation of business processes is easy and stress-free and the extent to which a person has formulated aware ideas to use and implement business processes are associated. Furthermore, the extent to which a person considers that using a system will provide aid and advantage to achieve improvements in performance and the extent to which a person has formulated aware ideas to do or not do for an identified behaviour are closely associated. This major connection is also discovered and verified by the state-of- the-art theories in the TAM and TAM 3. Likewise, for business processes context, the extent to which a person considers that using and implementing business processes will provide aid and advantage to achieve improvements in performance and the extent to which a person has formulated aware ideas to use and implement business processes are linked. These conclusions were explored and verified as a result of the data analysis in our research. More exactly, for business processes context, PEOU positively affects PU and BI. - PU positively affects BI. The extent to which a person considers that the use of something is easy and stress-free and the extent to which a person has formulated aware ideas to do or not do for an identified behaviour are intimately linked. This prominent connection is also discovered and verified by the state-of-the-art theories in the TAM and TAM 3. Likewise, for business processes context, the extent to which a person considers that use of business processes is easy and stress-free and the extent to which a person has formulated aware ideas to use and implement business processes are linked. This conclusion is explored and verified as a result of the data analysis in our research. More precisely, for business processes context, PU positively affects BI.
- 33. Chapter Thirteen 324 - SN positively affects PEOU and PU. SN for business processes can be defined as the extent to which a person acknowledges that most people who are significant to his or her responsibilities deliberate that he or she ought to use and implement business processes defined for engineering and management of systems and software. Other people’s view in the same organisations will shape the perceptions of people about the usefulness and easiness of use and implementation of business processes. To be precise, if most people in the organisation think that business processes are easy to use, a person’s view in this context will be of a similar direction. The same rule applies for usefulness. If most of the people in the organisation think that business processes are useful, a person’s view will also be shaped and directed accordingly. SN is essential as it truly shapes minorities’ views in organisations especially for the usefulness and easiness of use and implementation of business processes in systems and software engineering and management settings. Thus, the link revealed and confirmed between SN, PEOU and PU of business processes are liable and reasonable for the business processes context for systems and software engineering and management. - STB positively affects PEOU. To ensure easiness in use of processes there are certain conditions that must be fulfilled. One of them is ensuring stability. By STB, we mean the conditions in which business processes are updated not too frequently or disturbingly. We assumed business processes should be generally stable, and changes and improvements should be incorporated as planned and required. Such stability will remove the difficulties caused by the consequences of frequent and disturbing updates in business processes, and this stability provides easy and stress-free use and exploitation of business processes by employees in organisations. As a result, saying stability positively influences PEOU of business processes is meaningful. - TLR positively affects JR. Assembling, shifting, or adjusting business processes for an unambiguous aim, or more accurately suiting business processes for lifecycle realities of the projects, is defined as TLR for business processes context. That is, TLR is there to provide adjustment and alignment. With the help of tailoring, business processes’ applicability and relevancy to jobs are achieved, which is the essential common sense view in the wake of JR. More precisely, relevancy and applicability of business processes are achieved with tailoring practices. This apparent and sound relation was also verified in the research completed. More precisely, TLR is one of the very prominent
- 34. Achieving and Ensuring Business Process Acceptance for Systems 325 ways to achieve job relevancy of business processes for the life cycle realities of systems and software development and acquisition projects. - TRN positively affects BI. Training with respect to business processes, business process purposes and business process systems, structures and interactions will foster people’s understandings of the added values, motivations and contributions of business processes. Once people are provided options for formal and informal learning, including lecture hall training, causal guiding, e-training/learning, steered self-learning and official on-the-job training about business processes, business process purposes, and business process systems, structures and interactions, they more readily and conveniently use and exploit the business processes in systems and software engineering and management. This is demonstrated as a result of data analyses conducted. That is to say, for business processes context, training positively affects BI. 13.5.3 The Checklist for Business Process Acceptance We suggest that as business processes are accepted and implemented by individuals in organisations, all efforts to institutionalise manage and define processes with the purpose of giving rise to improvements in schedule and cost performance, product quality, return on investment, and other measures of performance outcome are going to be achieved. Therefore, the way in which organisations ought to refer while defining and maintaining their business processes for systems and software engineering and management to provide stress-free and low-cost acceptances for the individuals is important. Naturally, during deployment, operations, and maintenance of business processes for systems and software engineering and management, there are certain aspects to take into account to provide and ensure the acceptance of business processes by the employees in organisations. Readers of this chapter may exploit and take the advantage of the checklist below to test and promote the acceptance of business processes in organisations for certain purposes. We developed and provided a checklist (Table 13-8) to test and promote the acceptance of business processes in systems and software engineering and management. A related checklist was composed based on the results of analyses of this extensive research. Therefore, we propose that the more, expressed as +, answers in the below checklist are to ensure or promote the acceptance of the business processes in systems and software engineering and management contexts.
- 35. Chapter Thirteen 326 Table 13-8 Checklist to Test and Promote the Acceptance of Business Processes in Systems and Software Engineering and Management No. Item +/- 1 Business processes are modelled and documented so that they direct what to do and/or how to do information for engineering and management contexts. 2 Business processes are defined and designed so that they are useful and easy to use. 3 Business processes do not create extra costs or paperwork while performing a work or task; instead, business processes are defined to eliminate all non-value adding costs or paperwork. 4 Business processes are defined to provide usefulness for all related employees, independent of the personnel who implement business processes. 5 People who have enough knowledge about business processes and their practices and have firm experience in these have taken part in the phases for definition or update of business processes. 6 People directly using or implementing the business processes have actively taken part in the phases for definition or update of business processes. 7 Commitments of people who directly implement the business processes, of business processes owners and of management representatives have been ensured during definition and before deployment of business processes. 8 There is active use of business processes as an established by OC in the organisation. 9 Encouraging and rewarding are there for use of business processes as an element of OC. 10 Business processes are directly related to the work or task to be performed.
- 36. Achieving and Ensuring Business Process Acceptance for Systems 327 No. Item +/- 11 Business processes are appropriate and applicable in real life conditions (concerning project/department and organisation’s realities). 12 Business processes are defined so that outputs, produced as a result of implementation of business processes, meet the expected quality performance. 13 Business processes are defined to let personnel do their work better. 14 Business processes are defined so that outputs produced as a result of implementation of business processes are important, beneficial and meaningful. 15 The outputs or results of business processes are appropriate and applicable to use for certain purposes. 16 It is permitted to tailor business processes for specific needs, realities and priorities of projects and use tailored business processes. 17 There are meaningful defined rules for business processes’ tailoring. 18 Implementations of business processes are actively audited by competent people. 19 Outputs of business processes are enthusiastically reviewed by competent people. 20 Training is planned and firmly delivered to personnel by the competent people with respect to business processes or business processes updates, business processes system, structure, and interactions, and this trainings is repeated as necessary. 21 An easily accessible guide about business processes system, structure, and interactions, is provided to the personnel. 22 There are no frequent/disturbing changes in the business processes.
- 37. Chapter Thirteen 328 No. Item +/- 23 Business processes are deployed once they are mature enough. 24 There is active use of business processes by the people whose thoughts and behaviours are acknowledged in the organisation. 25 Business processes are designed to provide usefulness/benefits. 26 Business processes are designed to provide performance improvements. 27 Business processes are designed and defined to provide productivity, efficiency, and effective improvements. 28 Business processes are not too detailed regarding their contents. 29 Business processes do not include too many steps to perform works or tasks. 30 Business processes include the required and enough information, nothing more or less. 31 There are effective and efficient systems/tools to provide business processes to the people. 32 There are active, competent, and professional consultants who can be contacted about in certain cases with respect to the use and implementation of business processes. 33 In the organisation, there are certain tools and/or systems to easily access and use business processes. 34 In addition to the texts, there are well-refined and meaningful visual elements, flows, and diagrams in the business processes. 35 Business processes are documented in employees’ native language or a language in which employees are proficient. 36 Business processes are online and easily searchable with respect to their contents.
- 38. Achieving and Ensuring Business Process Acceptance for Systems 329 No. Item +/- 37 Interaction with business processes does not require too much mental effort, and interaction with the processes is clear and understandable. 38 Active, competent and professional people have taken part in during deployment, maintenance and operations of business processes. 39 Updates of business processes are incorporated and approved by the people who are competent enough with respect to business processes and business processes system and have field knowledge. 40 Activities for deployment, operations and maintenance of business processes are performed in accordance with a plan or programme and are parallel to the organisation’s business and strategic objectives. 41 A group is there for deployment, operations and maintenance of business processes, and this group is composed of competent people who are directly responsible for their work and have adequate theoretical and practical knowledge in the field. References Ajzen, I. (1991). The theory of planned behavior. Organizational Behavior and Human Decision Processes, 50(2), 179-211. Bagozzi, R. P., & Yi, Y. (1988). On the evaluation of structural equation models. Journal of the Academy of Marketing, 16(1), 74-94. Brown, J. D. (2009). Choosing the right type of rotation in PCA and EFA. JALT Testing & Evaluation SIG Newsletter, 13(3), 20-25. Byrne, B. M. (1998). Structural equation modeling with LISREL, PRELIS, and SIMPLIS: Basic concepts, applications, and programming. Mahwah, NJ: L. Erlbaum. Chin, W. W., Peterson, R. A., & Brown, S. P. (2008). Structural equation modeling in marketing: Some practical reminders. Journal of Marketing Theory and Practice, 16(4), 287‐298.
- 39. Chapter Thirteen 330 Chrissis, M. B., Konrad, M. D., & Shrum, S. (2006). CMMI: Guidelines for process integration and product improvement (2nd ed.). Boston, MA: Addison-Wesley. CMMI Product Team. (2010). CMMI for development, Version 1.3: Improving processes for developing better products and services (Technical Report, CMU/SEI-2010-TR-033). Software Engineering Institute, Carnegie Mellon University. Compeau, D. R., & Higgins, C. A. (1995). Application of social cognitive theory to training for computer skills. Information Systems Research, 6(2), 118-143. Costello, A. B., & Osborne, J. (2005). Best practices in exploratory factor analysis: Four recommendations for getting the most from your analysis. Practical Assessment Research & Evaluation, 10(7), 1-9. Cretu, A. E., & Brodie, R. J. (2009). Brand image, corporate reputation, and customer value. In M. S. Glynn & A. G. Woodside (Eds.), Business-to-business brand management: Theory, research and executive case study exercises (Advances in business marketing and purchasing, Volume 15), pp. 263-387. Birmingham, UK: Emerald Group. Crosby, P. B. (1979). Quality is free: The art of making quality certain. New York, NY: McGraw-Hill. Davis, F. D. (1989). Perceived usefulness, perceived ease of use, and user acceptance of information technology. MIS Quarterly, 13(3), 319-340. —. (1993). User acceptance of information technology: Systems characteristics, user perceptions and behavioral impacts. International Journal of Man-Machine Studies, 38(3), 475-487. Davis, F. D., Bagozzi, R. P., & Warshaw, P. R. (1992). Extrinsic and intrinsic motivation to use computers in the workplace. Journal of Applied Social Psychology, 22(14), 1111-1132. DeCoster, J. (1998). Overview of factor analysis. Retrieved from http://www.stat-help.com/notes.html Deming, W. E. (1986). Out of the crisis. Cambridge, MA: MIT Center for Advanced Engineering. Dillon, A., & Morris, M. (1996). User acceptance of new information technology: Theories and models. Annual Review of Information Science and Technology, 31(1), 3-32. Everitt, B., & Hothorn, T. (2011). An introduction to applied multivariate analysis with R. New York, NY: Springer. Fabrigar, L. R., Wegener, D. T., MacCallum, R. C., & Strahan, E. J. (1999). Evaluating the use of exploratory factor analysis in psychological research. Psychological Methods, 4(3), 272-299.
- 40. Achieving and Ensuring Business Process Acceptance for Systems 331 Field, A. P. (2009). Discovering statistics using SPSS (3rd ed.). Los Angeles, SF: SAGE. Feiler, P., & Humphrey, W. (1992). Software process development and enactment: Concepts and definitions (Technical Report, CMU/SEI-92- TR-004). Software Engineering Institute, Carnegie Mellon University. Fishbein, M., & Ajzen, I. (1975). Belief, attitude, intention, and behavior: An introduction to theory and research. Reading, MA: Addison- Wesley. Fornell, C., & Larcker, D. F. (1981). Evaluating structural equation models with unobservable variables and measurement error. Journal of Marketing Research, 18(1), 39-50. Fuller, W. A. (2009). Sampling statistics. Hoboken, New Jersey, NJ: Wiley & Sons. Garson, G. D. (2012). Factor analysis. Quantitative methods in public administration. Retrieved from http://faculty.chass.ncsu.edu/garson/PA765/factor.htm Garcia, S., & Turner, R. (2006). CMMI Survival guide: Just enough process improvement. Upper Saddle River, NJ: Addison-Wesley. Gefen, D., Rigdon, D. E., & Straub, D. (2011). An update and extension to SEM guidelines for administrative and social science research. MIS Quarterly, 35(2), 3-14. Gefen, D., Straub, D. W., & Boudreau, M. (2000). Structural equation modeling and regression: Guidelines for research practice. Communications of AIS, 4(7), 719-751. Gliem, J. A., & Gliem, R. R. (2003). Calculating, interpreting, and reporting Cronbach’s Alpha reliability coefficient for Likert-type scales. Midwest Research to Practice Conference in Adult, Continuing, and Community Education, September 27th -29th . The Ohio State University, Columbus, US. Gotz, O., Liehr-Gobbers, K., & Krafft, M. (2010). Evaluation of structural equation models using the partial least squares (PLS) approach. In V. E. Vinzi, W. W. Chin, J. Henseler, & H. Wang (Eds.), Handbook of partial least squares: Concepts, methods and applications, pp. 691- 711. New York, NY: Springer. Habing, B. (2003). Exploratory factor analysis. Retrieved from http://www.stat.sc.edu/~habing/courses/530EFA.pdf Hair, J. F., Ringle, C. M., & Sarstedt, M. (2011). PLS-SEM: Indeed a silver bullet. Journal of Marketing Theory and Practice, 19(2), 139- 151.
- 41. Chapter Thirteen 332 Hulland, J. (1999). Use of partial least squares (PLS) in strategic management research: A review of four recent studies. Strategic Management Journal, 20(2), 195-204. Jasperson, J., Carter, P. E., & Zmud, R. W. (2005). A comprehensive conceptualization of post-adoptive behaviors associated with information technology enabled work systems. MIS Quarterly, 29(3), 525-557. Juran, J. M. (1988). Juran on planning for quality. New York, NY: Macmillan. Key, J. P. (1997). Research design in occupational education (Module R10 reliability and validity). Retrieved from http://www.okstate.edu/ag/agedcm4h/academic/aged5980a/5980/newp age18.htm Kimberlin, C. L., & Winterstein, A. G. (2008). Validity and reliability of measurement instruments used in research. American Society of Health-System Pharmacists, 65(2), 2276-2284. Malhotra, N. K. (2004). Marketing research: An applied orientation (4thed.). London, UK: Prentice-Hall International. Moore, G. C., & Benbasat, I. (1991). Development of an instrument to measure perceptions of adopting an information technology innovation. Information Systems Research, 2(3), 192-222. Neill, J. (2012). Exploratory factor analysis – Survey research & designing psychology. Retrieved from http://www.slideshare.net/jtneill/exploratory-factor-analysis Pett, M. A., Lackey, N. R., & Sullivan, J. J. (2003). Making sense of factor analysis: The use of factor analysis for instrument development in health care research. Thousand Oaks, CA: Sage. Ravasi, D., & Schultz, M. (2006). Responding to organizational identity threats: Exploring the role of organizational culture. Academy of Management. Journal, 49(3), 433-458. Ringle, C. M., Wende, S., & Will, A. (2005). SmartPLS 2.0 (M3). Retrieved from: http://www.smartpls.de Rogers, E. M. (1995). Diffusion of innovations (4th ed.). New York, NY: Free Press. —. (2003). Diffusion of innovations (5th ed.). New York: The Free Press. Schumacker, R. E., & Lomax, R. G. (1996). A beginner’s guide to structural equation modeling. Mahwah, NJ: Lawrence Erlbaum. Schwab, A. J. (2007). Principal components factor analysis. Retrieved from: http://www.utexas.edu/courses/schwab/sw388r7/ClassMaterials/ Shewhart, W. A. (1931). Economic control of quality of manufactured product. New York, NY: Van Nostrand.
- 42. Achieving and Ensuring Business Process Acceptance for Systems 333 Tabachnick, B. G., & Fidell, L. S. (2001). Using multivariate statistics (4th ed.). Needham Heights, MA: Allyn and Bacon. Taylor, S., & Todd, P. A. (1995). Understanding information technology usage: A test of competing models. Information Systems Research, 6(4), 144-176. Thompson, R. L., Higgins, C. A., & Howell, J. M. (1991). Personal computing: Toward a conceptual model of utilization. MIS Quarterly, 15(1), 124-143. Thompson, S. K. (2002). Sampling (2nd ed.). New York, NY: Wiley & Sons. Venkatesh, V., & Bala, H. (2008). Technology acceptance model 3 and a research agenda on interventions. Decision Sciences, 39(2), 273-315. Venkatesh, V., & Davis, F. (2000). A theoretical extension of the technology acceptance model: Four longitudinal field studies. Management Science, 46(2), 186-204. Venkatesh, V., Morris, M. G., Davis, G. B., & Davis, F. D. (2003). User acceptance of information technology: Toward a unified view. MIS Quarterly, 27(3), 425-478. Vinzi, V. E., Trinchera, L., & Amato, S. (2010). PLS path modeling: From foundations to recent developments and open issues for model assessment and improvement. In: V. E. Vinzi, W. W. Chin, J. Henseler, & H. Wang, (Eds.), Handbook of partial least squares: Concepts, methods and applications, pp. 47-82. New York, NY: Springer. Wang, Y., & King, G. (2000). Software Engineering Processes: Principles and Applications. Boca Raton, FL: CRC Press. Weston, R., & Gore, P.A. (2006). A brief guide to structural equation modeling. The Counseling Psychologist, 34(5), 719-751. Authors Note Mustafa Degerli and Sevgi Ozkan, Graduate School of Informatics of the Middle East Technical University, 06800, Cankaya, Ankara/Turkey. The authors would like to thank the people who participated in the research. The authors are grateful for the invaluable comments and suggestions made by the reviewers and editors. Any correspondences pertaining to this research and work should be addressed to Mustafa Degerli, Email: mustafadegerli@icloud.com