•Download as DOCX, PDF•
1 like•439 views


Recommended
Recommended
More Related Content
What's hot
What's hot (10)
Viewers also liked
Viewers also liked (20)
Similar to
Similar to (20)
More from Chie Pegollo
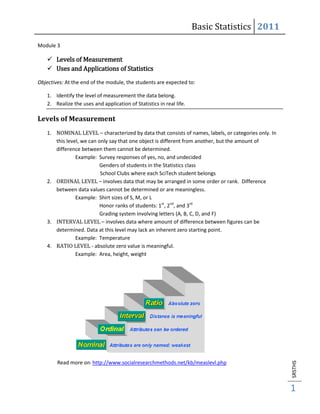
- 1. Basic Statistics 2011 Module 3 Levels of Measurement Uses and Applications of Statistics Objectives: At the end of the module, the students are expected to: 1. Identify the level of measurement the data belong. 2. Realize the uses and application of Statistics in real life. Levels of Measurement 1. NOMINAL LEVEL – characterized by data that consists of names, labels, or categories only. In this level, we can only say that one object is different from another, but the amount of difference between them cannot be determined. Example: Survey responses of yes, no, and undecided Genders of students in the Statistics class School Clubs where each SciTech student belongs 2. ORDINAL LEVEL – involves data that may be arranged in some order or rank. Difference between data values cannot be determined or are meaningless. Example: Shirt sizes of S, M, or L Honor ranks of students: 1st, 2nd, and 3rd Grading system involving letters (A, B, C, D, and F) 3. INTERVAL LEVEL – involves data where amount of difference between figures can be determined. Data at this level may lack an inherent zero starting point. Example: Temperature 4. RATIO LEVEL - absolute zero value is meaningful. Example: Area, height, weight Read more on: http://www.socialresearchmethods.net/kb/measlevl.php SRSTHS 1
- 2. Basic Statistics 2011 A. Classify the following variables/data as to whether they are qualitative (QL) or quantitative (QN). Write also the level of measurement whether nominal (N), ordinal (O), interval (I), or ratio (R). QN/QL Level/Scale 1. Color of the eye 2. Number of books in the library 3. Position in the company 4. Number of students enrolled in StaRSci 5. Student ID Number 6. Age 7. Rank of Students 8. Temperature in Santa Rosa 9. Number of votes 10. Religion B. Identify the level of dependent variable measurement (nominal, ordinal, interval, or ratio) implied by the statement. 1. You asked congressmen if the money they have received from PACs is more than $100,000, between $50,000 and $100,000, or less than $50,000. 2. You asked congress about the primary source of their PAC money: Labor unions, corporations, medical associations, or civil rights groups. 3. You checked the congressional record to see how many times in the past year each congressman was absent from a roll call vote. 4. You asked people on the street to rate their own congressman on a 1 - 7 Likert scale. 5. You asked congressmen to indicate whether they are Republican, Democrat, or Independent. 6. You asked people on the street to rate their own congressman as very liberal, slightly liberal, moderate, slightly conservative or very conservative. 7. You asked each congressman how many years s/he had been in congress. 8. You asked congressmen: Of the following issues, rank order the top three in importance: gas prices, war in Iraq, war in Afghanistan, urban crime, domestic poverty, subprime mortgage crisis. Source: http://www.brainmass.com/homework-help/business/business-analysis/255911 SRSTHS 2
- 3. Basic Statistics 2011 Level of Measurement Practice Exercises online http://courses.csusm.edu/soc201kb/exercises.htm Uses and Application of Statistics Statistics plays a vital role in many fields of human activity. The applications of statistics have grown so that practically every field of study now benefits in some way from the use of statistical methods. Statistics helps in determining the existing position of per capita income, unemployment, population growth rate, housing, schooling, and medical facilities in a country. Manufacturers provide better products at lower costs through the use of statistical quality control techniques. Diseases are controlled through analyses designed to anticipate epidemics. Endangered species of fish and other wildlife are protected through regulations and laws that react to statistical estimates of changing population sizes. By pointing to lower fatality rates, legislators can better justify laws such as those governing air pollution, auto inspections, seat belt and air bag use, and drunk driving. There are a lot more examples but that will be left for you to discover. More information in: http://www.emathzone.com/tutorials/basic-statistics/functions-or-uses-of-statistics.html http://www.emathzone.com/tutorials/basic-statistics/importance-of-statistics-in-different-fields.html http://www.scribd.com/doc/3530536/Applications-of-Statistics http://www.stat.auckland.ac.nz/~wild/ChanceEnc/Ch01.usesstat.pdf Abuses of Statistics As educated and responsible member of society, you should hone your ability to recognize distorted statistical data and learn to interpret undistorted data intelligently. You should be aware and critical to misleading and deceptive claims, such as those commonly associated with polls, graphs, and averages. More examples on: http://www.econoclass.com/misleadingstats.html http://faculty.atu.edu/mfinan/2043/section31.pdf SRSTHS 3
- 4. Basic Statistics 2011 Assignment: 1. Why do students like you need to study Statistics? 2. Watch TV tonight or read the newspaper. Identify at least three commercials, shows, or segments which mentioned some kind of statistics. (example: the text poll in TV Patrol which asked “Do you think Pacquiao deserved his victory?”) 3. What profession do you intend to pursue after high school? How do you think can Statistics be used in the field of your interest? Enumerate applications of statistics to your field of interest. 4. Who do you think can benefit from the statistics given below? How can it be useful to them? SRSTHS 4