Charter school ccsd presentation to board kcsma (1)
•Download as PPTX, PDF•
1 like•16,021 views


Recommended
More Related Content
Similar to Charter school ccsd presentation to board kcsma (1)
Similar to Charter school ccsd presentation to board kcsma (1) (15)
Recently uploaded
Recently uploaded (20)
Charter school ccsd presentation to board kcsma (1)
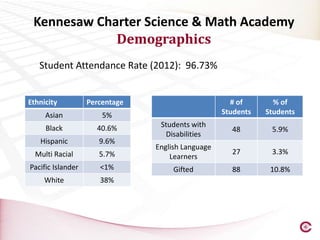
- 1. Kennesaw Charter Science & Math Academy Demographics Student Attendance Rate (2012): 96.73% Ethnicity Percentage # of % of Asian 5% Students Students Black 40.6% Students with 48 5.9% Disabilities Hispanic 9.6% English Language Multi Racial 5.7% 27 3.3% Learners Pacific Islander <1% Gifted 88 10.8% White 38%
- 2. Charter Goals Grade 3: Measure 1: 93% of students will meet or exceed standards on CRCT Science assessment. Actual performance was 84%. Measure 2: 39% of students will exceed standards on CRCT Math assessment. Actual performance was 65% Measure 3: 52% of students will exceed standards on CRCT Reading assessment. Actual performance was 55% Measure 4: 43% of students will exceed standards on CRCT English/Language Arts assessment. Actual performance was 45%. Grade 4: Measure 1: 49% of students will exceed standards on CRCT Science Assessment. Actual performance was 68% Measure 2: 39% of students will exceed standards on CRCT Math Assessment. Actual performance was 31% Measure 3: 43% of students will exceed standards on CRCT Reading Assessment. Actual performance was 58% Measure 4: 43% of students will exceed standards on CRCT English/Language Arts Assessment. Actual performance was 68% Grade 5: Measure 1: 36% of students will exceed standards on CRCT Science Assessment. Actual performance was 75% Measure 2: 32% of students will exceed standards on CRCT Math Assessment. Actual performance was 68% Measure 3: 18% of students will exceed standards on CRCT Reading Assessment. Actual performance was 52% Measure 4: 36% of students will exceed standards on CRCT English/Language Arts Assessment. Actual performance was 70% Measure 5: 18% of students will exceed standards on 5th Grade Writing assessment. Actual performance was 31%. Grade 6: Measure 1: 32% of students will exceed standards on CRCT Science Assessment. Actual performance was 15% Measure 2: 30% of students will exceed standards on CRCT Math Assessment. Actual performance was 15% Measure 3: 48% of students will exceed standards on CRCT Reading Assessment. Actual performance was 15% Measure 4: 48% of students will exceed standards on CRCT English/Language Arts Assessment. Actual performance was 39%
- 3. KCSMA CRCT 3rd Grade 4th Grade 5th Grade 6th Grade Schoolwide 2011 2012 CHANGE 2011 2012 CHANGE 2011 2012 CHANGE 2011 2012 CHANGE 2011 2012 CHANGE Reading: % Met or Exceeded 92 92 0 97 96 -1 98 100 2 97 100 3 96 97 1 the standard ELA: % Met or Exceeded the 91 93 2 97 98 1 100 100 0 94 100 6 95.5 97.75 2.25 standard Math: % Met or Exceeded the 79 89 10 87 85 -2 98 97 -1 81 97 16 86.25 92 5.75 standard Science: % Met or Exceeded 69 85 16 97 96 -1 93 92 -1 91 92 1 87.5 91.25 3.75 the standard Social Studies: % Met or 79 92 13 97 94 -3 87 97 10 84 97 13 86.75 95 8.25 Exceeded the standard
- 4. CRCT Comparison Reading: % Met or ELA: % Met or Exceeded Math: % Met or Science: % Met or Social Studies: % Met or Exceeded the standard the standard Exceeded the standard Exceeded the standard Exceeded the standard 2011 2012 2011 2012 2011 2012 2011 2012 2011 2012 3rd Grade KCSMA 92 92 91 93 79 89 69 85 79 92 Big Shanty 96 94 94 93 83 80 91 86 87 85 Hayes 88 89 86 92 73 79 74 72 66 82 Cobb County 92.5 92.8 90.5 92.4 83.5 84.2 82.8 81.2 80.7 83.4 Georgia 90.9 90.6 89.1 90.5 81.2 81 80.5 78.1 81 81 4th Grade KCSMA 97 96 97 98 87 85 97 96 97 94 Big Shanty 95 94 95 93 88 82 89 90 92 90 Hayes 82 93 81 93 77 81 75 82 68 76 Cobb County 90.4 93.7 90.3 93.6 85 85 82.4 85.2 79.4 82.1 Georgia 87.9 90.2 88 90.9 81.1 80.2 79 80.8 77.4 78.4 5th Grade KCSMA 98 100 100 100 98 97 93 92 87 97 Big Shanty 95 96 94 97 90 88 83 81 79 85 Hayes 86 91 89 95 84 83 70 72 60 62 Cobb County 93.2 94.4 94.7 95.6 91.1 90.9 80.5 82.1 74.2 80.6 Georgia 90.5 91.5 93 94.4 86.6 83.7 76.6 78 71.3 76.6 6th Grade KCSMA 97 100 94 100 81 97 91 92 84 97 Cobb County 95.7 97.8 93.4 94.4 81.9 85.6 77.4 80 76.4 79.7 Georgia 93.9 96 91.2 92.1 76.4 79.9 70.9 72.6 71.6 73
- 5. Iowa Test of Basic Skills Reading: % Met or ELA: % Met or Math: % Met or Combined: % Met Exceeded the Exceeded the Exceeded the or Exceeded the standard standard standard standard 2011 2012 2011 2012 2011 2012 2011 2012 3rd Grade KCSMA 58 63 60 59 59 69 59 64 Big Shanty 69 63 70 60 72 68 70.3 63.6 Hayes 53 52 51 46 57 52 53.6 50 Cobb County 63 63 65 65 68 69 65.3 65.6 5th Grade KCSMA 74 77 74 80 61 68 69.6 75 Big Shanty 64 66 68 70 70 72 67.3 69.3 Hayes 52 52 59 57 62 53 57.6 54 Cobb County 61 63 67 69 67 70 65 67.3
- 6. 5th Grade Writing Assessment 2011 2012 Meets & Meets & Exceeds Exceeds Exceeds Exceeds KCSMA 96% 11% 99% 30% Big Shanty 88% 15% 90% 15% Hayes 77% 60% 76% 4% Cobb County 83% 12% 84% 14% Georgia 79% 10% 81% 11%