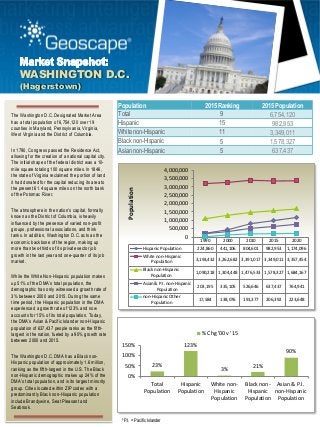
While the White Non-Hispanic population makes up 51% of the Washington D.C. DMA’s total population, the demographic has only witnessed a growth rate of 3% between 2000 and 2015. During the same time period, the Hispanic population in the DMA experienced a growth rate of 123% and now accounts for 15% of its total population. Today, the DMA’s Asian & Pacific Islander non-Hispanic population of 637,437 people ranks as the fifth-largest in the nation, fueled by a 90% growth rate between 2000 and 2015.
The Washington D.C. DMA has a Black non-Hispanic population of approximately 1.6 million, ranking as the fifth-largest in the U.S. The Black non-Hispanic demographic makes up 24% of the DMA’s total population, and is its largest minority group. Cities located within ZIP codes with a predominantly Black non-Hispanic population include Brandywine, Seat Pleasant and Seabrook.
Beginners Guide to TikTok for Search - Rachel Pearson - We are Tilt __ Bright...
Geoscape Market Snapshot: Washington D.C.
1. WASHINGTON D.C.
(Hagerstown)
The Washington D.C. Designated Market Area
has a total population of 6,754,120 over 19
counties in Maryland, Pennsylvania, Virginia,
West Virginia and the District of Columbia.
In 1790, Congress passed the Residence Act,
allowing for the creation of a national capital city.
The initial shape of the federal district was a 10-
mile square totaling 100 square miles. In 1846,
the state of Virginia reclaimed the portion of land
it had donated for the capital reducing its area to
the present 61.4 square miles on the north bank
of the Potomac River.
The atmosphere in the nation’s capital, formally
known as the District of Columbia, is heavily
influenced by the presence of varied non-profit
groups, professional associations, and think
tanks. In addition, Washington D.C. acts as the
economic backbone of the region, making up
more than two-thirds of its private sector job
growth in the last year and one-quarter of its job
market.
While the White Non-Hispanic population makes
up 51% of the DMA’s total population, the
demographic has only witnessed a growth rate of
3% between 2000 and 2015. During the same
time period, the Hispanic population in the DMA
experienced a growth rate of 123% and now
accounts for 15% of its total population. Today,
the DMA’s Asian & Pacific Islander non-Hispanic
population of 637,437 people ranks as the fifth-
largest in the nation, fueled by a 90% growth rate
between 2000 and 2015.
The Washington D.C. DMA has a Black non-
Hispanic population of approximately 1.6 million,
ranking as the fifth-largest in the U.S. The Black
non-Hispanic demographic makes up 24% of the
DMA’s total population, and is its largest minority
group. Cities located within ZIP codes with a
predominantly Black non-Hispanic population
include Brandywine, Seat Pleasant and
Seabrook.
Population 2015 Ranking 2015 Population
Total 9 6,754,120
Hispanic 15 982,953
White non-Hispanic 11 3,349,011
Black non-Hispanic 5 1,578,327
Asian non-Hispanic 5 637,437
1990 2000 2010 2015 2020
Hispanic Population 224,860 441,106 804,601 982,953 1,174,096
White non-Hispanic
Population
3,193,432 3,262,682 3,391,017 3,349,011 3,357,454
Black non-Hispanic
Population
1,090,218 1,304,448 1,476,533 1,578,327 1,684,167
Asian & P.I. non-Hispanic
Population
203,195 335,105 526,646 637,437 764,941
non-Hispanic Other
Population
17,584 138,076 191,377 206,392 223,648
0
500,000
1,000,000
1,500,000
2,000,000
2,500,000
3,000,000
3,500,000
4,000,000
Population
23%
123%
3%
21%
90%
0%
50%
100%
150%
Total
Population
Hispanic
Population
White non-
Hispanic
Population
Black non-
Hispanic
Population
Asian & P.I.
non-Hispanic
Population
% Chg '00 v '15
*P.I. = Pacific Islander
2. WASHINGTON D.C.
(Hagerstown)
15%
51%
24%
10%
Hispanic Population White non-Hispanic Population
Black non-Hispanic Population Asian & P.I. non-Hispanic Population
Salvadoran, 31%
Mexican, 24%
Puerto Rican,
8%
Guatemalan,
7%
Peruvian,
5%
Dominican, 4%
Other, 22%
Nearly 40% of the Hispanic
population in the DMA originates
from Central America, as 31% is
from El Salvador and 7% is from
Guatemala.
18%
25%
29%
19%
9%
Black Socioeconomic Status A (2015)
Black Socioeconomic Status B (2015)
Black Socioeconomic Status C (2015)
Black Socioeconomic Status D (2015)
Black Socioeconomic Status E (2015)
Percent Black Households
by SES Level
Nearly 50% of Black households
earn an annual income between
$15,000 and $75,000.
3. WASHINGTON D.C.
(Hagerstown)
P. 888.211.9353 | E. geoscape@geoscape.com | URL. www.geoscape.com
Source: Geoscape American Marketscape DataStream™ and/or Consumer Spending Dynamix™ Series 2014
The Designated Market Area (DMA) boundaries are defined by Nielsen.
Socio-Economic Status (SES) is a Geoscape proprietary Culture
Code® that comprises a blend of income, education, occupation and
housing characteristics. SES helps identify consumer purchasing
power and preferences.
Households are grouped into common segments as an A-E index or
percentile ranking (values 1-100) by ZIP Code, Census Tract or
Block Group. “A” and “100” are the highest levels of socioeconomic
status while “E” and “1” are lowest levels.
At the center of Washington D.C., resides
a large concentration of Blacks in the
SES D strata, which consists of
households with an annual income
between $15,000 and $35,000.