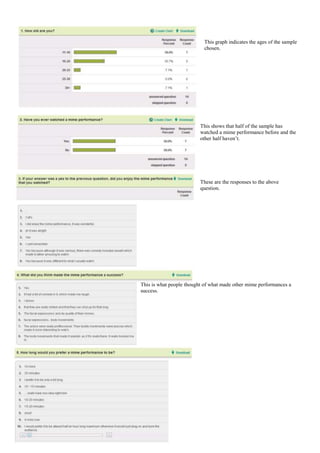
1. 76835-33274000This graph indicates the ages of the sample chosen.<br />762006604000<br />This shows that half of the sample has watched a mime performance before and the other half haven’t.<br />-44005502730500<br />These are the responses to the above question.<br />76200190500<br />7683532448500<br />This is what people thought of what made other mime performances a success.<br />742954191000<br />-3810-43751500<br />-44196008064500<br />-517715517335500<br />