Downloaded 374 times
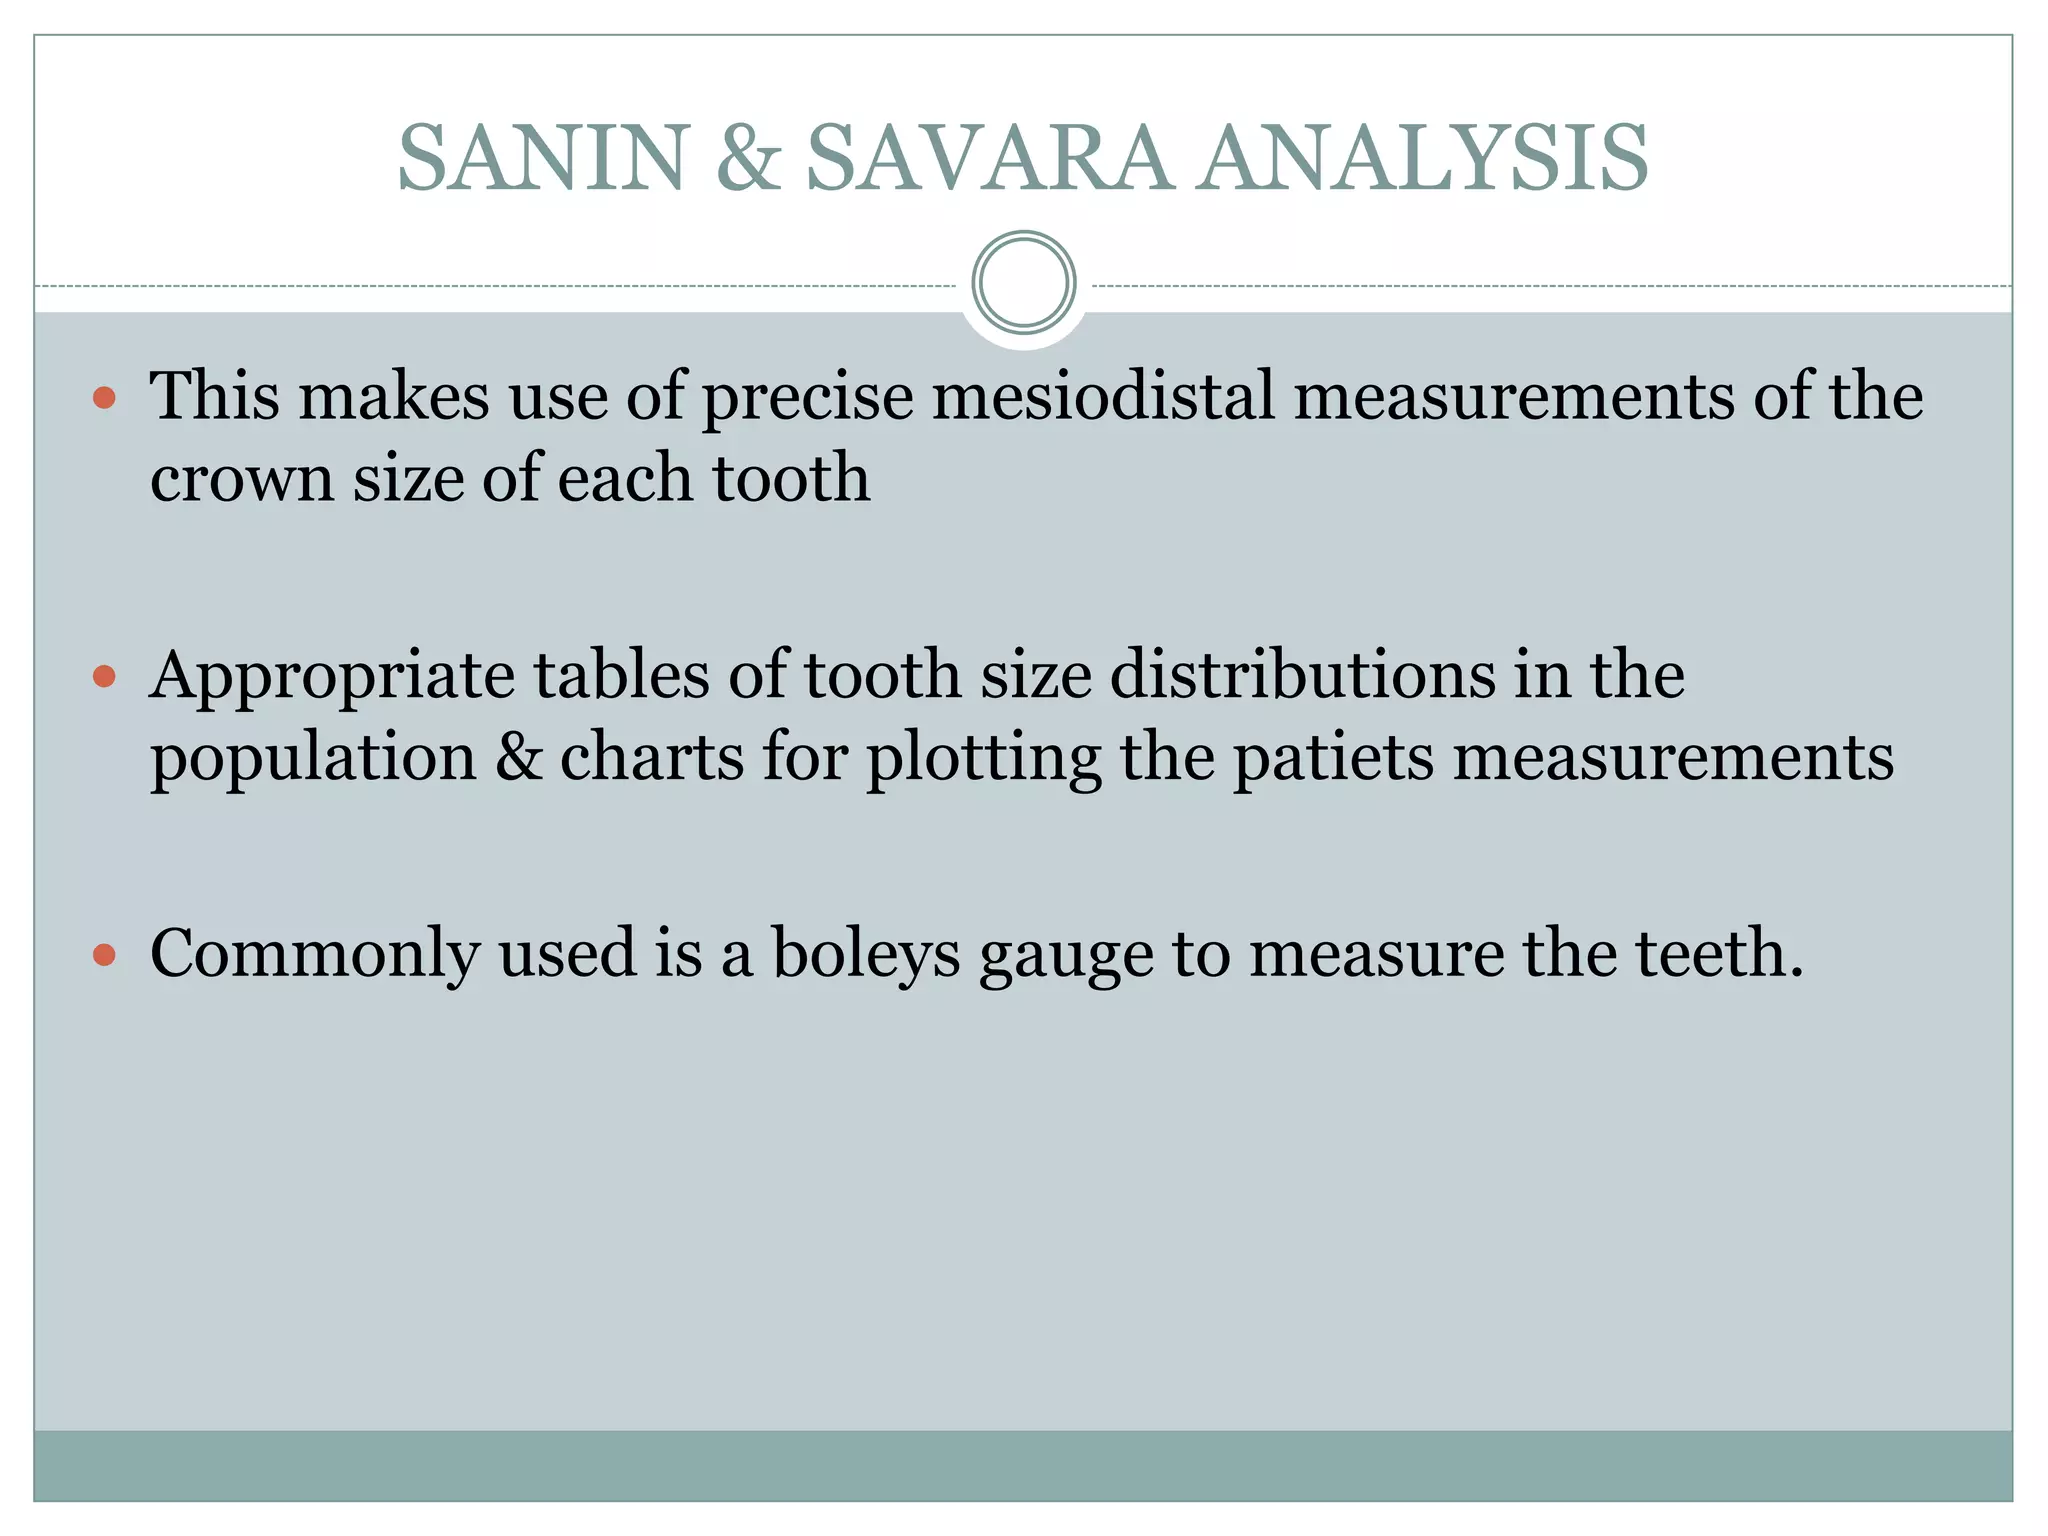
![ sum of mandibular incisors + 10.5
2
( for mand. canine & pm)
sum of maxillary incisors + 11
2
(for max. canine & pm)
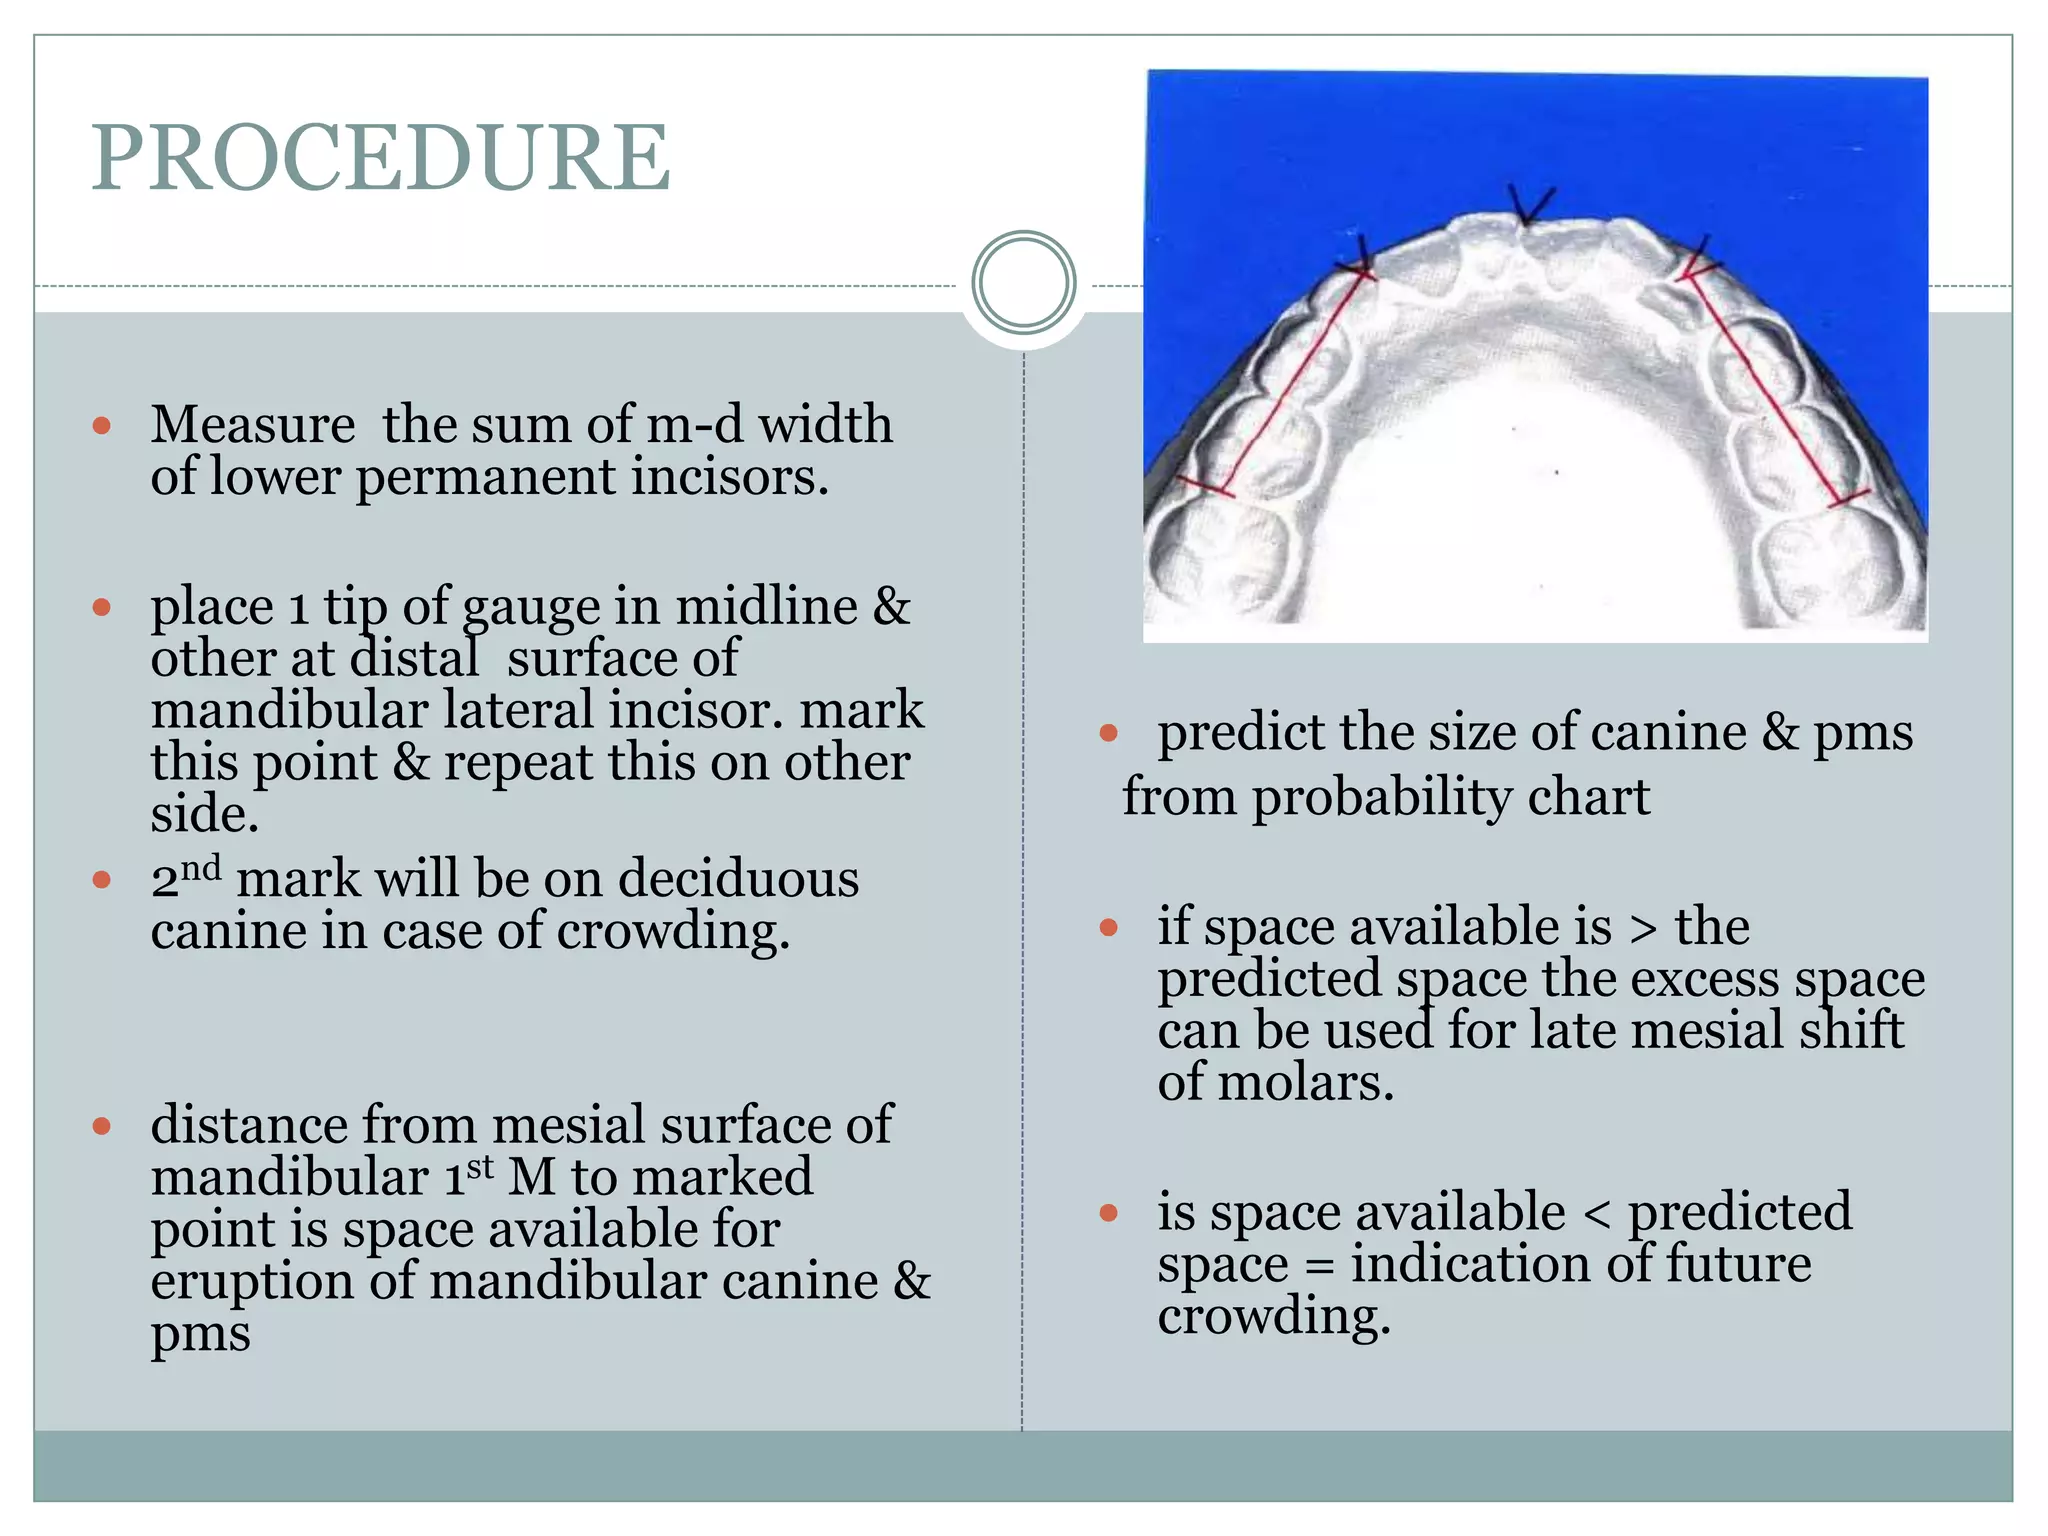
Space available = total arch length – [ sum of lower incisors
+ 2 x ( calculated width of canine and premolars)]](https://image.slidesharecdn.com/modelanalysis-200119074813/75/Model-analysis-in-orthodontics-13-2048.jpg)


The document discusses various model analysis techniques used in orthodontics for diagnosing and planning treatment for malocclusion, including mixed dentition analyses and specific methodologies like Moyers, Tanaka & Johnston, and Bolton's analysis. It highlights the importance of accurately reproducing dental casts for reliable assessments and outlines advantages and disadvantages of each analysis method. Additionally, it covers the diagnostic setup and total space analysis which aid in treatment planning and visualizing tooth movements.


