1. INFORMATION OVERLOAD AND KNOWLEDGE ECONOMY
INTRODUCTION
Information overload is not a new phenomenon, but it has existed since information
became an important input to any human activity. The scientific disciplines began to
clearly emerge from 17th to 19th century and it gradually became impossible for anyone
to have a clear overview of all of the scientific work of that time that had been declared
as ‘natural philosophy’. Later on in the 20th century, the explosion of information
outputs in the form of journal papers, patents, books, disertations and other types of
‘grey’ literature is continiued. It gained even more force in the period immediately after
the Second World War as a result of intensive studies of formerly secret information from
both sides involved. Paradoxically, the Second World War as destructive as it was it had
also a very strong impact on science and technology development as well. We can count
first years after it as the birth period of information science.
Since then, the faster exponential growth of information sources and outputs in any
different forms has been noticed and scientific journals and abstracting journals have
constituted a part of them. The main reasons of the increasing amount of information
have been:
there is a general increase in business communication. Competition between
-
business subjects forced them to consider some new trends as globalisation is,
which has been resulted as development of new media and networking
technologies, More outsourcing means a wide range of specific needs to
communicate.
PC explosion on the 70s of 20th century changed circumstances for use of
-
electronic data. In 1971, Intel released the first microprocessor. The
microprocessor was a specialized integrated circuit which was able to process
four bits of data at a time. IBM developed the famous IBM PC and brought
computers to user’s homes. Later on Apple released the first generation
Macintosh, which was the first computer to come with a graphical user
interface (GUI) and a mouse. The GUI made the machine much more
attractive to home computer users because it was easy to use.
The development of the World Wide Web (WWW) has also been one of the the
-
key points of the end of 20th century information overload. Increasing number
of web servers, new multimedia file types as well as a growth of a web end
users has dramatically changed the global business landscape as well as
scientific part of them too.
2. Mostly all bibliographic services have been moved from classical library
-
systems to the new environment of the WWW. For scientists and other users
bibliographic information became accessible directly without any mediator as
librarians mostly had been up to then. The new role of librarians has been
noticed. They became databases and information service managers taking care
to provide direct access to the information sourceces to them users as well as
teachers of information literacy.
Part of the problem is caused by the fact that technological advances have
-
made the retrieval, production and distribution of information so much easier
than in earlier periods. The result is an explosion of very often irrelevant,
unclear and inaccurate information, making pulling relevant information ever
very difficult and frustrating.
2 TODAY'S CIRCUMSTANCES ON A FIELD OF INFORMATION SCIENCE
For better performance about todays extremly faster development of information science
and computing let's take a look at statistical data about amount of informations, that
they are produced every year. Very interesting study called quot;How Much Informationquot;
produced by faculty and students at the School of Information Management and Systems
at the University of California at Berkeley estimated the world's total yearly production of
print, film, optical, and magnetic content as 1.5 billion gigabytes of storage. This is the
equivalent of 250 megabytes per person for each man, woman, and child on earth
(source: URL http://www.sims.berkeley.edu/research/projects/how-much-
info/index.html).
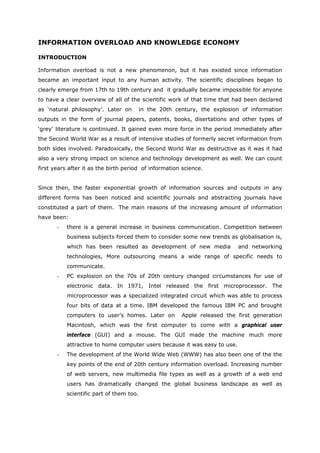
Figure 1: Hard drive cost per gigabyte (URL
http://www.sims.berkeley.edu/research/projects/how-much-info/index.html)
3. The term Global Disk Storage per Person (GDSP) is defined as the amount of hard disk
drive space sold in a year. It measure the potential amount of disk drive storage that
could be used to store information on individuals. Below is a graph of GDSP over time.
Figure 2: GDSP over Time (source: Sweeney, 2001)
Table 1: GDSP over Time (source: Sweeney, 2001)
1983 1996 2000
Global storage (terabytes) 90 Tb 2,829,288 Tb
160,623 Tb
Storage per person (GDSB) 0.02 Mb 28 Mb 472 Mb
Figure 3: Number of Internet hosts (source: Zakon, 2005)
4. Figure 4: Growth of World Wide Web (WWW) (source: Zakon, 2005)
Figure 4: Growth of Internet domains (source: Zakon, 2005)
All of figures show that period near 1995 was extremly important in electronic data
production and personal computers usage. We can explain this with a brief overview of
history of Internet,
The first World Wide Web (WWW) server/client application was created by Tim Berners
Lee in Cern, the world's largest particle physics laboratory in Geneva/Switzerland in
1989 as local system for data exchange. He invented special list of tags for marking pure
texta data into special form that was called hypertext and list of tags was called
Hypertext Markup Language (HTML). By 1991 client and web server software was
available, and by 1992 a few preliminary WWW sites existed in academic places. On
April 30, 1993 CERN's directors made a statement that was a true milestone in history of
information. On this day, they declared that WWW technology would be freely usable by
anyone, with no fees being payable to CERN.
The next key point in developing WWW was when Marc Andreessen from the University
of Illinois developed a graphical user interface to the WWW, called quot;Mosaicquot; on which
5. multimedia plug-ins were incorporated. WWW started becoming interesting for
commercial sphere. Later on Andressen became head of Netscape Corporation which
developed the first real usefull WWW client, well known Netscape Communicator with
many multimedia plug-ins. Then we really started to see growth. Every year from 1994
to 2000, the Internet noticed massive and explicitly exponentlly growth.
As a result of WWW developing and commercial sphere involving telecommunications and
networks begun to develop rapidly.
Late in the 80's 56-kbps modems were available for communication over standard
telephone lines
In 1990, Motorola started to develop low earth orbit communication satellites, known as
the Iridium System. Bell Labs started to develop optical fibres for data transmission. In
1993, Asymmetric Digital Subscriber Lines (ADSL) standardized using the discrete
multitone technique to allow greater services to be provided over the plain old telephone
service.
In 1996 standardization for 1 Gb/s (baud) ethernet begun.
In 1998, an advanced packet-switching network to simultaneously send voice, data, and
video down a single phone line was announced.
In 1998 Ericsson, IBM, Intel, Nokia, and Toshiba started to develop Bluetooth for
wireless data exchange between handheld computers or cellular phones and stationary
computers
Late in 90's, video-teleconferencing and telenetworking begun. and cable modems that
exploit cable television connectivity started as well.
Today, we can not imagine use of Internet without high-speeed 10 Gb/s ethernets, fiber
optic cables, cable television and satellites for TCP/IP data transmission.
6. 3 WORLD INTERNET USAGE
As in many other cases, usage of modern information tools depends of economic
development level of chosen country or world region.
Table 2: World Internet usage and population statistics (URL
http://www.internetworldstats.com/)
Population Population Internet Usage, Usage Growth Penetration World
World Regions
( 2005 Est.) % of World Latest Data 2000-2005 (% Population ) Users %
Africa 900,465,411 14.0 % 13,468,600 198.3 % 1.5 % 1.5 %
Asia 3,612,363,165 56.3 % 302,257,003 164.4 % 8.4 % 34.0 %
Europe 730,991,138 11.4 % 259,653,144 151.9 % 35.5 % 29.2 %
Middle East 259,499,772 4.0 % 19,370,700 266.5 % 7.5 % 2.2 %
North America 328,387,059 5.1 % 221,437,647 104.9 % 67.4 % 24.9 %
Latin
546,917,192 8.5 % 56,224,957 211.2 % 10.3 % 6.3 %
America/Caribbean
Oceania / Australia 33,443,448 0.5 % 16,269,080 113.5 % 48.6 % 1.8 %
WORLD TOTAL 6,412,067,185 100.0 % 888,681,131 146.2 % 13.9 % 100.0 %
Methodology of presentation shows some important parameters: Penetration means
portion of population using Internet. World Users means portion of users in entire world
usage and it can be compared with portion of world population for choosen region or
country.
We can see, that usage of Internet closely correlate with economic development level of
some world region. Increase of use of Internet is prominent in Asian states, which also
corresponds with trends in economic development in that region.
In Asia (table 3), we can noticed intensely usage of Internet in the most developed
countries as Japan, South Corea, Hong Kong, Singapore and Malysa as well. In China
very high increasing is noticed.
Statistical data for Europe (table 4 and table 5) shows very intensely usage of Internet
in the European Union. Summary of usage in this countries shows that EU Internet users
represent allmost fourth of all users of Internet in the world. Statistical data of EU usage
also show very high penetration level of penetretaion in all of EU countries. Table 6
confirms our anticipation of closely correlation betwen economic development and
intensity of Internet usage as well.
In future very faster growth of using Internet is expected in Asia as well as difference
betwen less and more developed countries will be increased exponently.
8. Table 4: Internet usage in Europe (URL http://www.internetworldstats.com/)
Population % Pop. Internet Users, Use Growth Penetration % Usage
EUROPE
( 2005 Est. ) of World Latest Data (2000-2005) (% Population) of World
European Union 459,938,780 7.1 % 215,765,036 131.6 % 46.9 % 24.3 %
Rest of Europe 271,052,358 4.3 % 43,888,108 341.9 % 16.2 % 4.9 %
TOTAL EUROPE 730,991,138 11.4 % 259,653,144 151.9 % 35.5 % 29.2 %
Rest of World 5,681,076,047 88.6 % 629,027,987 143.9 % 11.1 % 70.8 %
TOTAL WORLD 6,412,067,185 100.0 % 888,681,131 146.2 % 13.9 % 100.0 %
Table 5: Internet usage in the European Union (URL http://www.internetworldstats.com/)
EUROPEAN Population Internet Users, User Growth Penetration % Users
UNION ( 2005 Est. ) Latest Data (2000-2005) (% Population) in EU
Austria 8,163,782 4,630,000 120.5 % 56.7 % 2.1 %
Belgium 10,443,012 5,100,000 155.0 % 48.8 % 2.4 %
Cyprus 950,947 250,000 108.3 % 26.3 % 0.1 %
Czech Republic 10,230,271 3,530,000 253.0 % 34.5 % 1.6 %
Denmark 5,411,596 3,720,000 90.8 % 68.7 % 1.7 %
Estonia 1,344,840 621,000 69.4 % 46.2 % 0.3 %
Finland 5,246,920 3,260,000 69.2 % 62.1 % 1.5 %
France 60,293,927 24,848,009 192.3 % 41.2 % 11.5 %
Germany 82.726,188 46,312,662 93.0 % 56.0 % 21.5 %
Greece 11,212,468 3,800,000 280.0 % 33.9 % 1.8 %
Hungary 10,083,477 3,050,000 326.6 % 30.2 % 1.4 %
Ireland 4,027,303 2,060,000 162.8 % 51.2 % 1.0 %
Italy 58,608,565 28,610,000 116.7 % 48.8 % 13.3 %
Latvia 2,306,489 936,000 524.0 % 40.6 % 0.4 %
Lithuania 3,430,836 695,000 208.9 % 20.3 % 0.3 %
Luxembourg 455,581 170,000 70.0 % 37.3 % 0.1 %
Malta 384,594 120,000 200.0 % 31.2 % 0.1 %
Netherlands 16,316,019 10,806,328 177.1 % 66.2 % 5.0 %
Poland 38,133,891 10,600,000 278.6 % 27.8 % 4.9 %
Portugal 10,463,170 3,600,000 44.0 % 34.4 % 1.7 %
Slovakia 5,379,455 1,820,000 180.0 % 33.8 % 0.8 %
Slovenia 1,956,916 800,000 166.7 % 40.9 % 0.4 %
Spain 43,435,136 14,590,180 170.8 % 33.6 % 6.8 %
Sweden 9,043,990 6,656,716 64.4 % 73.6 % 3.1 %
United Kingdom 59,889,407 35,179,141 128.4 % 58.7 % 16.3 %
European Union 459,938,780 215,765,036 131.6 % 46.9 % 100.0 %
9. Table 6: Top 24 Countries with the highest Internet penetration rate (URL
http://www.internetworldstats.com/)
Penetration Internet Users Population Source and Date
# Country or Region
(% Population) Latest Data ( 2005 Est. ) of Latest Data
1 Sweden 73.6 % 6,656,716 9,043,990 Nielsen//NR Feb./05
2 Hong Kong 69.9 % 4,878,713 6,983,938 Nielsen//NR Feb./05
3 Denmark 68.7 % 3,720,000 5,411,596 C.I.Almanac - Mar./05
4 Norway 68.3 % 3,140,000 4,600,644 C.I.Almanac - Mar./05
5 United States 67.8 % 200,933,147 296,208,476 Nielsen//NR Feb./05
6 Australia 66.4 % 13,611,680 20,507,264 Nielsen//NR Feb./05
7 Netherlands 66.2 % 10,806,328 16,316,019 Nielsen//NR Jun./04
8 Iceland 66.1 % 195,000 294,947 ITU - Dec./03
9 Canada 63.8 % 20,450,000 32,050,369 C.I.Almanac - Dec/03
10 Korea, (South) 63.3 % 31,600,000 49,929,293 KRNIC - Dec/04
11 Switzerland 62.9 % 3,375,850 7,452,101 Nielsen//NR Feb./05
12 Finland 62.1 % 3,260,000 5,246,920 C.I.Almanac - Mar./05
13 Singapore 60.2 % 2,135,000 3,547,809 ITU - Sept/04
14 United Kingdom 58.7 % 35,179,141 59,889,407 Nielsen//NR Feb./05
15 Liechtenstein 57.3 % 20,000 34,927 CIA - Dec./02
16 New Zealand 56.8 % 2,340,000 4,122,609 C.I.Almanac - Mar./05
17 Austria 56.7 % 4,630,000 8,163,782 C.I.Almanac - Mar./05
18 Germany 56.0 % 46,312,662 82,726,188 Nielsen//NR Feb./05
19 Bermuda 54.0 % 34,500 63,849 ITU - Dec./03
20 Taiwan 53.5 % 12,200,000 22,794,795 FIND - Dec./04
21 Japan 52.8 % 67,677,944 128,137,485 Nielsen//NR Nov./04
22 Croatia 52.0 % 2,318,240 4,459,137 ITU - Sept/04
23 Ireland 51.2 % 2,060,000 4,027,303 C.I.Almanac - Mar./05
24 Faroe Islands 50.7 % 25,000 49,329 CIA - Dec./02
TOP 24 in Penetration 62.0 % 478,872,849 772,062,177 IWS - Mar.25/05
Rest of the World 7.3 % 409,808,282 5,640,005,008 IWS - Mar.25/05
World Total Users 13.9 % 888,681,131 6,412,067,185 IWS - Mar.25/05
5 CONCLUSION
It is generally well known that knowledge has become a third major factor of production,
in addition to the traditional factors - labour and capital. Information technology
production is a significant factor in the knowledge economy.
Developing countries take a risk to left behind as a result of increasing importance of
knowledge and of widening knowledge divide with advanced countries. They need to
became quot;knowledge economiesquot;. Knowledge economy means economy with effective use
10. of knowledge for economic and social development. Knowledge economy is combined
into frame of four key functional areas:
1. Authority, economic and institutional regime that provide incentives for efficient
use of existing and newcoming knowledge without any political, historical,
religious or similar predjudices.
2. Educated, skilled and creative people.
3. Quality and good enough information infrastructure.
4. Efficient national innovation system.
Knowledge Economy Index (KEI) is the average of the performance scores of a
chosen country or region in all of four key functionality areas o(Institutional
Incentive Regime, education, innovation and information communications and
technology).
Figure 4: Knowledge Economy Index (source:Dahlman, 2004)
11. In 1st July 1999, the Declaration on Science and the Use of Scientific Knowledge was
adopted by the UNESCO World Conference on Science, which declareed science and
knowledege as essential rigt of all cultures and nations.
But, increasing economic difference betwen poor and rich countries causes the
differenece on a field of a knowledge. And, if we know, that all mentioned figures mostly
grow exponently, we can concluse, that difference will have dramatic extension very
soon.
6 LITERATURE
Data Powers of Ten [online]. 2004, obnovljeno 2005-05-06 [citirano 2005-05-06].
Dostopno na svetovnem spletu :
<http://www.kcl.ac.uk/humanities/cch/ma/courses/acmmet/data-powers-of-ten.htm>
How Much Information [online]. 2003, obnovljeno 2005-05-06 [citirano 2005-05-06].
Dostopno na svetovnem spletu : <http://www.sims.berkeley.edu/research/projects/how-
much-info/index.html>
Internet World Stats [online]. 2005, obnovljeno 2005-05-06 [citirano 2005-05-06].
Dostopno na svetovnem spletu : <http://www.internetworldstats.com/>
Dahlman, Karl. 2004. Knowledge Strategies for Development: Challenges for Korea
[online]. KEDI WB Workshop:Balanced Regional Development and the Role of Higher
Education, 2005-05-06 [citirano 2005-05-06]. Dostopno na svetovnem spletu :
<http://www1.worldbank.org/education/tertiary/ppt/Korea%20KEDI%20WB%20Pohang
%20%20Dahlman%2002-23-2004.ppt >
Sweeney, Latanya. 2001. Information Explosion [online]., 2005-05-06 [citirano 2005-05-
06]. Dostopno na svetovnem spletu :
<http://privacy.cs.cmu.edu/people/sweeney/explosion2.pdf>
12. APPENDIX A: Description of units in computing (source: URL
http://www.kcl.ac.uk/humanities/cch/ma/courses/acmmet/data-powers-of-ten.html)
1,000 bytes OR 103bytes
Kilobyte (KB)
2 Kilobytes: A typewritten page.
100 Kilobytes: A low-resolution photograph.
1,000,000 bytes OR 106 bytes
Megabyte (MB)
1 Megabyte: A small novel OR a 3.5 inch floppy disk.
2 Megabytes: A high-resolution photograph.
5 Megabytes: The complete works of Shakespeare.
10 Megabytes: A minute of high-fidelity sound.
100 Megabytes: 1 meter of shelved books.
500 Megabytes: A CD-ROM.
1,000,000,000 bytes OR 109 bytes
Gigabyte (GB)
1 Gigabyte: a pickup truck filled with books.
20 Gigabytes: A good collection of the works of Beethoven.
100 Gigabytes: A library floor of academic journals.
1,000,000,000,000 bytes OR 1012 bytes
Terabyte (TB)
1 Terabyte: 50000 trees made into paper and printed.
2 Terabytes: An academic research library.
10 Terabytes: The print collections of the U.S. Library of Congress.
400 Terabytes: National Climactic Data Center (NOAA) database.
1,000,000,000,000,000 bytes OR 1015 bytes
Petabyte (PB)
1 Petabyte: 3 years of EOS data (2001).
2 Petabytes: All U.S. academic research libraries.
20 Petabytes: Production of hard-disk drives in 1995.
200 Petabytes: All printed material.
1,000,000,000,000,000,000 bytes OR 1018 bytes
Exabyte (EB)
2 Exabytes: Total volume of information generated in 1999.
5 Exabytes: All words ever spoken by human beings.