SlideShare a Scribd company logo
1 of 39
Download to read offline
Forex Chart Patterns – for profitable trading
In Forex Market, the chart pattern plays a big role to predict the future movement of
the market in an easy way.
One of the main parts of Technical analysis is Chart Patterns. It is an easy trading
skill if you practice more with different market charts. Become Professional trader
using the below technical chart patterns.
♦ Head and Shoulders pattern
♦ Triangle patterns
♦ Pennants
♦ Flag
♦ Rectangle
♦ Wedge
♦ Double Top & Double Bottoms
♦ Triple Top and Triple Bottoms
♦ Disadvantages of Trading Chart Patterns
What are Chart Patterns?
The set of shapes like Triangle shape, Rectangle shape, Dual top, Dual Bottom, and
many other shapes formed in the price charts is known as chart patterns.
A Chart Pattern shapes are printed on all the market charts at any time. Traders
keep watching the price chart to find the patterns. Once the trader found a pattern,
then it will give the signal on where the price is going to move next?
The complexity of trading necessitates a keen eye and a sharp mind, but one thing
that can make it easier for both seasoned professionals and beginners is having a
trading patterns cheat sheet.
Identifying the pattern shapes in the chart is very easy by using simple tools such as
horizontal lines, trend lines, Equidistant Channel lines, etc. Let’s see different types
of chart patterns.
Different Types of Forex Chart Patterns
Forex Trading patterns are divided into 3 types depending on the market trend such
as uptrend, downtrend, Neutral trend(Ranging).
1) Continuation Chart Patterns
2) Reversal Chart Patterns
3) Neutral Chart Patterns
Continuation Chart Patterns
Continuation chart pattern appears when the market is moving in an Uptrend or
Downtrend. You can spot this pattern during the price correction or retracement
happening in a trending market.
For example: If the market is moving in an Uptrend, then it stops at some price and
starts to move down which is against the trend. During this time, you can identify the
continuation chart patterns.
Most popular continuation pattern charts are Pennants, Rectangles and Corrective
Wedges.
Pennants
Pennants shape formed in the chart during the strong trend. The market takes a
small break during the trend and it forms a pennant pattern in the chart.
Pennant looks like the shape of the symmetrical triangle, as both triangle and
pennant are bound by trendline support and resistance lines. The difference is that
pennant appears during the trend, but triangles can be formed during both trends
and general consolidation periods.
Pennants could be bearish or bullish depending on the trend direction. When a
pennant occurs during a trend, it has the potential to push the price in the direction of
the overall trend.
How to trade pennants?
Wait for a breakout of the Pennant pattern to enter into the trade.
If the pennant is formed, the minimum take profit target should be the number of pips
moved in the first wave of the pennant as shown in the chart picture.
After a breakout, the distance of the first wave inside the pennant should be your
minimum take profit target.
Flag Pattern
Flag pattern is similar to pennant pattern. Whatever rules applied in pennant chart
pattern applies to flag pattern too.
Flag charting patterns can be formed during the retracement of the trend.
The only difference between flag and pennant is, Flag looks like a small channel
(parallel lines) in a trend.
Rectangle Chart Pattern
Rectangle shape formed in the chart when the market is moving up and down
between horizontal support and resistance levels. The market takes a long break
from the trend move and it keeps moving up and down between the certain price
level.
During a trend, when the price starts moving sideways forming a rectangle, another
trending move is likely to occur once price eventually breaks out of the rectangle
formation. This move is likely to be at least as big as the size of the rectangle.
Rectangles could be bearish or bullish depending on the trend direction.
How to trade Rectangle?
You can take short term trades in the Rectangle pattern. If the market reaches the
bottom support of the rectangle, you can place buy trade. If the market reaches the
Top of the resistance, you can place a sell trade.
Wait for a breakout of the Rectangle pattern to enter into the trade.
Note: Always keep placing the trade depend on the trend. Example: If the market
moving in an Uptrend, place only sell trade after breakout confirmed at the Bottom
Support of the Rectangle.
How to confirm the breakout in trading? check here.
After a breakout, the distance of the first wave inside the rectangle should be your
minimum take profit target.
Wedge Chart Pattern
When the market forms higher highs and higher lows in a narrow path, it is known as
a rising wedge. A rising wedge will form either in uptrend or downtrend.
When the Market forms Lower highs and Lower Lows in a narrow path, it is known
as a falling wedge. A falling wedge will form either in uptrend or downtrend.
Wedge Pattern forms during both trend continuation and at the Trend Reversal.
Trend Continuation Wedge is called Corrective Wedge Pattern.
Trend Reversal Wedge is called Reversal Wedge Pattern.
How to identify Corrective or Reversal Wedge?
Corrective Wedge pattern is a correction that happened during the trend which forms
a Wedge Shape in the Chart.
Reversal Wedge pattern is similar to Corrective Wedge, the only difference is Market
will start to reverse after forming the wedge. Whereas In Corrective Wedge, the
market starts to continue the trend.
We may not know whether the wedge is corrective or reversal until it breakout from
that wedge Pattern.
If the breakout happened in the trend direction, Then we can confirm it as Corrective
Wedge.
If the breakout happened against the trend, it means market starts to reverse. Then
we can confirm it as a Reversal Wedge.
How to trade Wedges?
You can take short term trades inside the Wedge pattern at highs and lows of the
Wedge. If the market reaches the bottom of the Wedge, you can place buy trade. If
the market reaches the top of the wedge, you can place a sell trade.
Wait for a breakout of the Wedge pattern to enter into the Long term trade. Stop-loss
should be placed near to highs and lows.
Bonus: Wedge Pattern will breakout mostly at the 4th Touch of the Higher High or
Higher Low. Let’s look out this falling wedge Chart.
I hope you are very clear now on how to trade the wedge pattern. If you have any
questions, please click here to ask now.
Reversal Chart Patterns
Double Top Pattern
It is a reversal pattern in an Uptrend, where market creates exactly two tops on the
same price level.
There are 2 types of Double top
1) Traditional Double Top
If each top gap is within 9 months, then it is called “Traditional Double Top”.
2) Cyclic Double Top
If each top gap is more than 9 months (or) If the time taken to form each top is more
than 9 months, then it is called as “Cyclic Double Top”.
Double Bottom Pattern
It is a reversal pattern in a Downtrend, where market creates exactly two bottoms
on the same price level.
There are 2 types of Double bottom
1) Traditional Double Bottom
If each bottom gap is within 9 months, then it is called “Traditional Double Bottom”.
2) Cyclic Double Bottom
If each bottom gap is more than 9 months (or) If the time taken to form each bottom
is more than 9 months, then it is called as “Cyclic Double Bottom”.
How to Trade Double Top?
If you saw a double top in the chart, wait for the confirmation of breakout at the
recent low level.
After breakout confirms at the recent low level, You can enter into the trade.
The Minimum Double Top Target should be the same as the distance of the previous
high to low as shown in the image
How to Trade Double Bottom?
If you saw a double bottom in the chart, wait for the confirmation of breakout at the
recent high level.
After breakout confirms at the recent high level, You can enter into the trade.
The Minimum Double Bottom Target should be the same as the distance(size) of the
previous Low to high as shown in the image.
Triple Top and Triple Bottom Patterns
Triple Tops and Triple Bottoms are same as Double tops and Double Bottoms. The
only difference is additionally extra one top or bottom formed in the chart.
1) Traditional Triple Top
If each Tops gap is within 9 months, then it is called “Traditional Triple Top”.
2) Cyclic Triple Top
If each Top gap is more than 9 months, then it is called as “Cyclic Triple Top”.
How to Trade Triple Top?
If you saw a Triple top in the chart, wait for the confirmation of breakout at the recent
low level.
After breakout confirms at the recent low level, You can enter into the trade.
The Minimum Triple Top Target should be the same as the distance of the previous
high to low as shown in the image
How to Trade Triple Bottom?
If you saw a Triple bottom in the chart, wait for the confirmation of breakout at the
recent high level.
After breakout confirms at the recent high level, You can enter into the trade.
The Minimum Triple Bottom Target should be the same as the distance(size) of the
previous Low to high, as shown in the image.
Head and Shoulders Pattern
Head and Shoulders Pattern is one of the Top Reliable chart patterns for technical
analyst. It is a strong reversal pattern. If these patterns formed in the chart, Market
definitely needs to reverse.
If you look out the image, you can see the Middle Top looks like a Head and each
side tops look like shoulders. It’s like a Human right?
This is the reason we call this Pattern as Head and Shoulder.
This head and Shoulder pattern is a Reversal Pattern in an Uptrend.
But how about the reversal of downtrend?
It is just opposite of the ordinary head and shoulder pattern.
If the Head and Shoulders formed in the chart in an Inverted shape, it is known as
“Inverted Head and Shoulder”.
It looks like a person doing Yoga Ashtanga Headstand.
If you found this inverted head and shoulders shape in the chart, it confirms the
Reversal pattern in a Downtrend.
How to Trade Head and Shoulders Pattern?
If you saw a Head and Shoulders in the chart, wait for the confirmation of breakout at
the recent low level (Neck level breakout).
Head and shoulders neckline is used to confirm the reversal. If the head and
shoulders neckline break, the reversal will be confirmed. After breakout confirms at
the recent low level (neck level), You can enter into the trade. Let’s see the inverse
head and shoulder chart.
The Minimum Head and Shoulder Take Profit Target should be the same as the
distance(size) of the Head as shown in the image.
Triangle Pattern
Triangle shape formed in the chart when the market is making consolidation or
correction.
The Triangle pattern takes a long time to break out, until that you can keep buying or
selling inside the highs and lows of the triangle.
There are 4 types of Triangle
1) Ascending Triangle
2) Descending Triangle
3) Symmetrical Triangle
4) Expanding Triangle
Ascending Triangle
Ascending Triangle has Higher lows, Equal highs. Ascending Triangle is formed
during the Uptrend or retracement in a downtrend.
Descending Triangle
Descending Triangle has Lower highs and Equal lows. Descending Triangle is
formed during the downtrend or retracement in an Uptrend.
Neutral Chart Pattern
Symmetrical Triangle
Symmetrical Triangle has Lower highs and Higher Lows in a narrow path.
Symmetrical triangles have two sides, which are approximately the same size and
the same angle. This creates a technical force equivalency, which creates the neutral
character of the formation. The image below shows how a symmetrical triangle
appears:
Expanding Triangle
Expanding Triangle is opposite of the Symmetrical Triangle. it has higher highs and
Lower Lows.
How to Trade Triangle Pattern?
You can take short term trades inside the Triangle pattern. If the market reaches the
bottom support of the Triangle line, you can place buy trade. If the market reaches
the Top resistance of the Triangle, you can place the sell trade.
Wait for a breakout of the Triangle pattern to enter into the trade.
Let’s look out the Ascending Triangle and Descending Triangle take profit targets.
How to confirm the breakout in trading? check here.
After a breakout, the distance of the first wave inside the Triangle should be your
minimum take profit target.
Are there any disadvantages when trading with chart
patterns?
Yes there’s some disadvantages of using chart patterns.
1) Watching too many chart patterns in the same market chart creates more
confusion. It makes you think, whether you should trade this pattern or that pattern.
For instance, if you found the triangles pattern and the rectangle pattern in the same
forex chart, You may be confused when to enter and exit the trade.
2) Over drawing on the chart patterns drives you crazy while taking the decision to
enter the trade. Stick with one-time frame first, don’t draw chart patterns more on all
time frames, it gives you idea where the market is moving. But if you want to enter at
good opportunity earlier at best trade setup, you need to look for higher time frame
chart patterns first, next look for lower time frame chart patterns to confirm the
reversal or breakout in the market.
3) Draw chart patterns only at major price levels, don’t focus on drawing patterns in
minor or unimportant price levels.
4) Keep your chart clear while drawing the patterns, if you use indicator or other
forex trading tools in the chart. your chart looks so messy and busy, it will not help
you to pick the trade at the right opportunity instead it makes your mind tired and you
may start to trade unconsciously.
5) Beware of fake breakouts while trading the chart patterns, don’t take any breakout
trade unless the breakout is confirmed. Want to know, how to confirm the breakout or
avoid fake breakout in trading? Click here to see the breakout examples.
6) There are more advantages when comparing to the dis-advantages of chart
patterns. Trade forex chart pattern carefully as per the strategy on “How to trade
chart patterns?” as explained above.
7) Chart patterns are not clear to draw using the candle charts when comparing to
the line chart.
Conclusion
Forex Chart Patterns are used for technical analysis to predict the future movement
of the market.
Chart patterns are divided into three types:
● Continuation Chart Patterns
● Reversal Chart Patterns
● Neutral Chart patterns
The most popular trend continuation patterns chart are:
● Flags
● Pennants
● Rectangles
● Corrective Wedges
The most popular trend reversal chart patterns in forex are:
● Double Top/Double Bottom
● Triple Top/Triple Bottom
● Head and Shoulder
● Reversal Wedges
● Ascending/Descending Triangle
One of the most popular neutral pattern charts is the Symmetrical Triangle. In
Neutral chart patterns, the market may break either up or down. Catching the market
after the confirmation of breakout gives you more profits with small risk.
All these forex chart patterns are traded depend on the reversal price movements
using reversal patterns and price breaks during the continuation chart pattern forex.
Forex Trading Technical Analysis got easier using the forex chart patterns. Trading
chart patterns are easier to identify the future price movement. Whether it is
continuation patterns or reversal patterns or neutral forex chart patterns, all types of
forex trading chart patterns comes under the price action trading journey.
Price action trading is one of the most successful trading strategies in fx trading. The
forex chart formations such as Triangle formations, Wedges form, rising wedge,
falling wedge, price breaks in continuation pattern, head and shoulders chart
formations, reversals pattern confirmation, price consolidation, double bottom chart
pattern forms, Triple bottoms chart formation, Triangle formation is all noticed along
with the candlestick patterns such as bullish engulfing candle price moves, bearish
engulfing candle price move, Morning star, Evening star, pin bar, hanging man, Dojis,
tweezers, hammer, spinning tops, three black crows, three white soldiers, shooting
star are all the best candlestick patterns for all price action traders. The price trend
shows price direction in forex patterns chart.
Whatever forex chart patterns display on your trading platform, Just find out which
type of chart pattern it belongs to whether it is continuation pattern or reversal chart
pattern or Neutral chart pattern. After finding the pattern type, you can trade between
the demand and supply zone for short term entry and exits, if price breaks from the
pattern, you can enter into long term trades.
The progress tracking of identifying the pattern and reviewing it often is very
important to become a professional forex trader. Practice currency trading chart
analysis well with demo account first,
Rising wedge, falling wedge, neckline of head and shoulders line, support and
resistance trading opportunity point the traders with best trading signals setup in the
chart.
Using chart pattern gives great browsing experience for exploring all currency pair
charts such as EUR USD, GBP USD, USD JPY, XAU USD, etc. The perfect chart
formation is visible only if you keep drawing the trendlines, horizontal support and
resistance levels.
For low risk, high reward trading opportunity, the starting point of the price move and
the price direction should be predicted using the trends and the necessary chart
formation. The stop loss order should be smaller and tight to avoid excess loss in
trading.
Check the stop level of the broker to see how much risk you can take with your
leverage option on your trading account. Some brokers offer partner center with high
IB commissions please beware of them. they are stop loss hunters due to high
spread even in major currency pair like EUR USD, USDJPY, GBPUSD.
The stop-loss order line and the ask line should be enabled on your forex broker
platform to know the spread and visible stop loss price.
Forex chart patter with reversal chart and price action strategies help you to trade
important currency pairs such as EUR USD with small risk and high potential trading
signal to make good profits.
The reversals and trend progress market creates heavy demand and momentum in
the markets to bring big movements and insights into the forex charts.
FAQ
What is Cyclic Double Top?
If each top gap is more than 9 months, then it is called as “Cyclic Double Top”.
What is Cyclic Double Bottom?
If each bottom gap is more than 9 months, then it is called as “Cyclic Double
Bottom”.
Which forex chart patterns are best to trade?
Rectangle, Trend line, Channel, pennant, flag, triangle, rising and falling wedge,
head and shoulder are the most used forex chart patterns by professional traders
world wide.
How to trade chart patterns in forex market?
First identify the patterns in the chart. If the market is inside the pattern, you can take
short term trades, if the pattern shape got broken, then you can place a long term
trades to catch big profits.

More Related Content

Similar to How to Trade Chart Patterns with Target and SL@forexgdp.com.pdf

Profit From Pullback Trading
Profit From Pullback TradingProfit From Pullback Trading
Profit From Pullback TradingNetpicksTrading
 
Learn A Simple Range Trading Strategy
Learn A Simple Range Trading StrategyLearn A Simple Range Trading Strategy
Learn A Simple Range Trading StrategyNetpicksTrading
 
Technicalanalysisppt 120809084534-phpapp02
Technicalanalysisppt 120809084534-phpapp02Technicalanalysisppt 120809084534-phpapp02
Technicalanalysisppt 120809084534-phpapp02Deeksha Rathee
 
Portfolio - Technical Analysis
Portfolio - Technical Analysis Portfolio - Technical Analysis
Portfolio - Technical Analysis Kannan Knight
 
Technical anaylsis (day_8)
Technical anaylsis (day_8)Technical anaylsis (day_8)
Technical anaylsis (day_8)Vaibhav Banjan
 
Technical analysis
Technical analysisTechnical analysis
Technical analysismbawbut
 
Profit from trapped traders with 2 simple setups
Profit from trapped traders with 2 simple setupsProfit from trapped traders with 2 simple setups
Profit from trapped traders with 2 simple setupsNetpicksTrading
 
Technically speaking
Technically speakingTechnically speaking
Technically speakingJeay Issac
 
May 20 I Session 1 I GBIH
May 20 I Session 1 I GBIHMay 20 I Session 1 I GBIH
May 20 I Session 1 I GBIHGBIHSupport
 
AnalysisTechnical Analysis PPT @ MBABECDOMS
AnalysisTechnical Analysis PPT @ MBABECDOMSAnalysisTechnical Analysis PPT @ MBABECDOMS
AnalysisTechnical Analysis PPT @ MBABECDOMSBabasab Patil
 
Technical analysis doc
Technical analysis doc Technical analysis doc
Technical analysis doc Babasab Patil
 
Bhavishya- Technical Analysis
Bhavishya- Technical AnalysisBhavishya- Technical Analysis
Bhavishya- Technical Analysisshivamantri
 

Similar to How to Trade Chart Patterns with Target and SL@forexgdp.com.pdf (20)

Investor Education
Investor EducationInvestor Education
Investor Education
 
Profit From Pullback Trading
Profit From Pullback TradingProfit From Pullback Trading
Profit From Pullback Trading
 
Learn A Simple Range Trading Strategy
Learn A Simple Range Trading StrategyLearn A Simple Range Trading Strategy
Learn A Simple Range Trading Strategy
 
Technicalanalysisppt 120809084534-phpapp02
Technicalanalysisppt 120809084534-phpapp02Technicalanalysisppt 120809084534-phpapp02
Technicalanalysisppt 120809084534-phpapp02
 
Portfolio - Technical Analysis
Portfolio - Technical Analysis Portfolio - Technical Analysis
Portfolio - Technical Analysis
 
Technical analysis
Technical analysisTechnical analysis
Technical analysis
 
Technical anaylsis (day_8)
Technical anaylsis (day_8)Technical anaylsis (day_8)
Technical anaylsis (day_8)
 
Pattern seminar 16042014
Pattern seminar 16042014Pattern seminar 16042014
Pattern seminar 16042014
 
Technical analysis
Technical analysisTechnical analysis
Technical analysis
 
Profit from trapped traders with 2 simple setups
Profit from trapped traders with 2 simple setupsProfit from trapped traders with 2 simple setups
Profit from trapped traders with 2 simple setups
 
SAPM-33.pptx
SAPM-33.pptxSAPM-33.pptx
SAPM-33.pptx
 
Technically speaking
Technically speakingTechnically speaking
Technically speaking
 
May 20 I Session 1 I GBIH
May 20 I Session 1 I GBIHMay 20 I Session 1 I GBIH
May 20 I Session 1 I GBIH
 
Module 8 - Further Charting
Module 8 - Further ChartingModule 8 - Further Charting
Module 8 - Further Charting
 
Technical analysis
Technical analysisTechnical analysis
Technical analysis
 
AnalysisTechnical Analysis PPT @ MBABECDOMS
AnalysisTechnical Analysis PPT @ MBABECDOMSAnalysisTechnical Analysis PPT @ MBABECDOMS
AnalysisTechnical Analysis PPT @ MBABECDOMS
 
Technical analysis doc
Technical analysis doc Technical analysis doc
Technical analysis doc
 
Technical
TechnicalTechnical
Technical
 
Technical
TechnicalTechnical
Technical
 
Bhavishya- Technical Analysis
Bhavishya- Technical AnalysisBhavishya- Technical Analysis
Bhavishya- Technical Analysis
 

Recently uploaded

Regression analysis: Simple Linear Regression Multiple Linear Regression
Regression analysis:  Simple Linear Regression Multiple Linear RegressionRegression analysis:  Simple Linear Regression Multiple Linear Regression
Regression analysis: Simple Linear Regression Multiple Linear RegressionRavindra Nath Shukla
 
Call Girls In Panjim North Goa 9971646499 Genuine Service
Call Girls In Panjim North Goa 9971646499 Genuine ServiceCall Girls In Panjim North Goa 9971646499 Genuine Service
Call Girls In Panjim North Goa 9971646499 Genuine Serviceritikaroy0888
 
Sales & Marketing Alignment: How to Synergize for Success
Sales & Marketing Alignment: How to Synergize for SuccessSales & Marketing Alignment: How to Synergize for Success
Sales & Marketing Alignment: How to Synergize for SuccessAggregage
 
Pharma Works Profile of Karan Communications
Pharma Works Profile of Karan CommunicationsPharma Works Profile of Karan Communications
Pharma Works Profile of Karan Communicationskarancommunications
 
Grateful 7 speech thanking everyone that has helped.pdf
Grateful 7 speech thanking everyone that has helped.pdfGrateful 7 speech thanking everyone that has helped.pdf
Grateful 7 speech thanking everyone that has helped.pdfPaul Menig
 
Call Girls in Gomti Nagar - 7388211116 - With room Service
Call Girls in Gomti Nagar - 7388211116  - With room ServiceCall Girls in Gomti Nagar - 7388211116  - With room Service
Call Girls in Gomti Nagar - 7388211116 - With room Servicediscovermytutordmt
 
VIP Call Girl Jamshedpur Aashi 8250192130 Independent Escort Service Jamshedpur
VIP Call Girl Jamshedpur Aashi 8250192130 Independent Escort Service JamshedpurVIP Call Girl Jamshedpur Aashi 8250192130 Independent Escort Service Jamshedpur
VIP Call Girl Jamshedpur Aashi 8250192130 Independent Escort Service JamshedpurSuhani Kapoor
 
The CMO Survey - Highlights and Insights Report - Spring 2024
The CMO Survey - Highlights and Insights Report - Spring 2024The CMO Survey - Highlights and Insights Report - Spring 2024
The CMO Survey - Highlights and Insights Report - Spring 2024christinemoorman
 
Catalogue ONG NUOC PPR DE NHAT .pdf
Catalogue ONG NUOC PPR DE NHAT      .pdfCatalogue ONG NUOC PPR DE NHAT      .pdf
Catalogue ONG NUOC PPR DE NHAT .pdfOrient Homes
 
Cash Payment 9602870969 Escort Service in Udaipur Call Girls
Cash Payment 9602870969 Escort Service in Udaipur Call GirlsCash Payment 9602870969 Escort Service in Udaipur Call Girls
Cash Payment 9602870969 Escort Service in Udaipur Call GirlsApsara Of India
 
Lowrate Call Girls In Laxmi Nagar Delhi ❤️8860477959 Escorts 100% Genuine Ser...
Lowrate Call Girls In Laxmi Nagar Delhi ❤️8860477959 Escorts 100% Genuine Ser...Lowrate Call Girls In Laxmi Nagar Delhi ❤️8860477959 Escorts 100% Genuine Ser...
Lowrate Call Girls In Laxmi Nagar Delhi ❤️8860477959 Escorts 100% Genuine Ser...lizamodels9
 
7.pdf This presentation captures many uses and the significance of the number...
7.pdf This presentation captures many uses and the significance of the number...7.pdf This presentation captures many uses and the significance of the number...
7.pdf This presentation captures many uses and the significance of the number...Paul Menig
 
BEST Call Girls In Greater Noida ✨ 9773824855 ✨ Escorts Service In Delhi Ncr,
BEST Call Girls In Greater Noida ✨ 9773824855 ✨ Escorts Service In Delhi Ncr,BEST Call Girls In Greater Noida ✨ 9773824855 ✨ Escorts Service In Delhi Ncr,
BEST Call Girls In Greater Noida ✨ 9773824855 ✨ Escorts Service In Delhi Ncr,noida100girls
 
Insurers' journeys to build a mastery in the IoT usage
Insurers' journeys to build a mastery in the IoT usageInsurers' journeys to build a mastery in the IoT usage
Insurers' journeys to build a mastery in the IoT usageMatteo Carbone
 
Vip Female Escorts Noida 9711199171 Greater Noida Escorts Service
Vip Female Escorts Noida 9711199171 Greater Noida Escorts ServiceVip Female Escorts Noida 9711199171 Greater Noida Escorts Service
Vip Female Escorts Noida 9711199171 Greater Noida Escorts Serviceankitnayak356677
 
0183760ssssssssssssssssssssssssssss00101011 (27).pdf
0183760ssssssssssssssssssssssssssss00101011 (27).pdf0183760ssssssssssssssssssssssssssss00101011 (27).pdf
0183760ssssssssssssssssssssssssssss00101011 (27).pdfRenandantas16
 
Mondelez State of Snacking and Future Trends 2023
Mondelez State of Snacking and Future Trends 2023Mondelez State of Snacking and Future Trends 2023
Mondelez State of Snacking and Future Trends 2023Neil Kimberley
 
Tech Startup Growth Hacking 101 - Basics on Growth Marketing
Tech Startup Growth Hacking 101  - Basics on Growth MarketingTech Startup Growth Hacking 101  - Basics on Growth Marketing
Tech Startup Growth Hacking 101 - Basics on Growth MarketingShawn Pang
 
Lucknow 💋 Escorts in Lucknow - 450+ Call Girl Cash Payment 8923113531 Neha Th...
Lucknow 💋 Escorts in Lucknow - 450+ Call Girl Cash Payment 8923113531 Neha Th...Lucknow 💋 Escorts in Lucknow - 450+ Call Girl Cash Payment 8923113531 Neha Th...
Lucknow 💋 Escorts in Lucknow - 450+ Call Girl Cash Payment 8923113531 Neha Th...anilsa9823
 

Recently uploaded (20)

Regression analysis: Simple Linear Regression Multiple Linear Regression
Regression analysis:  Simple Linear Regression Multiple Linear RegressionRegression analysis:  Simple Linear Regression Multiple Linear Regression
Regression analysis: Simple Linear Regression Multiple Linear Regression
 
Call Girls In Panjim North Goa 9971646499 Genuine Service
Call Girls In Panjim North Goa 9971646499 Genuine ServiceCall Girls In Panjim North Goa 9971646499 Genuine Service
Call Girls In Panjim North Goa 9971646499 Genuine Service
 
Sales & Marketing Alignment: How to Synergize for Success
Sales & Marketing Alignment: How to Synergize for SuccessSales & Marketing Alignment: How to Synergize for Success
Sales & Marketing Alignment: How to Synergize for Success
 
Pharma Works Profile of Karan Communications
Pharma Works Profile of Karan CommunicationsPharma Works Profile of Karan Communications
Pharma Works Profile of Karan Communications
 
Grateful 7 speech thanking everyone that has helped.pdf
Grateful 7 speech thanking everyone that has helped.pdfGrateful 7 speech thanking everyone that has helped.pdf
Grateful 7 speech thanking everyone that has helped.pdf
 
Call Girls in Gomti Nagar - 7388211116 - With room Service
Call Girls in Gomti Nagar - 7388211116  - With room ServiceCall Girls in Gomti Nagar - 7388211116  - With room Service
Call Girls in Gomti Nagar - 7388211116 - With room Service
 
VIP Call Girl Jamshedpur Aashi 8250192130 Independent Escort Service Jamshedpur
VIP Call Girl Jamshedpur Aashi 8250192130 Independent Escort Service JamshedpurVIP Call Girl Jamshedpur Aashi 8250192130 Independent Escort Service Jamshedpur
VIP Call Girl Jamshedpur Aashi 8250192130 Independent Escort Service Jamshedpur
 
The CMO Survey - Highlights and Insights Report - Spring 2024
The CMO Survey - Highlights and Insights Report - Spring 2024The CMO Survey - Highlights and Insights Report - Spring 2024
The CMO Survey - Highlights and Insights Report - Spring 2024
 
Catalogue ONG NUOC PPR DE NHAT .pdf
Catalogue ONG NUOC PPR DE NHAT      .pdfCatalogue ONG NUOC PPR DE NHAT      .pdf
Catalogue ONG NUOC PPR DE NHAT .pdf
 
Cash Payment 9602870969 Escort Service in Udaipur Call Girls
Cash Payment 9602870969 Escort Service in Udaipur Call GirlsCash Payment 9602870969 Escort Service in Udaipur Call Girls
Cash Payment 9602870969 Escort Service in Udaipur Call Girls
 
Lowrate Call Girls In Laxmi Nagar Delhi ❤️8860477959 Escorts 100% Genuine Ser...
Lowrate Call Girls In Laxmi Nagar Delhi ❤️8860477959 Escorts 100% Genuine Ser...Lowrate Call Girls In Laxmi Nagar Delhi ❤️8860477959 Escorts 100% Genuine Ser...
Lowrate Call Girls In Laxmi Nagar Delhi ❤️8860477959 Escorts 100% Genuine Ser...
 
7.pdf This presentation captures many uses and the significance of the number...
7.pdf This presentation captures many uses and the significance of the number...7.pdf This presentation captures many uses and the significance of the number...
7.pdf This presentation captures many uses and the significance of the number...
 
BEST Call Girls In Greater Noida ✨ 9773824855 ✨ Escorts Service In Delhi Ncr,
BEST Call Girls In Greater Noida ✨ 9773824855 ✨ Escorts Service In Delhi Ncr,BEST Call Girls In Greater Noida ✨ 9773824855 ✨ Escorts Service In Delhi Ncr,
BEST Call Girls In Greater Noida ✨ 9773824855 ✨ Escorts Service In Delhi Ncr,
 
Insurers' journeys to build a mastery in the IoT usage
Insurers' journeys to build a mastery in the IoT usageInsurers' journeys to build a mastery in the IoT usage
Insurers' journeys to build a mastery in the IoT usage
 
Vip Female Escorts Noida 9711199171 Greater Noida Escorts Service
Vip Female Escorts Noida 9711199171 Greater Noida Escorts ServiceVip Female Escorts Noida 9711199171 Greater Noida Escorts Service
Vip Female Escorts Noida 9711199171 Greater Noida Escorts Service
 
0183760ssssssssssssssssssssssssssss00101011 (27).pdf
0183760ssssssssssssssssssssssssssss00101011 (27).pdf0183760ssssssssssssssssssssssssssss00101011 (27).pdf
0183760ssssssssssssssssssssssssssss00101011 (27).pdf
 
Mondelez State of Snacking and Future Trends 2023
Mondelez State of Snacking and Future Trends 2023Mondelez State of Snacking and Future Trends 2023
Mondelez State of Snacking and Future Trends 2023
 
Forklift Operations: Safety through Cartoons
Forklift Operations: Safety through CartoonsForklift Operations: Safety through Cartoons
Forklift Operations: Safety through Cartoons
 
Tech Startup Growth Hacking 101 - Basics on Growth Marketing
Tech Startup Growth Hacking 101  - Basics on Growth MarketingTech Startup Growth Hacking 101  - Basics on Growth Marketing
Tech Startup Growth Hacking 101 - Basics on Growth Marketing
 
Lucknow 💋 Escorts in Lucknow - 450+ Call Girl Cash Payment 8923113531 Neha Th...
Lucknow 💋 Escorts in Lucknow - 450+ Call Girl Cash Payment 8923113531 Neha Th...Lucknow 💋 Escorts in Lucknow - 450+ Call Girl Cash Payment 8923113531 Neha Th...
Lucknow 💋 Escorts in Lucknow - 450+ Call Girl Cash Payment 8923113531 Neha Th...
 

How to Trade Chart Patterns with Target and SL@forexgdp.com.pdf

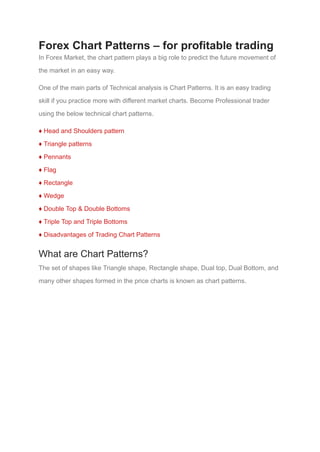
  • 1. Forex Chart Patterns – for profitable trading In Forex Market, the chart pattern plays a big role to predict the future movement of the market in an easy way. One of the main parts of Technical analysis is Chart Patterns. It is an easy trading skill if you practice more with different market charts. Become Professional trader using the below technical chart patterns. ♦ Head and Shoulders pattern ♦ Triangle patterns ♦ Pennants ♦ Flag ♦ Rectangle ♦ Wedge ♦ Double Top & Double Bottoms ♦ Triple Top and Triple Bottoms ♦ Disadvantages of Trading Chart Patterns What are Chart Patterns? The set of shapes like Triangle shape, Rectangle shape, Dual top, Dual Bottom, and many other shapes formed in the price charts is known as chart patterns.
  • 2. A Chart Pattern shapes are printed on all the market charts at any time. Traders keep watching the price chart to find the patterns. Once the trader found a pattern, then it will give the signal on where the price is going to move next? The complexity of trading necessitates a keen eye and a sharp mind, but one thing that can make it easier for both seasoned professionals and beginners is having a trading patterns cheat sheet.
  • 3. Identifying the pattern shapes in the chart is very easy by using simple tools such as horizontal lines, trend lines, Equidistant Channel lines, etc. Let’s see different types of chart patterns. Different Types of Forex Chart Patterns Forex Trading patterns are divided into 3 types depending on the market trend such as uptrend, downtrend, Neutral trend(Ranging). 1) Continuation Chart Patterns 2) Reversal Chart Patterns 3) Neutral Chart Patterns Continuation Chart Patterns Continuation chart pattern appears when the market is moving in an Uptrend or Downtrend. You can spot this pattern during the price correction or retracement happening in a trending market. For example: If the market is moving in an Uptrend, then it stops at some price and starts to move down which is against the trend. During this time, you can identify the continuation chart patterns. Most popular continuation pattern charts are Pennants, Rectangles and Corrective Wedges. Pennants Pennants shape formed in the chart during the strong trend. The market takes a small break during the trend and it forms a pennant pattern in the chart.
  • 4. Pennant looks like the shape of the symmetrical triangle, as both triangle and pennant are bound by trendline support and resistance lines. The difference is that pennant appears during the trend, but triangles can be formed during both trends and general consolidation periods. Pennants could be bearish or bullish depending on the trend direction. When a pennant occurs during a trend, it has the potential to push the price in the direction of the overall trend. How to trade pennants? Wait for a breakout of the Pennant pattern to enter into the trade.
  • 5.
  • 6. If the pennant is formed, the minimum take profit target should be the number of pips moved in the first wave of the pennant as shown in the chart picture. After a breakout, the distance of the first wave inside the pennant should be your minimum take profit target. Flag Pattern Flag pattern is similar to pennant pattern. Whatever rules applied in pennant chart pattern applies to flag pattern too.
  • 7. Flag charting patterns can be formed during the retracement of the trend. The only difference between flag and pennant is, Flag looks like a small channel (parallel lines) in a trend. Rectangle Chart Pattern Rectangle shape formed in the chart when the market is moving up and down between horizontal support and resistance levels. The market takes a long break from the trend move and it keeps moving up and down between the certain price level.
  • 8. During a trend, when the price starts moving sideways forming a rectangle, another trending move is likely to occur once price eventually breaks out of the rectangle formation. This move is likely to be at least as big as the size of the rectangle. Rectangles could be bearish or bullish depending on the trend direction. How to trade Rectangle? You can take short term trades in the Rectangle pattern. If the market reaches the bottom support of the rectangle, you can place buy trade. If the market reaches the Top of the resistance, you can place a sell trade.
  • 9. Wait for a breakout of the Rectangle pattern to enter into the trade.
  • 10. Note: Always keep placing the trade depend on the trend. Example: If the market moving in an Uptrend, place only sell trade after breakout confirmed at the Bottom Support of the Rectangle. How to confirm the breakout in trading? check here. After a breakout, the distance of the first wave inside the rectangle should be your minimum take profit target. Wedge Chart Pattern When the market forms higher highs and higher lows in a narrow path, it is known as a rising wedge. A rising wedge will form either in uptrend or downtrend. When the Market forms Lower highs and Lower Lows in a narrow path, it is known as a falling wedge. A falling wedge will form either in uptrend or downtrend.
  • 11. Wedge Pattern forms during both trend continuation and at the Trend Reversal. Trend Continuation Wedge is called Corrective Wedge Pattern. Trend Reversal Wedge is called Reversal Wedge Pattern. How to identify Corrective or Reversal Wedge? Corrective Wedge pattern is a correction that happened during the trend which forms a Wedge Shape in the Chart. Reversal Wedge pattern is similar to Corrective Wedge, the only difference is Market will start to reverse after forming the wedge. Whereas In Corrective Wedge, the market starts to continue the trend. We may not know whether the wedge is corrective or reversal until it breakout from that wedge Pattern. If the breakout happened in the trend direction, Then we can confirm it as Corrective Wedge.
  • 12. If the breakout happened against the trend, it means market starts to reverse. Then we can confirm it as a Reversal Wedge. How to trade Wedges? You can take short term trades inside the Wedge pattern at highs and lows of the Wedge. If the market reaches the bottom of the Wedge, you can place buy trade. If the market reaches the top of the wedge, you can place a sell trade. Wait for a breakout of the Wedge pattern to enter into the Long term trade. Stop-loss should be placed near to highs and lows. Bonus: Wedge Pattern will breakout mostly at the 4th Touch of the Higher High or Higher Low. Let’s look out this falling wedge Chart.
  • 13. I hope you are very clear now on how to trade the wedge pattern. If you have any questions, please click here to ask now. Reversal Chart Patterns Double Top Pattern It is a reversal pattern in an Uptrend, where market creates exactly two tops on the same price level.
  • 14. There are 2 types of Double top 1) Traditional Double Top If each top gap is within 9 months, then it is called “Traditional Double Top”. 2) Cyclic Double Top If each top gap is more than 9 months (or) If the time taken to form each top is more than 9 months, then it is called as “Cyclic Double Top”. Double Bottom Pattern It is a reversal pattern in a Downtrend, where market creates exactly two bottoms on the same price level.
  • 15. There are 2 types of Double bottom 1) Traditional Double Bottom If each bottom gap is within 9 months, then it is called “Traditional Double Bottom”. 2) Cyclic Double Bottom If each bottom gap is more than 9 months (or) If the time taken to form each bottom is more than 9 months, then it is called as “Cyclic Double Bottom”. How to Trade Double Top? If you saw a double top in the chart, wait for the confirmation of breakout at the recent low level. After breakout confirms at the recent low level, You can enter into the trade.
  • 16. The Minimum Double Top Target should be the same as the distance of the previous high to low as shown in the image How to Trade Double Bottom? If you saw a double bottom in the chart, wait for the confirmation of breakout at the recent high level. After breakout confirms at the recent high level, You can enter into the trade.
  • 17. The Minimum Double Bottom Target should be the same as the distance(size) of the previous Low to high as shown in the image. Triple Top and Triple Bottom Patterns Triple Tops and Triple Bottoms are same as Double tops and Double Bottoms. The only difference is additionally extra one top or bottom formed in the chart.
  • 18. 1) Traditional Triple Top If each Tops gap is within 9 months, then it is called “Traditional Triple Top”. 2) Cyclic Triple Top If each Top gap is more than 9 months, then it is called as “Cyclic Triple Top”. How to Trade Triple Top? If you saw a Triple top in the chart, wait for the confirmation of breakout at the recent low level. After breakout confirms at the recent low level, You can enter into the trade. The Minimum Triple Top Target should be the same as the distance of the previous high to low as shown in the image How to Trade Triple Bottom?
  • 19. If you saw a Triple bottom in the chart, wait for the confirmation of breakout at the recent high level. After breakout confirms at the recent high level, You can enter into the trade. The Minimum Triple Bottom Target should be the same as the distance(size) of the previous Low to high, as shown in the image. Head and Shoulders Pattern Head and Shoulders Pattern is one of the Top Reliable chart patterns for technical analyst. It is a strong reversal pattern. If these patterns formed in the chart, Market definitely needs to reverse.
  • 20. If you look out the image, you can see the Middle Top looks like a Head and each side tops look like shoulders. It’s like a Human right? This is the reason we call this Pattern as Head and Shoulder. This head and Shoulder pattern is a Reversal Pattern in an Uptrend. But how about the reversal of downtrend? It is just opposite of the ordinary head and shoulder pattern. If the Head and Shoulders formed in the chart in an Inverted shape, it is known as “Inverted Head and Shoulder”. It looks like a person doing Yoga Ashtanga Headstand.
  • 21.
  • 22. If you found this inverted head and shoulders shape in the chart, it confirms the Reversal pattern in a Downtrend. How to Trade Head and Shoulders Pattern? If you saw a Head and Shoulders in the chart, wait for the confirmation of breakout at the recent low level (Neck level breakout).
  • 23. Head and shoulders neckline is used to confirm the reversal. If the head and shoulders neckline break, the reversal will be confirmed. After breakout confirms at the recent low level (neck level), You can enter into the trade. Let’s see the inverse head and shoulder chart.
  • 24. The Minimum Head and Shoulder Take Profit Target should be the same as the distance(size) of the Head as shown in the image. Triangle Pattern Triangle shape formed in the chart when the market is making consolidation or correction. The Triangle pattern takes a long time to break out, until that you can keep buying or selling inside the highs and lows of the triangle. There are 4 types of Triangle 1) Ascending Triangle 2) Descending Triangle 3) Symmetrical Triangle 4) Expanding Triangle
  • 25. Ascending Triangle Ascending Triangle has Higher lows, Equal highs. Ascending Triangle is formed during the Uptrend or retracement in a downtrend. Descending Triangle Descending Triangle has Lower highs and Equal lows. Descending Triangle is formed during the downtrend or retracement in an Uptrend.
  • 26. Neutral Chart Pattern Symmetrical Triangle Symmetrical Triangle has Lower highs and Higher Lows in a narrow path. Symmetrical triangles have two sides, which are approximately the same size and the same angle. This creates a technical force equivalency, which creates the neutral character of the formation. The image below shows how a symmetrical triangle appears:
  • 27. Expanding Triangle Expanding Triangle is opposite of the Symmetrical Triangle. it has higher highs and Lower Lows.
  • 28. How to Trade Triangle Pattern? You can take short term trades inside the Triangle pattern. If the market reaches the bottom support of the Triangle line, you can place buy trade. If the market reaches the Top resistance of the Triangle, you can place the sell trade.
  • 29. Wait for a breakout of the Triangle pattern to enter into the trade. Let’s look out the Ascending Triangle and Descending Triangle take profit targets.
  • 30.
  • 31.
  • 32.
  • 33. How to confirm the breakout in trading? check here. After a breakout, the distance of the first wave inside the Triangle should be your minimum take profit target. Are there any disadvantages when trading with chart patterns?
  • 34. Yes there’s some disadvantages of using chart patterns. 1) Watching too many chart patterns in the same market chart creates more confusion. It makes you think, whether you should trade this pattern or that pattern. For instance, if you found the triangles pattern and the rectangle pattern in the same forex chart, You may be confused when to enter and exit the trade. 2) Over drawing on the chart patterns drives you crazy while taking the decision to enter the trade. Stick with one-time frame first, don’t draw chart patterns more on all time frames, it gives you idea where the market is moving. But if you want to enter at good opportunity earlier at best trade setup, you need to look for higher time frame chart patterns first, next look for lower time frame chart patterns to confirm the reversal or breakout in the market. 3) Draw chart patterns only at major price levels, don’t focus on drawing patterns in minor or unimportant price levels.
  • 35. 4) Keep your chart clear while drawing the patterns, if you use indicator or other forex trading tools in the chart. your chart looks so messy and busy, it will not help you to pick the trade at the right opportunity instead it makes your mind tired and you may start to trade unconsciously. 5) Beware of fake breakouts while trading the chart patterns, don’t take any breakout trade unless the breakout is confirmed. Want to know, how to confirm the breakout or avoid fake breakout in trading? Click here to see the breakout examples. 6) There are more advantages when comparing to the dis-advantages of chart patterns. Trade forex chart pattern carefully as per the strategy on “How to trade chart patterns?” as explained above. 7) Chart patterns are not clear to draw using the candle charts when comparing to the line chart. Conclusion Forex Chart Patterns are used for technical analysis to predict the future movement of the market. Chart patterns are divided into three types: ● Continuation Chart Patterns ● Reversal Chart Patterns ● Neutral Chart patterns The most popular trend continuation patterns chart are: ● Flags ● Pennants ● Rectangles ● Corrective Wedges
  • 36. The most popular trend reversal chart patterns in forex are: ● Double Top/Double Bottom ● Triple Top/Triple Bottom ● Head and Shoulder ● Reversal Wedges ● Ascending/Descending Triangle
  • 37. One of the most popular neutral pattern charts is the Symmetrical Triangle. In Neutral chart patterns, the market may break either up or down. Catching the market after the confirmation of breakout gives you more profits with small risk. All these forex chart patterns are traded depend on the reversal price movements using reversal patterns and price breaks during the continuation chart pattern forex. Forex Trading Technical Analysis got easier using the forex chart patterns. Trading chart patterns are easier to identify the future price movement. Whether it is continuation patterns or reversal patterns or neutral forex chart patterns, all types of forex trading chart patterns comes under the price action trading journey. Price action trading is one of the most successful trading strategies in fx trading. The forex chart formations such as Triangle formations, Wedges form, rising wedge, falling wedge, price breaks in continuation pattern, head and shoulders chart formations, reversals pattern confirmation, price consolidation, double bottom chart pattern forms, Triple bottoms chart formation, Triangle formation is all noticed along
  • 38. with the candlestick patterns such as bullish engulfing candle price moves, bearish engulfing candle price move, Morning star, Evening star, pin bar, hanging man, Dojis, tweezers, hammer, spinning tops, three black crows, three white soldiers, shooting star are all the best candlestick patterns for all price action traders. The price trend shows price direction in forex patterns chart. Whatever forex chart patterns display on your trading platform, Just find out which type of chart pattern it belongs to whether it is continuation pattern or reversal chart pattern or Neutral chart pattern. After finding the pattern type, you can trade between the demand and supply zone for short term entry and exits, if price breaks from the pattern, you can enter into long term trades. The progress tracking of identifying the pattern and reviewing it often is very important to become a professional forex trader. Practice currency trading chart analysis well with demo account first, Rising wedge, falling wedge, neckline of head and shoulders line, support and resistance trading opportunity point the traders with best trading signals setup in the chart. Using chart pattern gives great browsing experience for exploring all currency pair charts such as EUR USD, GBP USD, USD JPY, XAU USD, etc. The perfect chart formation is visible only if you keep drawing the trendlines, horizontal support and resistance levels. For low risk, high reward trading opportunity, the starting point of the price move and the price direction should be predicted using the trends and the necessary chart formation. The stop loss order should be smaller and tight to avoid excess loss in trading. Check the stop level of the broker to see how much risk you can take with your leverage option on your trading account. Some brokers offer partner center with high
  • 39. IB commissions please beware of them. they are stop loss hunters due to high spread even in major currency pair like EUR USD, USDJPY, GBPUSD. The stop-loss order line and the ask line should be enabled on your forex broker platform to know the spread and visible stop loss price. Forex chart patter with reversal chart and price action strategies help you to trade important currency pairs such as EUR USD with small risk and high potential trading signal to make good profits. The reversals and trend progress market creates heavy demand and momentum in the markets to bring big movements and insights into the forex charts. FAQ What is Cyclic Double Top? If each top gap is more than 9 months, then it is called as “Cyclic Double Top”. What is Cyclic Double Bottom? If each bottom gap is more than 9 months, then it is called as “Cyclic Double Bottom”. Which forex chart patterns are best to trade? Rectangle, Trend line, Channel, pennant, flag, triangle, rising and falling wedge, head and shoulder are the most used forex chart patterns by professional traders world wide. How to trade chart patterns in forex market? First identify the patterns in the chart. If the market is inside the pattern, you can take short term trades, if the pattern shape got broken, then you can place a long term trades to catch big profits.