Download as PDF, PPTX
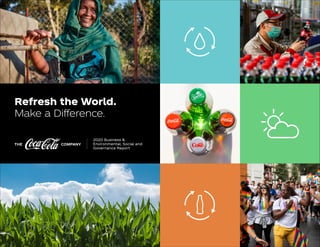
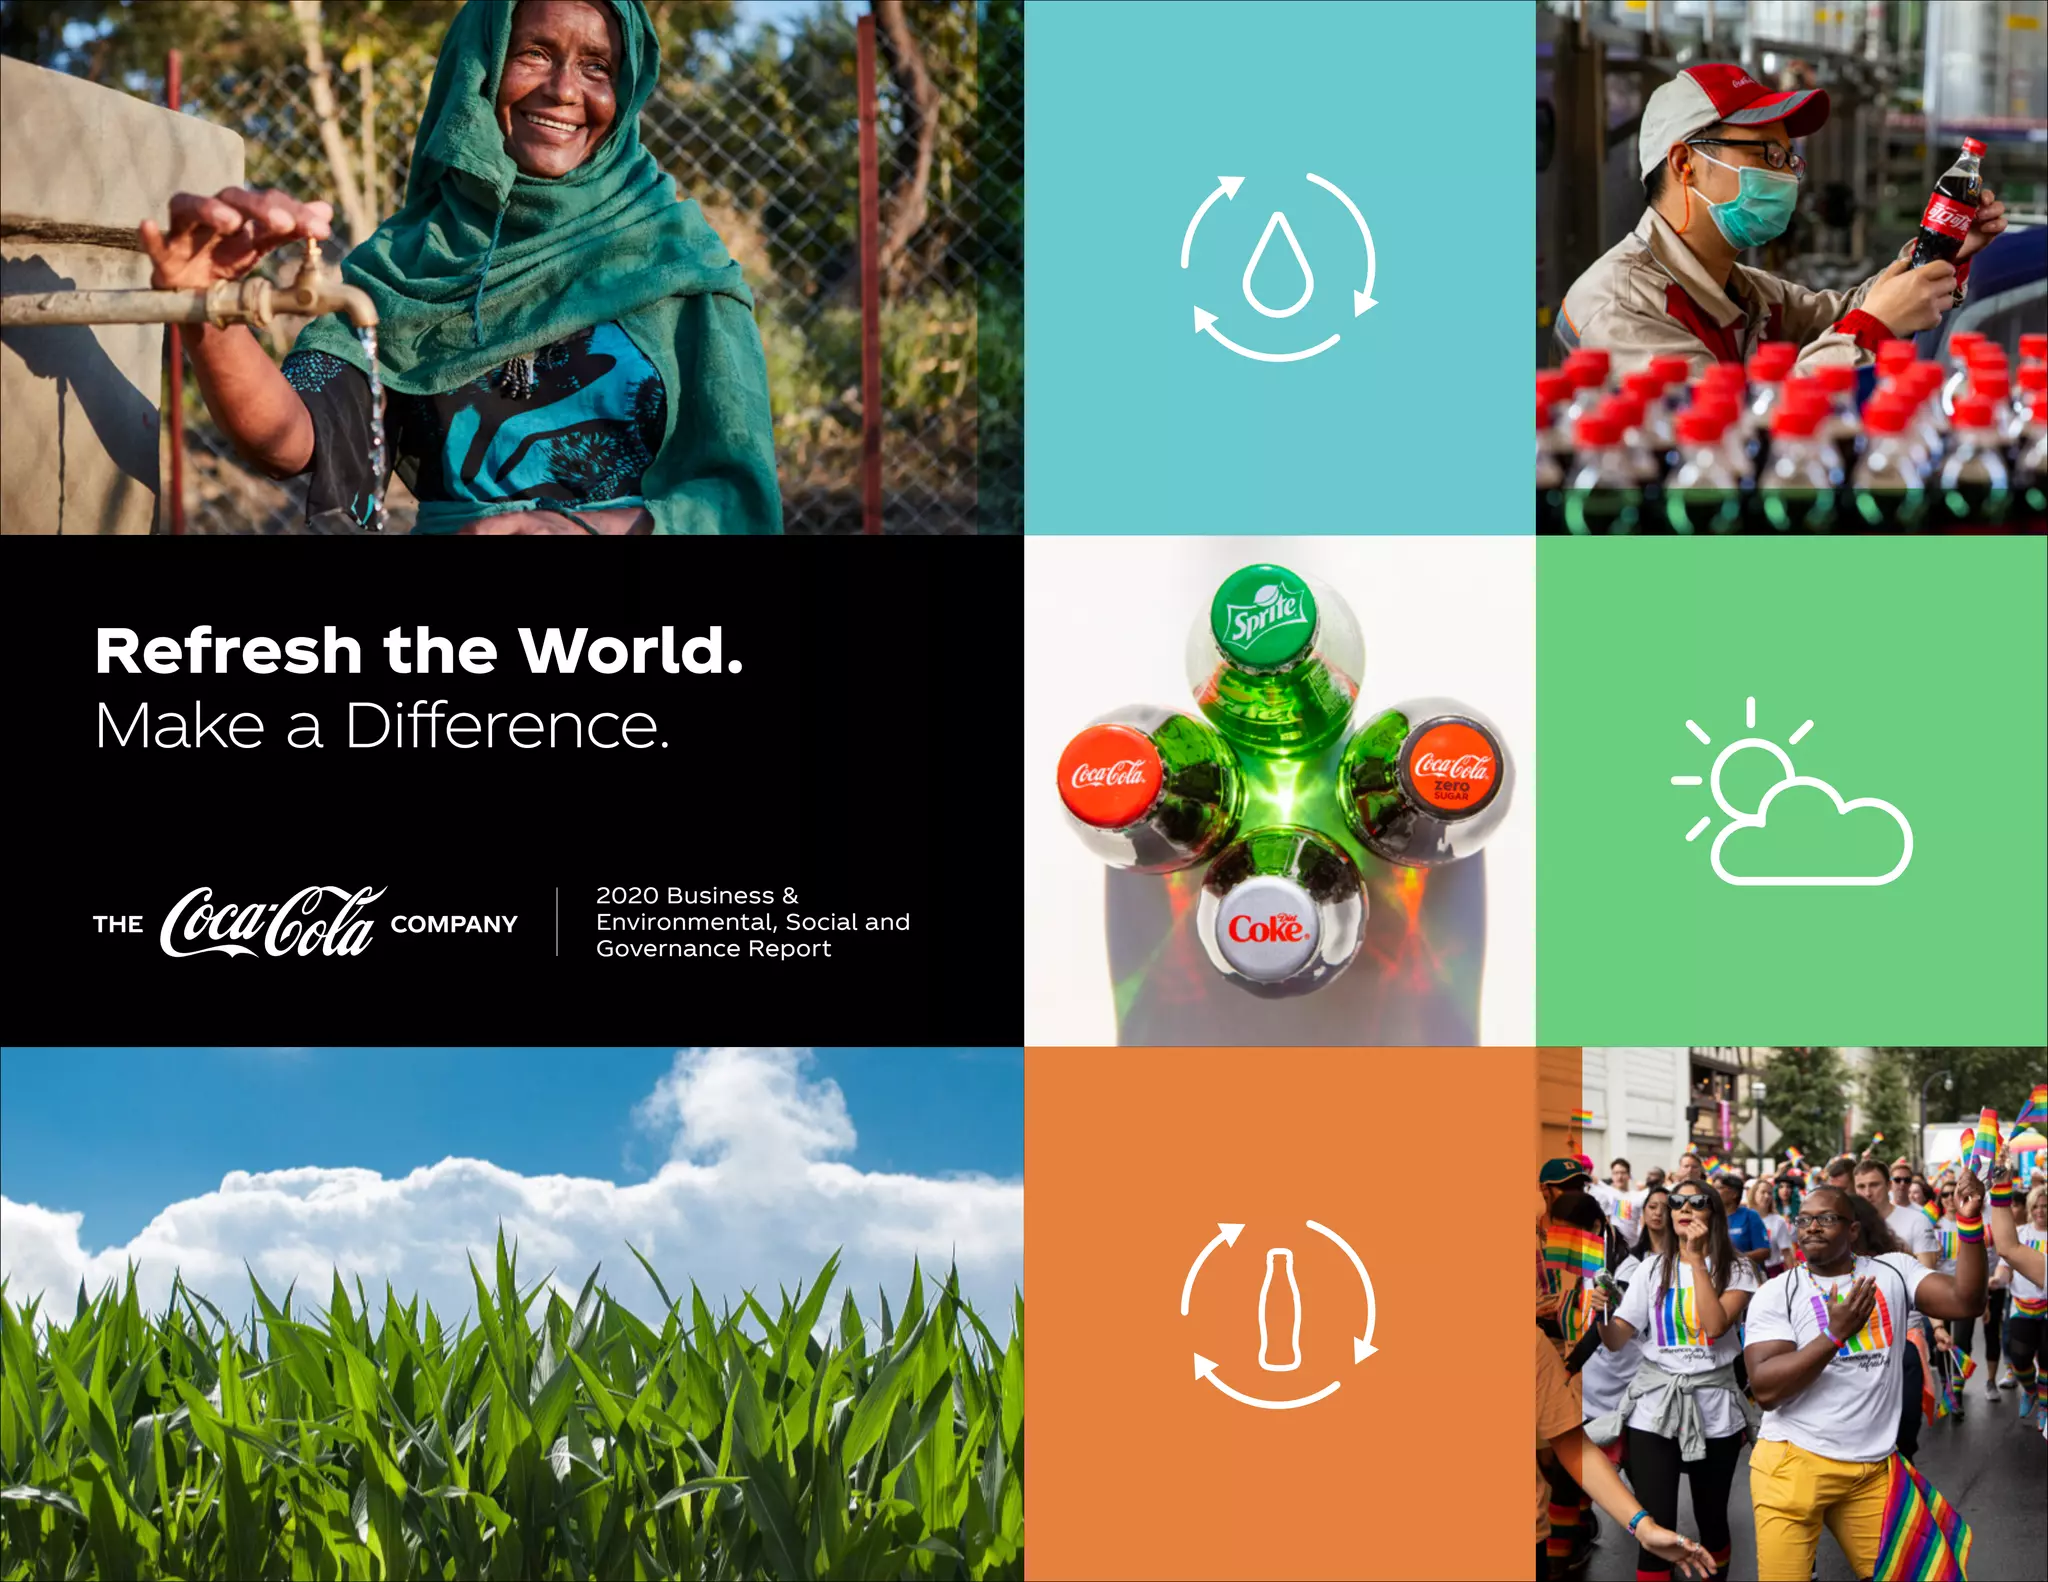


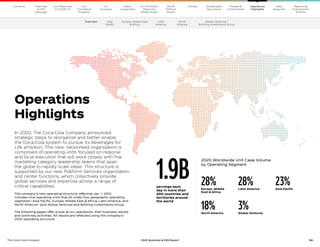


The document is The Coca-Cola Company's 2020 Business & ESG Report. It summarizes that in 2020, Coca-Cola continued pursuing its environmental, social and governance goals despite challenges from the COVID-19 pandemic. This included continuing efforts to reduce plastic waste and achieve a 25% reduction in greenhouse gas emissions by 2030. It also discusses Coca-Cola restructuring its organization and focusing on innovation, while donating over $90 million to COVID-19 relief efforts globally.