1) The document analyzes distribution decisions made by public sector employees in North Carolina who separate from employment prior to retirement.
2) Using administrative data, it finds that over two-thirds of public sector workers under age 50 who separated maintained their pension accounts rather than withdrawing funds, suggesting low leakage of retirement savings.
3) However, it also finds that the lump sum distribution was larger than the present value of the annuity for over 70% of separations, indicating many workers may be forgoing higher potential retirement income.
Unit-IV; Professional Sales Representative (PSR).pptx
#140.pdfJournal of Public Economics 116 (2014) 73–88.docx
1. #140.pdf
Journal of Public Economics 116 (2014) 73–88
Contents lists available at ScienceDirect
Journal of Public Economics
journal homepage: www.elsevier.com/locate/jpube
Defined benefit pension plan distribution decisions by public
sector employees☆
Robert L. Clark a, Melinda Sandler Morrill b,⁎, David
Vanderweide c
a Poole College of Management, North Carolina State
University, USA
b Department of Economics, North Carolina State University,
USA
c Fiscal Research Division, North Carolina General Assembly,
USA
☆ This research was supported in part by a grant fro
ministration (SSA) funded as part of the Financial Liter
opinions and conclusions expressed herein are solely th
represent the opinions or policy of SSA, any agency o
any other institution with which the authors are affili
paper was presented at the “Retirement Benefits for St
signing Pension Plans for the Twenty-First Century” c
by the Smith Richardson Foundation. The authors wo
participants for useful comments, as well as seminar
William and Mary. The authors would also like to than
ell, Thayer Morrill, Doug Pearce, James Poterba, and Jo
4. acy Research Consortium. The
ose of the authors and do not
f the Federal Government, or
ated. An earlier version of the
ate and Local Employees: De-
onference, which was funded
uld like to thank conference
participants at the College of
k Julie Agnew, Olivia S. Mitch-
sh Rauh for useful discussions
, North Carolina State Univer-
19 515 0331.
rrill).
rights reserved.
Workers who accept the LS are then given a choice of whether
they
want to roll the funds over into an IRA or to accept the cash as
taxable
income and also pay a tax penalty for early withdrawal if under
age
59.5. These choices can have significant long run implications
for fu-
ture retirement income and shed light on the magnitude of
leakages
from retirement saving. In a report describing sources of
leakage of
workers' retirement savings from 401(k) plans, the Government
Accountability Office (2009) concluded that cashing out
benefits at
job separation represents the principle form of leakage of
retirement
savings and has the largest impact on retirement wealth
accumula-
tion. The problem of leakages is greater among younger workers
5. and males, who have been found to cash out benefits at higher
rates
(AonHewitt, 2011).
Economic theory argues that to maximize lifetime utility one
should consume such that utility levels are smooth over time.
One
method of achieving utility smoothing is through the purchase
of
annuities (Yaari, 1965). However, a series of national surveys
and
economic studies found that individuals rarely purchase
annuities in
the open market (see, e.g., Mitchell et al., 1999). Further, when
given the choice in their pension plans of a life annuity or a LS,
workers often chose the LS (see, e.g., Brown, 2001; Engelhardt,
2002; Hurd and Panis, 2006). Thus, many workers tend to reject
the
opportunity to receive a certain flow of income throughout
retire-
ment in favor of receiving cash now, which therefore results in
indi-
viduals assuming the task of managing funds on their own
during
their retirement years. This conflict between theory and
individual
http://crossmark.crossref.org/dialog/?doi=10.1016/j.jpubeco.201
3.05.005&domain=pdf
http://dx.doi.org/10.1016/j.jpubeco.2013.05.005
mailto:[email protected]
http://dx.doi.org/10.1016/j.jpubeco.2013.05.005
http://www.sciencedirect.com/science/journal/00472727
74 R.L. Clark et al. / Journal of Public Economics 116 (2014)
6. 73–88
choices has been called the “Annuity Puzzle.”1 If cashed out
benefits
are spent on immediate consumption rather than saved for
retire-
ment, this leakage will result in lower income and income
security
in retirement.
Under federal pension regulations, defined benefit plans in the
private sector must offer an annuity and provide participants
with in-
formation on their future annuities. The LS's for these plans are
re-
quired to be calculated as at least equal to the present value of
the
retirement annuity using approved interest and mortality
tables.2
Things are very different in the public sector. Public sector
defined
benefits plans usually require explicit employee contributions
each
pay period, and LS's are based on the employee contributions
and
not the present value of the annuity. Thus, a public sector
worker's
choice of whether to take a LS reflects both his/her individual
prefer-
ence for annuitization and potential differences in the net value
of the
LS and annuity options. Defined benefit plans continue to cover
most
state and local employees and virtually all of the plans offer
workers
the option of a LS at job separation or retirement (Clark et al.,
7. 2011).
We examine the choices terminated workers younger than age
50
make using data from the North Carolina Teachers' and State
Em-
ployees' Retirement System (TSERS) and the North Carolina
Local
Governmental Employees' Retirement System (LGERS) by
examining
information contained in the administrative records of the two
retire-
ment plans.3 We restrict our attention to individuals under age
50 as
they are not yet eligible to retire and receive immediate annuity
ben-
efits. As of the end of 2010, these two public pension plans
covered
803,636 employees and retired workers. Our unique dataset
contains
all terminations from state and local government employment in
North Carolina between 2007 and 2008 and tracks behavior
through
the end of 2009, allowing us to observe choices made within
one
year of separation for all terminated workers. The dataset
includes
relevant economic and demographic information on all
individuals
who left state or local employment during this time period.
Public sector defined benefit plan participants face a series of
choices
concerning their pension accounts when terminating
employment
prior to retirement, as illustrated in Fig. 1. The first decision a
8. worker
must make is whether to maintain his/her pension account or
accept
an immediate LS.4 From an economic perspective, a worker
should
compare the value of the LS to the present discounted value of
the life
annuity (PDVA) which is set to begin at some point in the
future. How-
ever, as we will see later, there are a number of factors that
make this
decision more complicated that a simple wealth comparison.
The default option is for the worker to maintain the pension ac-
count; a departing worker must file a request with the
retirement
system in order to receive a LS. Depending on the rules of the
pension
plan, a worker might also have the opportunity to return to work
with the same employer and have prior service credits count
toward
a future retirement benefit.5 Fig. 1 also shows that workers who
re-
quest a LS must specify whether they want to receive cash or
have
1 See Benartzi et al. (2011) for an excellent overview of the
annuity puzzle literature.
2 The Pension Protection Act requires that beginning in 2008
the LS be calculated
using a three-segment interest rate yield curve based on the
rates of return on invest-
ment grade corporate bonds of varying maturities. Purcell
(2007) provides additional
information on this process and how it affects workers at
various ages at termination.
9. 3 While these plans have separate governing boards, they are
administered by the
same staff and have similar, but not identical, benefits and
contributions requirements.
Further details of TSERS and LGERS can be found by visiting
the retirement systems'
home page at:
http://www.nctreasurer.com/dsthome/RetirementSystems.
4 The term “maintain” is used because workers may have the
opportunity to request
a LS at any time after separating from public employment and
prior to starting a retire-
ment benefit; thus not accepting the immediate LS leaves open
the option of
requesting such a distribution at some time in the future instead
of waiting until one
is eligible to start a retirement annuity from the plan. In our
analysis, “immediate”
means that the terminated worker requested a LS within one
year of termination.
5 Returning to work and being covered by the same retirement
plan is probably
much more likely in the public sector where a single plan
typically covers all state em-
ployees and teachers in the state. This allows workers to change
jobs and government
agencies and to move within the state while remaining in the
same retirement system.
the funds rolled over into another approved tax qualified
retirement
plan such as an IRA. If the worker is sent a check, she could
subse-
quently deposit the funds into an IRA and avoid current taxes
10. and
penalties if she follows the IRS guidelines. It is important to
remem-
ber that individuals preferring to insure against longevity risk
by
annuitizing have the option to withdraw funds, roll them over
into
an IRA, and ultimately purchase an annuity. Thus, an informed
worker
should decide whether to withdraw funds based on the highest
pres-
ent value of the distribution options, appropriately measured,
taking
into account predicted inflation, interest rates, and various types
of
risk.
We calculate how the decisions made by separating workers are
affected by the value of the distributional options available to
them.
The relative generosity of the two options is estimated using
details
of the plan characteristics and information provided by the
retire-
ment system. We find that fewer than one-third of all
terminating
public employees requested a LS within one year of separation,
de-
spite the finding that for over 70% of terminations, the LS was
larger
than the estimated PDVA. These results indicate a low
probability of
leakage from retirement funds, although many workers are
seeming-
ly forgoing the possibility of higher retirement income possible
from
11. rolling over funds to an IRA.
We offer several potential explanations for why the
distributional
choice from a public pension plan is more complex than a
simple
wealth comparison at a point in time. First, separating
participants
in TSERS qualify for retiree health insurance from the State
Health
Plan with no premium as long as they are receiving a monthly
annu-
ity from TSERS. This option is available for virtually all vested
state
employees (participants in TSERS), but local employees
(participants
in LGERS) are not covered by the State Health Plan.6
Comparing dis-
tributional decisions by state employees in TSERS to those of
local
employees in LGERS provides some indication of the effect of
retiree
health insurance on the choice to ultimately receive a retirement
an-
nuity. Despite the difference in coverage of retiree health
insurance in
the two systems, we do not see a large difference in the
distributional
choices between separating workers that will qualify for retiree
health insurance and those that will not.
Second, we consider the likelihood that terminated participants
may plan to return to public employment. The expectation of
returning to public employment might make maintaining the
account
the optimal choice for these individuals. However, we document
12. that
workers who ultimately returned to work by December 2010
were
actually more likely to withdraw funds within one year of
separation.
Third, we discuss the influence of alternative investment
options,
macroeconomic conditions, and confidence in the retirement
system.
Maintaining the account still allows for the option of requesting
a LS
at some future date. Because the account balance accrues
interest at
a guaranteed rate of 4%, financially savvy individuals may
choose to
maintain their account balances and accept larger LS's at a
future
date as part of an investment portfolio. However, we do not find
that the 12-month return on the S&P 500 is related to the
probability
of withdrawing funds, once local macroeconomic conditions are
added to the model. There are mixed results when considering
the
1-year Treasury bond rate, but, if anything, higher bond rates
are as-
sociated with a reduced probability of withdrawing funds.
Moreover,
we do not see a large difference between the disposition choice
of
non-vested workers (who do not earn interest) and vested
workers.
This indicates that workers are not responding to incentives of
out-
side investment options. We do find that when the state
unemploy-
ment rate rises, individuals are significantly less likely to
13. withdraw
6 With a few minor exceptions, workers and retirees covered by
LGERS are not cov-
ered by the State Health Plan; however, they may be covered by
locally-managed
health plans that extend coverage to retirees. We cannot match
the local health plans
to the LGERS retirement data.
http://www.nctreasurer.com/dsthome/RetirementSystems
Fig. 1. Choices facing separating employees to take a lump sum
distribution (LSD) or to maintain their retirement account.
75R.L. Clark et al. / Journal of Public Economics 116 (2014)
73–88
funds. This could be due to selection into who is separating
employ-
ment, or it may be that individuals more heavily rely on defaults
in
times of economic turmoil.
The final explanations we consider for why public sector
workers
in North Carolina do not withdraw funds at a higher rate are
financial
literacy, peer effects, and inertia. The default is to leave funds
in the
system. The behavior we observe is consistent with many
individuals
accepting the default option and forgoing potentially more
valuable
benefits. We find evidence consistent with peer effects, but
cannot
distinguish between correlation in unobserved characteristics
14. and
the influence of peers in this study.
After the analysis of the decision to accept a LS rather than
maintaining one's account balance, we then examine the
decision
between cash and a rollover of pension assets by those who
opted
for a LS. The decision on spending versus saving the LS
distribution
has received considerable attention by economists; however,
only a
few studies have been able to observe this choice in
administrative
records rather than survey data (see Bryant et al., 2011). We
find
that nearly 90% of separating workers that request a LS elect to
re-
ceive the funds as cash, rather than rolling over, suggesting a
high
probability of leakage of retirement funds among these
individuals.
Of course, individuals who select a cash distribution can still
move
the funds into a retirement account, pay off debts, or save in
non-
retirement accounts, rather than spending the money on
immediate
consumption.
2. Relevance of findings for participants in public and private
DB plans
Due to similarity of TSERS and LGERS to other state and local
pen-
sion plans, the results presented in this analysis should be
relevant to
15. understanding worker behavior in most public pension plans.
While
the findings also will shed light on potential behavior of
participants
in private defined benefit plans, the difference in pension
coverage
and plan characteristics between the public and private sectors
of
the U.S. economy is striking. The Bureau of Labor Statistics
(2011a)
found that in November 2011 only 22% of full-time private
sector
workers were participating in defined benefit plans, compared
to
87% of full-time public sector workers. With 19.2 million
individuals
working as state and local employees, this implies that there
were
approximately 15 million public sector employees participating
in
defined benefit plans (Bureau of Labor Statistics, 2011b).
Historically, most defined benefit plans provided only annuities
to
their participants; however, over time increasingly plan
sponsors
have adopted provisions that allow their retirees to choose
between
receiving a lump sum distribution (at or prior to retirement) or
accepting an annuity at retirement. Under federal pension
regula-
tions, defined benefit plans in the private sector must offer an
annu-
ity. Traditional plans typically provide participants with
information
on the expected monthly payout amount of their future annuity.
According to federal guidelines, if a lump sum distribution is
16. offered,
it must be at least equal to the present value of the retirement
annuity
using approved interest and mortality tables. As discussed
further
below, things are very different in the public sector where plans
usually require employee contributions and lump sum
distributions
are based on the employee contributions and not the present
value
of the annuity.
The lump sum option is becoming increasingly more common in
private sector defined benefit plans. In 1989, only 2% of
defined ben-
efit plans offered by medium and large firms gave workers the
option
of taking a lump sum distribution, but by 1997 this number had
risen
to 23% (Bureau of Labor Statistics, 1990, 1999; also see Moore
and
Muller, 2002). According to data from the National
Compensation
Survey, in 2007 52% of all workers were in plans that provided
em-
ployees the option of selecting a lump sum distribution instead
of
accepting the life annuity (Bureau of Labor Statistics, 2007;
Purcell,
2009). Some of the increase in defined benefit plans allowing
lump
sum options may be due to the growth of cash balance plans and
other hybrid plans that specify the account balance as a lump
sum
throughout the worker's career. Hybrid plans almost always
offer a
17. lump sum option for departing and retiring workers. As more
and
more pension participants in both the public and private sectors
of
the economy confront distributional choices in their defined
benefit
plans, it is increasing important to understand the determinants
of
this choice and its implications for retirement income.
When making comparisons between choices made in the public
and private sector, it is important to note that differences in
plan de-
sign and pension preferences may reflect, in part, a labor market
sorting of workers based on workers' risk preferences. Using
survey
questions designed to measure risk aversion, previous studies in
the
United States and Europe indicated that employees in the public
sector tend to be more risk averse than those in the private
sector
(e.g., Bellante and Link, 1981; Bonin et al., 2007; Hartog et al.,
2002;
Pfeifer, 2010). Similarly, public sector workers tended to
choose less
risky options in experiments (Buurman et al., 2009), took fewer
76 R.L. Clark et al. / Journal of Public Economics 116 (2014)
73–88
financial risks (Roszkowski and Grable, 2009), and were
observed to
select jobs that have smaller fluctuations in annual earnings and
greater job stability (Bonin et al., 2007). Thus, one should be
cautious
18. in extending the findings regarding the determinants of choices
made
by public sector workers to workers in the private sector with
DB
plans that allow for lump sum distributions.
3. Previous literature examining lump sum distributions
Economists have long been interested in how workers access
and
utilize the wealth accumulated in their retirement accounts. For
the
most part, research studies have focused on (1) the choice
between
a lump sum distribution (LS) and an annuity at retirement, and
(2)
the decision by terminating workers who take a LS to accept a
cash
distribution or roll over the funds over into another tax
qualified re-
tirement plan. Papers on the first topic are often linked to the
‘annuity
puzzle’ and try to explain why economic theory suggests
individuals
would prefer an annuity but retiring workers largely prefer
LS's.7
Most studies on the second point use survey data which relies
on in-
dividuals' ability to recall whether they spent or saved the LS.
There
are only a few papers that consider the choice at termination
prior
to retirement between a LS and maintaining the account balance
in
defined benefit plans.8
19. Several previous papers examined the distributional choice at
re-
tirement in public sector retirement plans and found an
important
role for defaults and for personal preferences and discount
rates.
Butler and Teppa (2007) found that retirees in Swiss pension
funds
were more likely to accept the default option in the plan,
leading to
what they called an “acquiescence bias.” Warner and Pleeter
(2001)
estimated the decisions of individuals to leave the US military
pen-
sion plan during the 1990s in response two separation benefit
pack-
ages offered to mid-career personnel. They found that many
more
eligible participants accepted an offer of a lump sum payment
than
analysts had expected based on conventional interest rates. The
au-
thors argue that this was due to high personal discount rates
relative
to the interest rate used to equate the lump sum to the annuity.
Chalmers and Reuter (2012) examined the distribution decisions
of
32,060 retiring public employees in Oregon between 1990 and
2002. They found that 85% of Oregon state employees choose
an an-
nuity from the state retirement plan and that retirees respond to
changes in annuity pricing, although this effect was relatively
small.
Most studies that have examined the choice of a LS have
20. focused
on respondents in large national data sets (e.g., SIPP, HRS).
Economic
theory indicates that workers will compare the cost of
purchasing an
annuity that is based on population age-specific mortality rates
to the
present value of the annuity using their personal discount rates
and
their own life expectancies. Workers who believe that an
annuity
based on population life expectancy will be less than actuarially
fair
to them should accept the LS (Hurd and Panis, 2006).
Individuals
with high personal discount rates will place a lower value on the
fu-
ture annuity and thus be more likely to accept the LS.
Earlier studies have found that when the value of the cash
settle-
ment is relatively small, there is a greater likelihood that
workers
7 Benartzi et al. (2011) discuss distributions options chosen by
workers over age 50
the private sector. They find relatively high rates of
annuitization among retiring
workers thus providing evidence against the “Annuity Puzzle.”
They found that institu-
tional arrangements, framing of choices and defaults influence
the decision to opt for
an annuity or a LS.
8 An expanded model of pension decisions by individuals would
include the initial
choice of whether to select a DB plan or a DC plan as their
21. primary retirement plan.
This choice is a function of investment risk, labor market risk,
and a variety of other fac-
tors including whether the worker prefers their retirement plan
to provide a retire-
ment annuity or a LS. In the past decade, a number of states
have given newly hired
employees this option (Clark et al., 2011). Several recent papers
have examined the
choice of pension plans in the public sector (e.g., Brown and
Weisbenner, 2012; Papke,
2004; Yang, 2005)
will take the LS and not roll these funds over into another
retirement
account, thus rejecting a future life annuity (Hurd and Panis,
2006;
Poterba et al., 1998, 2001; Sabelhaus and Weiner, 1999;
Engelhardt,
2002). Hurd and Panis (2006) found that about 20% of
terminating
workers opted for a LS when available and observed that women
were more likely to request cash settlements than men, as were
workers with less formal education. However, others find that
men
are more likely to take LS's (Butler and Teppa, 2007; Purcell,
2009).
Older workers were found to be more likely to have rolled over
their pension distributions (Burman et al., 1999; Moore and
Muller,
2002; Warner and Pleeter, 2001). Many of these previous
studies
addressed workers' implied discount rates and the effect of high
dis-
count rates that minimize the value of the future annuity
compared to
the LS.9 The choice between money now and a lifetime annuity
22. begin-
ning years in the future is also influenced by financial literacy.
Consid-
erable recent evidence indicates that American workers have a
relatively low level of financial literacy (Lusardi and Mitchell,
2007).
Workers that lack a good understanding of financial
mathematics, fi-
nancial market risks, and the uncertainty associated with
mortality
might not be able to determine the optimal choice when faced
with
important financial decisions such as the choice of a LS versus
a future
annuity (see, e.g., Clark et al., 2012).
Despite the impressive list of studies that have examined
distribu-
tional choices and the use of LS's, there remain two important
short-
comings in these analyses. First, relatively few studies have
examined
the choices made by public sector employees. This is an
important
gap because the distributional options in public sector plans
quite dif-
ferent than those in the private sector, and defined benefit plans
are
much more prevalent in the public sector. Second, most prior
studies
used survey data and hence relied on respondents' recall of
decisions
made years earlier. The reliance on memory of these events
undoubt-
edly introduces considerable noise. In contrast, our analysis
focuses
23. on separations from a public defined benefit plan using
administra-
tive records showing real-time decisions. Thus, we are able to
use ac-
tual administrative data on the distributional decision, the
timing of
separation, and the value of the distributional options.
4. Estimating the value of distribution options in the North
Carolina retirement plans
4.1. Background on distributional choices in state-managed
defined
benefit plans
In public sector defined benefit plans, the default option for
departing workers who are vested is to leave their funds in the
pen-
sion plan and receive an annuity when they have attained the re-
quired age for starting benefits.10 All public defined benefit
plans
that we have examined offer departing workers the option of
leaving
their funds in the pension system, thus retaining their eligibility
to re-
ceive a retirement annuity when they reach the specified age
and ser-
vice requirements of the plan.11 Most public plans allow
separated
workers to request a lump sum distribution (LS) at any point up
until the individual starts the retirement annuity.
9 Other papers that examine the utilization of a LS include
Bassett et al. (1998),
Chang (1996), Copeland (2009), and Yakoboski (1997).
10 Ultimately, the default is that no benefits are paid.
Terminated workers who do not
request a lump sum distribution are defaulted into keeping their
24. account open. When
workers finally satisfy age and service requirements for a
benefit, they still must re-
quest that their retirement benefits be paid. No request from the
terminated worker
means that no benefit is paid. Data from the North Carolina
retirement system show
that only in a relatively small number of cases did workers
leave public employment
and never request either a LS or the start of an annuity.
11 Workers who had not yet been employed sufficient years to
achieve vesting would
have to return to a public job covered by the same pension and
work additional years
to satisfy the vesting requirements before they would be eligible
to receive a future
pension benefit.
77R.L. Clark et al. / Journal of Public Economics 116 (2014)
73–88
As described above in Section 2, private sector defined benefit
plans usually do not entail employee contributions.12 In public
retire-
ment plans, on the other hand, employee contributions are
typically
required.13 All state retirement plans that require employee
contribu-
tions for all plan participants offer a LS option to terminated
em-
ployees. Separating workers in these plans are offered a LS at
least
equal to their own contributions. In some states, individuals are
also
awarded interest payments on their contributions. The interest
25. rate
varies across states and is often a function of years of service.
The av-
erage interest rate paid on employee contributions among those
states
with interest payments is 4% per year with a standard deviation
of 2%
(Clark and Hanson, 2011). While the empirical analysis of the
distribu-
tional choices reported in this paper uses administrative records
only
of North Carolina retirement plans, the choices and plan
parameters
imbedded in the North Carolina system are similar to those in
other
retirement plans covering teachers and state employees.14
16 Workers with 30 years of service can receive an unreduced
benefit at any age;
however, in the sample of separated employees that we
examine, there are no individ-
uals with 30 years of service. In addition, early retirement
benefits are available to em-
ployees with 20 years of service at age 50; however, there are
substantial reductions
for accepting early retirement benefits. The magnitude of the
reduction in annual ben-
efits for starting benefits prior to reaching the normal
retirement age vary with age and
years of service. The benefit reductions for TSERS are
presented in the employee hand-
book page 8,
http://www.nctreasurer.com/NR/rdonlyres/223AE566-7BA0-
471F-B02C-
0A18ABDB97C0/0/NC_TeaState_070111_Final.pdf. System
records indicate that only
about 25% of terminated vested workers wait until age 65 to
26. start benefits; however,
4.2. Choices facing separating public sector workers in North
Carolina
Employees who leave public employment in North Carolina
must
decide whether they will accept a LS or leave their pension
account
open in anticipation of a retirement annuity payable from the re-
quired age for retirement benefits. The LS can be known with
certain-
ty; however, the present value of the annuity involves a more
difficult
calculation which should reflect personal discount rates,
expected in-
flation rates, and the likelihood of returning to public
employment in
North Carolina. In order to understand the choice between
accepting
a LS and leaving pension assets in the system, one must
consider key
parameters of the pension plan and how they affect the value of
the
LS that is available at separation versus the annuity expected in
the
future. Public sector workers in North Carolina are also covered
by
Social Security and Medicare.
Like most public retirement plans, both retirement systems in
North Carolina (TSERS and LGERS) require employee
contributions.
The required employee contributions are equal to 6% of total
annual
salary and are deducted from paychecks every pay period. These
con-
27. tributions are deposited in the retirement funds of the two state
sys-
tems and help finance the benefits for retirees. In both North
Carolina
systems, vesting occurs when an employee completes five years
of
service.15 If workers leave public employment prior to being
vested,
their LS is simply the total of their own contributions to the
system;
in other words, non-vested separating workers do not receive
any
interest credited on these contributions and they do not receive
any
portion of the employer pension contributions. Workers leaving
public employment with at least five years of service are
offered a
LS equal to the total of their own contributions during their
employ-
ment plus interest credited at 4% per year. As is typical of most
state
defined benefit plans, even once vested North Carolina public
em-
ployees who request a LS have no claim on the implied
employer con-
tributions to the retirement plan.
12 The Bureau of Labor Statistics (2011a) reports that only 4%
of workers that were
participating in defined benefit plans in the private sector were
enrolled in plans that
required an employee contribution.
13 According to Clark and Hanson (2011), only a few state
retirement plans did not
require workers to contribute a portion of their salary in support
of the retirement
plan. These plans include Arkansas PERS, Connecticut SERS,
28. Florida FRS, Hawaii ERS,
Michigan PSERS and SERS, Missouri MSEP, Tennessee CRS,
and Utah SRS. In these
noncontributory plans, non-vested terminated workers were not
eligible to receive a
future retirement annuity, nor were they eligible for a LS. The
Bureau of Labor Statistics
(2011a) reported that 79% of state and local workers that were
participating in defined
plans were enrolled in plans that require employee contributions
with the mean con-
tribution rate being 6.5% of earnings.
14 Clark and Hanson (2011) provide a detailed summary of the
distribution choices
available to teachers and state employees in all 50 states.
15 Legislation in 2011 raised the vesting requirement from five
years of service to ten
years for all newly hired teachers and state employees;
however, in the sample we
consider, all workers are covered by the five year vesting
provision.
The value of the LS is equal to the total employee contributions
(plus interested if vested) and can be calculated directly from
the sal-
ary history. Appendix A describes the calculation, which is a
direct
function of starting salary, wage growth, years of service, and
the in-
terest rate, but is independent of sex or age. Departing
employees can
learn the value of their LS by checking their account balances
on-line
or by directly contacting the retirement system. Thus, the value
of
one's LS can be known with certainty at the time of separation.
29. The retirement benefit is calculated in a similar fashion to that
typically found in the private sector, using a benefit formula
based
on years of service and final average salary. The systems do not
pro-
vide an estimate of the present discounted value of the annuity
(PDVA) to its members. Using the estimated benefit for each
de-
parting worker, we derive the present value of a future annuity
for
vested workers in the North Carolina TSERS or LGERS
retirement sys-
tem using the same assumptions employed by the retirement
plans to
calculate their pension liabilities. Details of this calculation are
pro-
vided in Appendix A. The PDVA is calculated assuming that the
indi-
vidual will begin receiving an unreduced benefit at age 65.16
To reiterate, the PDVA is not used by the plan to calculate the
LS
and this value is never provided to terminated workers. Instead,
the
PDVA variable represents our estimate using the same life
tables
used by plan actuaries to evaluate the financial status of the
plan,
along with real and nominal interest rates, described in
Appendix A.
Workers with higher personal discount rates will place a smaller
value on the annuity, as will those that believe that they have
lower
life expectancies. The value of the annuity is increasing in
salary
level and the rate of salary growth, as well as number of years
30. of ser-
vice, similar to the LS. However, the PDVA is also an
increasing func-
tion of age at separation. In addition, because women's survival
probabilities are higher than men's, women's PDVA will be
(slightly)
higher than men's with the same annual retirement benefit.17
A potentially important component of the retirement benefits
for
public workers in North Carolina is that the state will continue
to pro-
vide health insurance for retirees in the TSERS system at no
premium,
provided that they are receiving a retirement annuity.18
Benefits are
also available for the spouses and dependents of retirees, with
only
an implicit subsidy.19 For retirees over age 65, Medicare is the
prima-
ry insurer and the state health plan (SHP) becomes the
secondary in-
surer. For eligible state employees and teachers, the value of
health
insurance should be included in the worker's decision whether
to
the reduction factors imposed by the system for early retirement
mean that this as-
sumption does not substantially alter the expected present value
of the annuity. In oth-
er words, the reduction factors are, on average, approximately
actuarially fair.
17 One could instead consider the size and terms of an annuity
which could be pur-
chased at the time of separation with the funds that are
withdrawn. In the private an-
31. nuity market, insurance companies will use similar interest rates
to those we use in our
calculations, but may also charge some commission and may
adjust for adverse selec-
tion (see, e.g., Mitchell et al., 1999). Because individuals could
chose a variety of annu-
ity products, we think framing the discussion in present value
dollars using the
assumptions adopted by the plan actuaries is a more
straightforward comparison.
18 All states have some form of retiree health insurance for
their employees; howev-
er, the value of these plans differs markedly across the states,
see Clark and Morrill
(2010).
19 In North Carolina, spouses and dependents must pay the full
price of the premium,
as calculated based on prior years' expenditures, so we do not
consider the value of
spousal or dependent benefits. There is an implicit subsidy due
to risk pooling. Ac-
counting for this would obviously increase the estimated value
of the health insurance
option.
http://www.nctreasurer.com/NR/rdonlyres/223AE566-7BA0-
471F-B02C-0A18ABDB97C0/0/NC_TeaState_070111_Final.pdf
http://www.nctreasurer.com/NR/rdonlyres/223AE566-7BA0-
471F-B02C-0A18ABDB97C0/0/NC_TeaState_070111_Final.pdf
$5,000
$15,000
$25,000
32. $35,000
25 30 35 40
Age at Hire
Years of Service: 10
LS
PDVA
$5,000
$15,000
$25,000
$35,000
$45,000
$55,000
$65,000
$75,000
$85,000
$95,000
5 10 15 20
Years of Service
33. Hired at Age 30
LS
PDVA
Fig. 2. Simulation of relative values of lump sum distribution
(LS) versus the present
discounted value of the annuity (PDVA). Notes: The values are
calculated for a hypo-
thetical separating employee earning a starting salary of
$30,000 per year with 3%
wage growth. The top chart indicates the data points in dollar
values calculated for a
person with 10 years of service by the age of hire. The bottom
chart indicates the
data points in dollar values calculated for a person who was
hired at age 30 by the
number of years of service. The present discounted value of the
annuity (PDVA) does
not include the value of health insurance. Other simulation
results (shown in
Table 1) that vary the age of hire and years of service show a
clear pattern that the
lump sum distribution (LS) is greater relative to the PDVA for
those hired at younger
ages and with fewer years of service.
Table 1
Value of lump sum (LS) and present discounted value of annuity
(PDVA) for a hypo-
thetical worker.
Age at
Hire
34. Age at
Separation
Years of
Service
LS PDVA
25 30 5 $10,741 $4,916
25 35 10 $25,521 $14,858
25 40 15 $45,485 $33,694
25 45 20 $72,074 $67,967
25 50 25 $107,089 $129,212
30 35 5 $10,741 $6,408
30 40 10 $25,521 $19,377
30 45 15 $45,485 $43,972
30 50 20 $72,074 $89,167
35 40 5 $10,741 $8,357
35 45 10 $25,521 $25,287
35 50 15 $45,485 $57,687
40 45 5 $10,741 $10,906
40 50 10 $25,521 $33,174
45 50 5 $10,741 $14,308
Notes: Values are for a hypothetical worker with a starting
salary of $30,000 and wage
growth of 3%. Calculations of the lump sum distribution value
(LS) and present
discounted value of the annuity (PDVA) are described in the
text and in detail in
Appendix A. The shaded boxes highlight the larger value
35. between the LS and PDVA.
78 R.L. Clark et al. / Journal of Public Economics 116 (2014)
73–88
request a lump sum distribution. However, as discussed further
below, it is difficult to know how much an individual worker
values
access to state-provided retiree health insurance. We describe
our
calculation of the present value of the health insurance option in
Appendix A.
The literature on the “annuity puzzle” highlights a potentially
im-
portant role for health shocks (see, e.g., Brown, 2001).
Individuals
worried about unanticipated health care expenses may choose to
keep assets liquid in order to have funds accessible in the event
of a
health shock. If a retiree does not have access to employer-
provided
health insurance, she may worry about the cost of health
insurance
coverage should an adverse health event occur. Retiree health
insur-
ance insures against this type of risk, and thus may be even
more
valuable to workers than the actuarially equivalent value.
4.3. Simulating the relative values of the annuity and lump
sum distribution
As the above discussion indicates, the value of the LS depends
on
years of service but not on age at hire, while the PDVA is
higher for
36. those who are closer to the minimum required age of eligibility
for
retirement benefits. Thus, as employees accumulate years of
service,
the present value of the annuity will grow relative to the lump
sum.
The top portion of Fig. 2 illustrates this trend using a
hypothetical
male worker in the TSERS retirement system with a starting
salary
of $30,000 who experiences 3% wage growth per year. The
values of
the LS and PDVA are calculated for various ages of hire for a
person
with 10 years of service. The age where the two lines cross
indicates
the youngest age of hire at which the present value of the
annuity
exceeds the lump sum amount for a person with 10 years of
service.
The simulations indicate that for a separating employee with
10 years of service, workers hired at age 35 or older (thus age
45 or
older at separation) have higher PDVA while workers hired
before
age 35 have higher LS values.
The bottom portion of Fig. 2 illustrates a similar pattern, this
time
varying the years of service. For a worker hired at age 30 with a
starting salary of $30,000 and wage growth of 3%, the LS value
will ex-
ceed the PDVA until about 15 years of service, at which point
the
PDVA becomes relatively more valuable. Fig. 2 illustrates how
age at
37. hire and years of service affect the relative values of the LS and
the
PDVA; separating employees with fewer years of service or who
are
younger when hired are more likely to be facing LS values that
exceed
the PDVA values.
To get a more complete picture of how the various combinations
of age at hire and years of service yield relative values of the
two dis-
tribution options, we calculated the LS and PDVA amounts for a
hypo-
thetical worker with starting salary of $30,000 per year and
annual
wage growth of 3%. Table 1 reports these simulated values for
workers hired at various ages as their years of service increase
from
5 to 25 years. The shaded boxes indicate the distributional
option
with the larger value for the indicated age/service combinations.
One should note the years of service that must be completed
before
the PDVA overtakes the LS amount and how this crossing point
varies
by age of hire. For workers hired at age 25, the crossover point
does
not occur until after 20 years of service. At the other extreme, a
work-
er hired at age 40 should anticipate an annuity with a present
discounted value that exceeds the LS by five years of service,
when
vesting begins.
These simple comparisons illustrate why it would not be
surprising
38. if a substantial proportion of terminated employees select the
lump
sum option. The LS will be greater than the present value of the
annu-
ity for many departing workers. This is in stark contrast to
private sec-
tor defined benefit plans which are required by law to price the
LS to
be at least equal to the present discounted value of the annuity.
These relative values suggest that one should observe a
considerable
proportion of vested workers requesting a LS at termination.
It is important to recognize that if one were to add the estimated
present value of health insurance (calculation described in
Appendix
A) to the discounted value of the annuity for participants in
TSERS,
the value of the (cash plus health insurance) annuity is larger
than
the LS for vested terminated workers throughout their career.
Thus,
Table 2
Percent taking a lump sum distribution (LS) by vesting status.
Vested (5+ yrs) Not vested (b5 yrs)
N % LS N % LS
Full sample 11,368 32.36 35,545 35.29
Separation year Year: 2007 5619 34.95 17,836 38.34
Year: 2008 5749 29.83 17,709 32.22
39. Sex Men 3948 34.75 11,822 35.31
Women 6903 26.08 21,924 30.19
Unreported gender 517 98.07 1799 97.33
Total years of service (reported) Yrs service less than 1 11,839
28.46
Yrs service 1–3 16,606 37.84
Yrs service 4 2753 41.30
Yrs service 5–19 11,039 32.60
Yrs service 20–39 280 12.14
Age at separation (calculated) Age 18–24 17 29.41 5183 29.89
Age 25–34 3256 30.62 15,297 33.95
Age 35–49 7055 33.37 13,257 38.63
Retirement system LGERS 3644 40.45 11,023 40.82
TSERS 7724 28.55 24,522 32.80
Job classification
(October 2007–December 2008 only)
Education professionals (excludes higher ed) (1) 2798 19.16
8690 23.27
Skilled labor (2) 772 47.28 2982 36.82
Professional, government, admin (3) 2076 35.69 6148 39.75
University, extension, and community college (4) 184 14.67 323
35.60
Public safety (5) 1148 45.21 3486 43.49
Health and social service professionals (6) 622 27.01 2226
33.38
Regression sample
(non-missing salary and gender)
Regression sample 10,818 29.30
LS > PDVA 7977 29.55
40. LS ≤ PDVA 2841 28.62
Notes: The sample includes all separating employees ages 18–
49 who are not eligible to start an immediate retirement annuity.
The sample size varies across worker and plan
characteristics due to missing values for some workers. Note
that for the regression sample of vested workers, 550
observations were dropped because the present discounted
value of the annuity (PDVA) could not be determined from the
data due to missing gender and/or salary. We report the number
of workers and the percent taking a lump sum
distribution (LS) versus maintaining their account.
79R.L. Clark et al. / Journal of Public Economics 116 (2014)
73–88
for vested workers who are eligible for retiree health insurance
when
they start receiving their retirement annuity, the simple present
value
calculation would suggest that virtually all of these terminated
em-
ployees should maintain their funds with the state retirement
plan.
The value of retiree health is not very sensitive to age at
separation
due to the assumption that medical care costs are increasing at
about the same rate as inflation, so the discounting effect on
future
health insurance is relatively small. For this calculation we
assumed
that workers retire at age 65 and do not claim retiree health
insurance
benefits until age 65, at which point they are eligible for
Medicare as
the primary insurer. If workers were to request an annuity and
claim
41. retiree health insurance earlier, the value of health insurance
would
obviously be larger, and we would predict even more
individuals to
choice the annuity option.
5. Separating public employees in North Carolina: 2007 and
2008
The state retirement system maintains records on current em-
ployees, terminated workers, and retirees consistent with the
data
needed to calculate and pay retirement benefits to plan
participants.
The data presented here are from the State of North Carolina's
retire-
ment systems (TSERS and LGERS) and contain information on
all
workers who left public employment during 2007 and 2008. The
data include the employee's date of birth, sex, salary, and the
retire-
ment plan. In addition, the status of the account is included
indicating
whether the retiree is currently receiving retirement benefits
(and
when the benefits were initiated), whether and when she took a
lump sum distribution (LS), or whether she left the funds in the
plan and the account remained active (the retirement system
refers
to these as “dormant” accounts).20
20 In 2007, the state adopted a new reporting system, ORBIT,
that records much more
detailed information about the workers' separations. Data from
earlier years do not
provide sufficient information to analyze economic factors that
influence the distribu-
42. tional choice.
Our sample includes workers who terminated employment in
2007 and 2008 and who did not retire and begin an annuity
within
one year of leaving the system. We restrict our attention to
separating
employees younger than 50 years old, in order to more closely
ap-
proximate a sample that is not eligible to immediately begin a
pen-
sion, even at a reduced level. Our sample includes 11,368
vested
and 35,545 non-vested separating employees. Appendix B
provides
details on the data construction and how specific variables are
de-
fined, including vesting status and years of service.
To illustrate the distribution choices made by departing
workers,
Table 2 reports the number of vested and non-vested workers
who
left public employment in each year and the percent of each of
the
groups that accepted the LS within one year of separation. In
the
first column of Table 2, we see that about one-third of vested
workers
who left the retirement systems requested a LS within a year of
termi-
nation. The second column of Table 2 reports a similar
breakdown for
non-vested workers. These are individuals who, based on
service to
date, will not be eligible for a retirement annuity and will not
receive
43. any interest on funds left with the system. While one might
have pre-
dicted that nearly all non-vested terminated workers would
select a
LS, this is clearly not the case. Thus, it is important to attempt
to ex-
plain why individuals made a choice that, on its face, seems to
be fi-
nancially costly. The patterns of distributional decisions are
reported
separately for vested and non-vested workers for subgroups
based
on economic and demographic characteristics.
Several similarities are observed in the behavior of vested and
non-vested workers reported in Table 2. Interestingly, roughly
one-
third of both groups, vested and non-vested, accepted the LS
within
one year of termination. Women in both groups were
significantly
less likely to withdraw funds. Older workers in both groups
were
more likely to request a LS and those with more years of service
in
the non-vested group were also more likely to withdraw their
pen-
sion funds, perhaps due to having a larger payment. All of the
non-vested workers had relatively small account balances. For
exam-
ple, an individual that separated after three years of service
whose
80 R.L. Clark et al. / Journal of Public Economics 116 (2014)
44. 73–88
annual salary was $30,000 would have had approximately $5500
in
his retirement account. Hence, there may be a threshold level
that
provides an incentive for workers to make a positive election
for a
LS, while those with only a few thousand dollars in their
account
may be less inclined to seek an immediate distribution.21 In
contrast,
among vested workers, those with the most years of service
were the
least likely to withdraw, which is not surprising given that the
pen-
sion system is most generous for longer tenure workers. This is
also
consistent with findings that private sector workers tend to be
less
likely to request a LS the larger the account balance. Vested and
non-vested participants in the LGERS were more likely to
desire a
cash distribution than those in the TSERS system. As described
above, workers in TSERS are covered by the state health plan
(SHP)
and are eligible for free retiree health insurance, but only if
they are
currently receiving a retirement annuity from TSERS.
There are interesting differences in the desire for a LS across
em-
ployment groups. The administrative records sort individuals by
broad job classifications. Teachers and other educational
profes-
sionals were much less likely to request a LS compared to other
groups, with only about 20% having cashed out their pension
45. ac-
counts. On the other hand, skilled labor and public safety
officers
are among the most likely to have withdrawn.
For each of the individuals in our data, the exact value of the
LS
that they could have received at the time of separation is
reported.
For those that have non-missing salary and sex information, we
use
the assumptions described above to calculate an estimated
present
discounted value of the retirement annuity (PDVA) for vested
partic-
ipants. The value of the LS for each worker is then compared to
our
estimate of the PDVA. The bottom rows of Table 2 show that,
of the
10,818 vested terminated workers for whom we can calculate
the
PDVA, the LS exceeds the PDVA for 7977 individuals (73.7%
of all vest-
ed terminations).22 Surprisingly, only about one third of
separating
workers in both groups (those where the LS exceeds the PDVA
and
those where the LS is less than the PDVA) requested a LS
within one
year of termination. This suggests that the relative value of the
two
distribution options did not strongly influence the choice made
by
separating employees.23
6. Distributional decisions of vested workers
46. Next, we conduct a multivariate regression analysis of the
choice
to withdraw funds and accept a lump sum distribution (LS)
within
one year of separation for vested workers. Theoretically, this
assumes
that the decision to leave is made and then the individual
considers
what to do with his retirement accounts. Access to a LS option
and
the size of account balance may influence a worker's decision to
leave government employment; however, we do not model this
relationship.
Earlier discussion has shown that we should anticipate
differences
in distributional choices based on certain personal and plan
charac-
teristics for two reasons. First, as the simulations reported in
Section 4.3 demonstrate, the relative values of the distribution
op-
tions are a function of a worker's age at hire, years of service,
sex,
and salary. Given differences in the two pension plans, one
might
21 See Benartzi et al., 2011, for a discussion of threshold levels
from behavioral
economics.
22 Remember that this measure of PDVA includes only the
value of the cash retire-
ment benefit and does not include the estimated value of having
access to the subsi-
dized retiree health insurance. When this value is included,
practically all vested
workers have a higher PDVA compared to their account
balance.
47. 23 Butler and Teppa (2007) describe a traditional measure of an
annuity's value as its
Money's Worth Ratio (MWR), which is the ratio of the present
discounted value of the
annuity payments and the initial cost. The MWR is then
determined to be equal to one
if the annuity is well-priced, with the difference usually
attributed to adverse selection
and administrative costs. In our formulation, the PDVA equal to
the LS would be theo-
retically equivalent to a MWR of one.
also anticipate that distributional decisions will vary by
participation
in TSERS or LGERS. Second, previous research has shown that
the
choice to annuitize, holding constant the relative generosity of
the
distribution options, varies by sex, age, and the size of the
pension
account.
We seek to determine whether the choice to withdraw funds is
due to underlying demographic characteristics affecting desire
to
annuitize, or to plan parameters affecting the relative generosity
of
the distribution options. We attempt to measure these two
avenues
by including both demographic controls (to the extent available
in
the data), as well as the size of the LS and our approximation of
the
present discounted value of the annuity (PDVA). Not only are
some
of the variables closely related, but the size of the LS and
PDVA are
48. both functions of salary and years of service, and age is an
important
determinant of the PDVA through its discounting effect (i.e.,
the same
annual retirement benefit starting at age 65 has a higher present
value for those age 45 compare to those age 35). The annual
retire-
ment benefit is exactly determined by annual salary and years of
ser-
vice, and the present value of this benefit is based on the
assumed
interest rate and age of the employee at termination. Thus, one
should be concerned about the inclusion of age, years of
service, sal-
ary, the value of the LS and the PDVA in the same
specification, and
we should expect that the estimated coefficients will be
sensitive to
the inclusion of all of these variables in the same specification.
With these caveats in mind, Table 3 presents coefficients
estimat-
ed from a linear probability model of the decision to withdraw
funds
within one year of separation (request a LS) among workers
who
were vested in the retirement plan.24 We estimate the LS
decision
as a function of the value of the LS (the worker's account
balance at
separation), the calculated PDVA, and an indicator for whether
the
value of the LS exceeds the PDVA. We also include a separate
inter-
cept by year of termination to account for differences in
economic
49. conditions between 2007 and 2008. In columns (2) through (5),
we
incrementally add variables controlling for gender, state or local
re-
tirement plan (TSERS versus LGERS), a quadratic in final
average sal-
ary, a quadratic in age at separation, a quadratic in years of
service to
observe how these variables affect the estimated coefficients on
the
values of the LS and PDVA.
First, we observe that the value of the LS, which is equal to the
em-
ployee contributions (6% of salary) plus interest, has a
quadratic rela-
tionship whereby workers with larger values are less likely to
request
a LS until the account balances reaches approximately $73,000.
Simi-
larly, the estimate of the PDVA has a nonlinear effect on the
distribu-
tional decision with greater values increasing the likelihood of
selecting a LS up to about $93,000 and larger values reducing
the
probability of requesting a LS. The final variable in column (1)
is an
indicator variable for having an account balance (value of the
LS)
larger than the approximated PDVA. The estimated coefficient
indi-
cates that having a LS that is larger than the PDVA is
associated
with a 5.4 percentage point higher probability of requesting a
LS.
This is consistent with expectations, although, as discussed
50. further
below, the effect disappears when age at separation is added in
Col-
umn (4). The estimates indicate that workers separating in 2008
were about 2 percentage points more likely to request a LS than
those who terminated in 2007, and this difference becomes
slightly
larger once additional covariates are added to the model.
Columns (2) through (5) of Table 3 sequentially add covariates
to
the model. First, in Column (2), we see that men were 10
percentage
points more likely to request the LS than were women who
terminat-
ed employment. This is consistent with women being more
likely to
accept defaults. Terminated workers in TSERS were
approximately
10 percentage points less likely to request a LS compared to
24 The coefficients reported in Tables 3, 4, and 5 were
estimated using linear probabil-
ity models. Marginal effects from probit models are nearly
identical and are available
from the authors upon request.
Table 3
Withdrawal decisions of vested workers.
Mean/percent (1) (2) (3) (4) (5)
Value of the LS (10 K) $2.02 −0.188** −0.209** −0.193**
−0.217** −0.236**
(0.018) (0.018) (0.018) (0.019) (0.024)
51. Value of the LS (10 K)2 0.013** 0.014** 0.012** 0.013**
0.017**
(0.002) (0.002) (0.002) (0.002) (0.003)
PDVA (10 K) $1.75 0.093** 0.100** 0.108** 0.136** 0.162**
(0.013) (0.013) (0.013) (0.015) (0.016)
PDVA (10 K)2 −0.005** −0.005** −0.005** −0.006**
−0.007**
(0.001) (0.001) (0.001) (0.001) (0.001)
LS > PDVA 73.7% 0.054** 0.050** 0.061** −0.017 −0.009
(0.015) (0.015) (0.015) (0.018) (0.018)
Male 36.4% 0.101** 0.104** 0.115** 0.119**
(0.009) (0.009) (0.009) (0.009)
TSERS 68.3% −0.104** −0.105** −0.099** −0.097**
(0.009) (0.009) (0.009) (0.009)
Final average salary (10 K) $3.36 −0.027** −0.045** −0.053**
(0.008) (0.009) (0.012)
Final average salary (10 K)2 0.001 0.002* 0.001*
(0.001) (0.001) (0.001)
Age at separation 38.47 0.082** 0.075**
(0.010) (0.010)
Age at separation2/100 −0.115** −0.107**
(0.013) (0.013)
Years of service 9.01 0.024**
(0.006)
52. Years of service2 −0.001**
(0.0002)
Separated in 2008 52.9% 0.018* 0.025** 0.026** 0.027**
0.027**
(0.009) (0.009) (0.009) (0.009) (0.009)
Constant 0.418** 0.477** 0.511** −0.809** −0.742**
(0.017) (0.018) (0.021) (0.171) (0.171)
Notes: The sample is all workers ages 18–49 that terminated
employment in 2007 and 2008 and who were vested with valid
entries for the above covariates, N = 10,818. For more
information on the sample for this table, see Table 2 and
Appendix B. The dependent variable is the decision to withdraw
the account balance and take a lump sum distribution (LS)
within one year of separation versus maintaining the account
(leaving it open with the possibility of electing for an annuity
once eligible), approximately 29.3% of the sample
requests a LS. The (LS > PDVA) is an indicator for whether the
value of the LS is greater than the calculated present discounted
value of the annuity (PDVA). Coefficients are esti-
mated from a linear probability model with standard errors in
parentheses. *Significant at 5%; ** significant at 1%.
81R.L. Clark et al. / Journal of Public Economics 116 (2014)
73–88
comparable workers leaving LGERS, which is expected given
the po-
tential value of retiree health insurance for workers covered by
TSERS. Introducing these two variables has virtually no effect
on the
estimated coefficients in the specification shown in Column (1).
In Column (3), we observe that the final average salary (i.e., the
average salary over the past four full years of employment) has
53. a
u-shaped relationship with the probability of requesting a LS.
The ef-
fect is negative up until a salary of over $112,500 (depending
on the
specification) and then for higher salaries becomes positive.
Adding
the salary variable also has little effect on the other
coefficients. Col-
umns (4) and (5) report the estimates when age at separation
and
years of service are added to the model. Age has an inverted
u-shaped relationship with distributional choice, where the
youngest
and oldest workers are least likely to choose a LS. Depending
on the
specification, the effect of age on the probability of receiving a
LS is
positive but declining up until the worker reaches
approximately
age 35 after which age has a negative effect on accepting a LS.
One
possible explanation for this pattern is that older workers are
closer
to being able to start a retirement annuity, so experience less
discounting due to having to wait to claim the benefit. It may
also re-
flect a greater confidence by older workers that retirement
benefits
will not be reduced for them or greater salience of the need for
retire-
ment income among workers nearer to retirement. Note that
adding a
quadratic polynomial in age to the regression reduces the
estimated
impact of having a larger value of the LS than the PDVA from
54. being
positive and significant to being negative and insignificant.
The relative size of the LS and PDVA is highly correlated with
age,
as illustrated in the simulations reported in Table 1 and shown
in
Fig. 2. The annuity value is discounted back to the current age,
so
those who are closer to retirement have less discounting.
Meanwhile,
the LS is not a function of age, so older individuals are more
likely to
have higher PDVA than LS relative to younger individuals. We
see this
in the data where, for example, among workers age 45 and older
at
separation only 11% have larger LS's than PDVA's, while
almost 90%
of workers less than age 45 have a higher value of their LS than
PDVA. It is therefore difficult to separately identify the effects
of age
and the relative value of the LS and PDVA.
In the final column of Table 3, we see that adding a quadratic in
years of service leaves the other estimates basically unchanged.
Hold-
ing all else constant, including the values of LS, PDVA, and
age,
workers are more likely to withdraw with more years of service
up
to 12 years of service, at which point longer tenures are
associated
with a reduction in the probability of accepting a LS. In general,
the
observed relationships between both demographic
55. characteristics
and work history and the probability of withdrawing funds
conform
to expectations. We next propose several reasons why workers
might not be highly responsive to the relative size of the LS and
PDVA.
7. Potential explanations for the observed distributional
decisions
We postulate four main hypotheses on why the relative size of
the
lump sum distribution (LS) and the present discounted value of
the
annuity (PDVA) might not affect the distributional choice in the
man-
ner initially expected: (1) the potential of subsidized health
insurance
in retirement if one selects an annuity, (2) the likelihood of
returning
to work and continuing to build years of service, (3) economic
condi-
tions and alternative investment opportunities, and (4) inertia,
inad-
equate financial literacy, peer effects, and the lack of
knowledge
about the choices and their relative value. We now consider
each of
these relationships and their potential effect on the
distributional
choices of terminated vested workers. A discussion of how these
fac-
tors might influence non-vested workers follows in Section 8.
The calculation of the PDVA makes a series of assumptions
includ-
56. ing a personal discount rate and a life expectancy from an
actuarial
82 R.L. Clark et al. / Journal of Public Economics 116 (2014)
73–88
life table. In addition, we are assuming that individuals are risk
neutral.
In this context, risk neutrality is a benign assumption, since
technically a
worker could withdraw funds and immediately roll them over
into an-
other tax qualified account. Because workers that request a LS
have the
option of rolling funds over into another tax qualified account
without
paying a penalty, or may withdraw funds but still save for
retirement
using other means, attitudes towards risk cannot explain choices
in
this particular context. An individual that has a higher personal
discount
rate or a lower life expectancy would value the annuity less than
our
calculation and would be more likely to take a LS. Similarly,
separating
workers that have a bequest motive would be more likely to
withdraw
funds. These and other personal characteristics have been
proposed in
the literature to explain the annuity puzzle that people do not
purchase
annuities, but do little to explain our results.25
7.1. Access to subsidized health insurance in retirement
57. The present value of the retirement annuity in the regression
anal-
ysis was based solely on the cash benefit one could expect to
receive
in retirement. However, as described above, vested employees
in the
TSERS (teachers and state government workers) system who
leave
their pension account open and ultimately receive a retirement
ben-
efit are also eligible to participate in the state health plan (SHP)
once they begin receiving the pension. The state will pay 100%
of
the health insurance premium for these former employees.26
Persons
who accepted the lump sum are not eligible for participation in
the
state health plan in the future.
Appendix A provides a calculation of the present discounted
value of
health insurance beginning when the retirement annuity starts
and
ending with death. Health insurance is a relatively valuable
benefit,
and according to our calculations described in Section 4.3, those
who
anticipate taking advantage of this benefit would see the PDVA
plus
the present value of the health insurance exceed the LS amount
regard-
less of years of service and/or age at hire. To give a sense of the
magni-
tude of the health insurance benefit relative to the annuity in the
data,
58. we estimate that the present discounted value of health
insurance for
our sample is between $37,225 and $47,854, depending on the
individ-
uals' age at separation and sex.27 We find that all but ten vested
separat-
ing workers have smaller LS's when compared to the combined
value of
the PDVA and health insurance benefit. When considering the
choices of
workers covered by retiree health insurance, it is much less
surprising
that only 29% choose to withdraw funds within one year of
separation.
Of course, this assessment of the relative value of the
distribution-
al options assumes that the departing worker believes that the
benefit
will still be provided by the time she retires and that she intends
to
claim the health insurance benefit. The cost and liabilities
associated
with state retiree health plans have been critically examined
since
new reporting standards were required by the Governmental
Accounting Standards Board (Pew Center on the States, 2011;
Clark
25 Brown (2001) discusses the annuity puzzle in detail in a
similar context for private
sector workers. He surveys the empirical work on this issue and
develops a concept of
annuity equivalent wealth variable to partially explain decisions
to annuitize wealth in
defined contribution retirement plans.
26 In 2011, the North Carolina General Assembly passed
59. legislation that for the first
time required a premium to be paid by active and retired
workers for the Standard Plan
offered by the state; however, workers and retirees still had
access to the Basic Plan
without having to pay a premium (Clark and Morrill, 2011).
27 To the extent that some vested workers will start their
retirement annuity prior to
age 65, the value of retiree health insurance is underestimated,
perhaps by a consider-
able amount. Individuals who are receiving a retirement annuity
are covered by the
state health plan regardless of age or whether the person is
receiving a normal retire-
ment benefit or one reduced due to age and service. For
example, a worker who was
hired at 25 and left state employment at age 45 could select to
begin a reduced retire-
ment benefit at age 50, she would also be eligible to participate
in the state health plan
at no premium. The subsidy for the health insurance does not
vary with age at which
the individual retires. As noted earlier, the value of the pension
benefit is actuarially re-
duced to reflect earlier retirement ages; but as we see here, the
present value of the
health insurance would be much higher for those who accept
benefits prior to age 65.
and Morrill, 2010). The unfunded liabilities have been widely
reported in the popular press, and many states (including North
Carolina) have been modifying the terms of these plans. Thus, it
would not be surprising if public employees doubted that the
current-
ly promised benefits will still be provided in 10 or 20 years.
Reflecting
this concern, terminated workers may further discount the value
60. of
future health insurance in retirement provided by the state. In
addi-
tion, some workers may have access to health insurance through
spousal coverage, so they might not value this benefit as much.
7.2. Potential for returning to work and the distributional choice
If terminated workers anticipate that they may return to public
employment in North Carolina, they may wish to keep their
accounts
open. Terminated workers who return to public employment will
re-
tain their service based on previous public employment
provided
they kept their accounts open and do not take a LS. Thus, an
employee
who temporarily leaves her job due to medical or family reasons
with
the intent of returning to public employment within a few years
may
find it convenient and cost-effective to leave her account open.
More-
over workers who accept the LS can “purchase back” their prior
years
of service at a price specified by the plan.
To explore this question, we consider all workers who left the
re-
tirement systems in 2007 and 2008 and observe whether they
had
returned to public employment by the end of 2009. Surprisingly,
a
greater proportion of those who returned to public employment
had accepted a LS. Among those that returned to employment,
44%
61. of the vested and 48% of the non-vested terminators had
selected a
LS. In contrast, only about one-third of both vested and non-
vested
employees who had not returned to public employment chose a
LS.
It should be emphasized that our time period for return to work
is
only one to two years, so the impact could be substantially
different
if we had data over a longer time period.
7.3. Economic conditions and alternative investment options
Accepting a LS gives terminated employees access to retirement
funds that can be either rolled over into another tax qualified
account,
invested in a non-retirement account, or spent on consumption.
A ter-
minated worker can request a LS at any time after leaving
public em-
ployment up until she actually starts a retirement annuity. For
vested
individuals, the account balance continues to increase each year
by a
plan-specified interest rate of 4%. Thus, a well-informed
individual
could view leaving her retirement account open as an
investment op-
tion. In other words, she could request a LS and invest the
money her-
self or leave the money with the state plans and earn a
guaranteed
return of 4%.28 Given the uncertainty in the financial markets
during
this period, a guaranteed return of 4% may have been an
62. attractive in-
vestment. Data provided by the retirement system suggests that
most
LS's occur relatively close to the date of termination.29 A
longer time
series on when terminated workers requested a LS would
provide bet-
ter insight into this issue.30
28 The account balance is not adjusted for inflation.
29 In 2010, 12,501 terminated workers accepted a LS. Of these
8473 individuals re-
ceived the distribution within one year of termination, another
1234 had been gone
for between one and two years, and another 1677 requested a LS
between two and five
years after leaving the retirement systems. Thus, 91% of all
LS's paid in 2010 were to
individuals who left public employment within the last five
years.
30 An interesting thought experiment is to consider a
hypothetical pension plan with all
the characteristics of the North Carolina plan except that there
is no annuity benefit. This
simplifies the distributional choice to taking an immediate LS
or leaving the account open
and take the LS at some future date with the account balance
increasing by 4% per year. If
we could observe individuals covered by such a plan, it would
be interesting to know the
distribution of when workers accepted a LS. In essence, this
becomes a portfolio choice
with the pension serving as a guaranteed value fund with a 4%
return. Depending on per-
sonal characteristics and the size of the pension account, we
would probably observe
some variation in the time since termination that the LS is
65. .4
.4
5
F
ra
ct
io
n
W
ith
d
ra
w
2007m1 2007m7 2008m1 2008m7 2009m1
Year and Month of Separation
Fraction Withdrawing S&P 500
Unemployment Rate
Fig. 3. Fraction withdrawing funds, alternative investment
options, and local economic conditions.
83R.L. Clark et al. / Journal of Public Economics 116 (2014)
73–88
To the extent possible given the short time period over which
our
data span, we can consider the manner in which distributional
66. deci-
sions are influenced by outside investment opportunities. In Fig.
3,
we plot the fraction of workers that withdraw funds within a
year
by the month of separation. We see that the probability of
withdraw-
ing funds drops fairly steadily over the two year period from
January
2007 through December 2008. On this same graph, we plot the
12-month return in the S&P 500, which follows a similar
pattern.31
However, one must recognize that returns to such investments
are
correlated with many other macro-level variables, such as the
state
unemployment rate, which may affect the need for immediate
access
to funds. Indeed, when adding a plot of the North Carolina state
un-
employment rate to Fig. 3, we see that the trends mirror those of
the S&P 500.32 We expect that job market opportunities, the
need
for liquidity, and the opportunity costs of investments will all
influ-
ence an individual's choice of withdrawing funds. Note that
over
this same time period the 1-year Treasury bond rate reached a
high
of 5.06% and a low of 0.49%.33 We did not include this plot in
Fig. 3
for simplicity, but the decline in the Treasury bond return rate
closely
tracks the other trends in the figure and is included in the
regression
67. analysis below.
In addition to this investment effect, adverse economic
conditions
may affect employees' confidence in the retirement system and
their
perception of the state's willingness and ability to honor future
retire-
ment payments. Over the past few years, the popular press has
in-
cluded many front page stories about the financial problems
facing
public pension plans, including the rising cost of providing
these ben-
efits and low funding ratios. North Carolina has one of the best
funded
public pension plans in the U.S. Analyzing 2009 pension data
from the
31 The S&P 500 rate of return was calculated by comparing the
adjusted close in the
month prior to separation to that 12 months prior, so that the
return for those separat-
ing in December of 2007 was equal to the difference in the
adjusted close in November
2007 and November 2006, divided by the adjusted close in
November 2006. These
data were downloaded from the
http://finance.yahoo.com/q/hp?s=%5EGSPC+
Historical+Prices, [accessed February 8, 2013].
32 The North Carolina monthly unemployment rate is from the
Bureau of Labor Statis-
tics, Local Unemployment Rate Series, LAUST37000003,
available at http://data.bls.
gov/timeseries/LAUST37000003, [accessed February 6, 2013].
33 The 1-Year Treasury Constant Maturity Rate (GS1) data
were obtained from http://
68. research.stlouisfed.org/fred2, [accessed February 4, 2013].
Comprehensive Annual Financial Reports of the states, the Pew
Center on the States (2011) ranks North Carolina as the fourth
best
funded state retirement plan, with a funding ratio of 97%.34
Still,
many states have been making major changes in their retirement
plans. In most states, changes will apply only to new
employees.
However, some states whose plans are facing substantial
funding
problems have been altering the benefits for current workers
and re-
ducing COLAs for current retirees. In this environment,
terminated
workers in North Carolina might have questioned whether their
pen-
sion plans would remain unchanged for 10, 20 or 30 years.
Doubts
about the stability of the plans may have led some separated
workers
to be more likely to request a LS.
Because these factors tend to move together, it is difficult to
disen-
tangle the independent effects of each. Still, we explore these
rela-
tionships further in a regression context in Table 4, Columns 1–
5.
Using the specification in Column 5 of Table 3, we include the
1-year US Treasury bond rate, the 12-month prior return to the
S&P
500, and the monthly unemployment rate.35 We also present a
spec-
ification where we drop the indicator variable for the year 2008
to
69. allow for the full variation in these trends to be utilized.36 In
Table 4, Column 1, we see that when entered individually into
the
specification, the estimated coefficient for the 1-year Treasury
bond
rate is negative and insignificant. In contrast, in Column 2, the
esti-
mated coefficient on the gain in equity values is positive and
signifi-
cant, indicating that a higher growth in equity values increases
the
likelihood of accepting a LS. Interestingly, as seen in Column 3,
a 1%
higher state unemployment rate in the month of termination is
asso-
ciated with a 3 percentage point decline in the probability of
with-
drawing funds. This could reflect a difference in who is
terminating
employment in a given month, or it could indicate that when job
34 While most economists believe that the assumed rates of
return in these reports
are too high, the relative ranking of the North Carolina
retirement system as one of
the best funded retirement plans does not change when lower
rates of return are
employed (Novy-Marx and Rauh, 2011).
35 These parameters are defined in footnotes 31–33.
36 Each of the investment opportunity/macroeconomic indicator
variables are mea-
sured at the month of termination, although the dependent
variable is whether funds
were withdrawn within a year of separation. While one could
conceive of a model
where the cumulative effects of these factors are accounted for,
with only two years
70. of data estimating such a model is not practical.
http://finance.yahoo.com/q/hp?s=%5EGSPC+Historical+Prices
http://finance.yahoo.com/q/hp?s=%5EGSPC+Historical+Prices
http://data.bls.gov/timeseries/LAUST37000003
http://data.bls.gov/timeseries/LAUST37000003
http://research.stlouisfed.org/fred2
http://research.stlouisfed.org/fred2
Table 4
Economic conditions, peers, and the withdrawal decisions of
vested workers.
Mean (1) (2) (3) (4) (5) (6)
Investment opportunities
1-year treasury bond constant maturity rate 3.1 −0.003 (0.007)
−0.017 (0.011) −0.031** (0.001)
S&P 500 12 month return −1.3 0.001* (0.0005) −0.0001 (0.001)
0.0004 (0.001)
NC economic conditions
State unemployment rate 5.63 −0.030** (0.007) −0.038**
(0.014) −0.029* (0.013)
Actions of peers
Fraction in 3-digit zip 0.302 0.288** (0.079)
Fraction in agency 0.301 0.458** (0.033)
Selected covariates
LS > PDVA 0.737 −0.009 (0.018) −0.009 (0.018) −0.010
(0.018) −0.011 (0.018) −0.011 (0.018) −0.010 (0.018)
Separated in 2008 0.529 0.019 (0.021) 0.061** (0.016) 0.075**
(0.015) 0.040 (0.023) 0.029** (0.008)
71. Notes: The sample and specification are identical to Table 3,
Column (5) with the inclusion of investment opportunities, local
economic conditions, and peer behavior, as indicated.
Column (5) includes dummy variables for living in a zip code or
separating from an agency with fewer than 5 peers in the
sample. Coefficients are estimated from a linear
probability model with standard errors in parentheses.
*Significant at 5%; ** significant at 1%.
84 R.L. Clark et al. / Journal of Public Economics 116 (2014)
73–88
opportunities are fewer then demand for LS fall. This finding
does
suggest that liquidity constraints are not that important to this
deci-
sion, since we would expect cash needs to rise when the
unemploy-
ment rate is higher. In Column 4 of Table 4, we include all three
variables in the same specification and find that only the state
unem-
ployment rate has a significant effect. However, when we do not
in-
clude the year 2008 dummy variable in Column 5 we see that
the
estimated coefficient on the 1-year Treasury bond rate becomes
larg-
er and is statistically significantly negative.37
Although our data only span two years, there is quite a bit of
monthly variation in these trends. However, to truly understand
the
effects of investment options and economic conditions would
require
a much longer time series and a richer variety of economic and
investing environments. Still, the results presented in Column 5
are
72. not consistent with an investment opportunity cost story, where
indi-
viduals are more likely to take money out when investment
opportu-
nities are good. Nor are the results consistent with a story about
liquidity or the need for cash during an economic downturn.
Similar-
ly, if confidence in the system is correlated with economic
conditions,
we again do not see evidence that as “confidence” falls,
withdrawals
rise. One alternative explanation is that when economic
conditions
are uncertain, then individuals do not make financial decisions
and
are more reliant on defaults.
7.4. Financial literacy, plan knowledge, peer effects, and inertia
Considerable survey evidence indicates that workers have a low
level of financial literacy, inadequate knowledge about their
pension
plans, and poor understanding of how choices can affect the
value
of retirement accounts (Lusardi and Mitchell, 2007; Clark et al.,
2012). If workers who leave the North Carolina retirement
system
possess the same low levels of knowledge, it should not be
surprising
that they do not always select the option that has the greatest
present
value. While information about the size of the LS is easily
available,
separating workers may not be able to determine the value of
the re-
tirement annuity. Calculating the present value of an annuity 20
or
73. even 30 years in the future is not a simple task, even for
individuals
who have high levels of financial literacy.
The default option is to maintain the retirement account until
the
terminated worker either requests a LS or, once eligible, a
retirement
benefit. There were no changes in the default during our sample
peri-
od and thus, we are not able to investigate how changes in the
default
might have altered the distributional choices of departing
workers.
37 In a related context, Goda et al. (2012) consider how
retirement intentions are
influenced by investment returns in the year prior to survey for
respondents in the
Health and Retirement Study (HRS). They also document that
the collinearity of stock
returns and labor (and housing) market conditions makes
separately identifying the
effects difficult.
However, recent research has shown that defaults matter in the
selection of various pension options and inertia associated with
the
acceptance of defaults could also be affecting the distributional
choices (e.g., Madrian and Shea, 2001). Brown et al. (2008b)
described
an important role for framing. If workers accept defaults due to
inertia
or lack of understanding, or are not appropriately valuing
benefits,
then public employers could improve separating workers'
welfare by
providing timely and accessible financial education and
74. information.
The retirement system sends all separated employees who
request
a LS a personalized form letter (shown in Appendix C),
regardless of
their vesting status or the relative size of their benefits. The
letter
contains a warning that if the refund is processed the individual
will
forfeit a future annuity benefit. A separating worker who is not
confi-
dent in his/her choice may be swayed by the strong wording in
this
letter. We do not know how many individuals first applied but
then
ultimately chose not to withdraw funds after having received
this
letter.
Workers who are unsure about their distributional decisions may
rely on their colleagues or neighbors for advice (Brown et al.,
2008a).
We investigate the importance of peer effects by adding two
variables
to the specification in Column 6, Table 3: the fraction of
terminating
participants who live in the same 3-digit zip code who selected
a LS
and the fraction of terminating participants who worked in the
same agency who chose a LS.38 Both of these variables are
positively
and significantly related to the probability of selecting a LS.
This is
consistent with peer effects influence distributional decisions.
However, as described in Manski (1993), the estimated
75. coefficients
may instead reflect the fact that peers share similar
(unobservable)
characteristics and so their choices may be correlated. Although
we
find that individuals behave similarly to their peers, this is not
neces-
sarily a causal effect.
8. Distributional choices of non-vested workers
Workers leaving public employment with fewer than five years
of
service are not vested according to the rules of both retirement
plans
(TSERS and LGERS), so they are not eligible for a retirement
annuity
based on service at the time of termination. Accordingly, the
lump sum distribution (LS) available to them is the sum of their
own
pension contributions during their employment without any
interest.
Nevertheless, they are not required to immediately request a LS
and
the default is to maintain the account with the system. Given the
choice
of money now or the same amount of money at some future
date, we
would expect that all non-vested terminated workers would
request
immediate LS's. Yet, Table 2 shows that only about one-third of
these
38 These variables are defined by taking the average across all
workers within the cell,
excluding the individual.
76. Table 5
Withdrawal decisions of non-vested workers.
Mean/percent (1) (2) (3) (4)
Value of the LS (1 K) $3.15(K) 0.030** 0.029** 0.028**
0.022**
(0.001) (0.001) (0.001) (0.002)
Value of the LS (1 K)2 −0.001** −0.001** −0.001** −0.001**
(0.000) (0.000) (0.000) (0.000)
Male 33.3% 0.043** 0.045** 0.047**
(0.005) (0.005) (0.005)
TSERS 69.0% −0.062** −0.061** −0.064**
(0.005) (0.005) (0.005)
Age at separation 33.3 0.016** 0.017**
(0.003) (0.003)
Age at separation2 −0.019** −0.019**
(0.004) (0.004)
0–0.99 Years of service 33.3% −0.053**
(0.010)
1–1.99 years of service 28.2% 0.009
(0.008)
3–3.99 years of service 12.2% −0.019*
(0.009)
4–4.99 years of service 7.8% −0.025*
(0.012)
77. Separated in 2008 49.8% −0.067** −0.003 −0.003 −0.002
(0.005) (0.005) (0.005) (0.005)
Constant 0.311** 0.277** −0.049 −0.023
(0.005) (0.006) (0.050) (0.051)
Notes: The sample is all workers ages 18–49 that terminated
employment in 2007 and 2008 and who were not vested (less
than five years of membership plus non-contributory
service) with valid entries for the above covariates, N = 35,545.
For more information on the sample for this table, see Table 2
and Appendix B. The dependent variable is the de-
cision to withdraw the account balance and take a lump sum
distribution (LS) within one year of separation; approximately
35.29% chose this option. The omitted category is 2–
2.99 years of service. Also included in the specifications in
Columns (2)–(4), but not reported, is a dummy variable for
gender unknown (5.1% of the sample). Coefficients are es-
timated from a linear probability model with standard errors in
parentheses. *Significant at 5%; ** significant at 1%.
85R.L. Clark et al. / Journal of Public Economics 116 (2014)
73–88
former public employees requested a LS in the first year
following
termination.39
At first glance, this is quite puzzling. Unlike the vested
workers,
non-vested terminated employees cannot look forward to a
retire-
ment annuity, will not be eligible for state-provided retiree
health
insurance, and do not earn interest on the money left with the
retire-
78. ment system. But workers with short service may have paid very
little
attention to their pension accounts, and upon termination, may
be un-
aware of the value of their accounts and the distributional
options
available to them. Inertia is often given as an explanation of
certain
types of behavior and could also be a factor in lack of
immediate LS's.40
Still, there may be a fully rational reason for a separating
employee
to leave the monies in the system, even if not vested. Employees
who
leave public employment but who anticipate returning to a
govern-
ment job may have an economic incentive to leave their pension
ac-
counts open, as returning civil servants who have not closed
their
pension accounts can count prior years of service in the
determina-
tion of future retirement benefits. If this motive explains the
distribu-
tional choices of non-vested employees, it would indicate
rational
decision making based on considerable knowledge of the
pension
plan. Family circumstances, such as the birth of a child or
relocation,
can also result in individuals quitting current employment and
having
temporary periods outside the labor force. The public sector is
rela-
tively large and all public employees are covered by the same
79. system,
offering considerable opportunities for future employment in
either
TSERS or LGERS. Nevertheless, the analysis of 2007–2008
termina-
tions described in Section 7.2 does not support the hypothesis
that
39 Using a longer time series, it would be interesting to
discover whether these indi-
viduals ever return to public employment in North Carolina and
ultimately become
vested in the retirement plan, whether they ever request a LS, or
whether these funds
are permanently lost to the individual.
40 Interestingly, inertia may be overcome by certain events. The
state retirement sys-
tem reports that requests for lump sum distributions from
previously terminated
workers often spike just before Christmas.
expectations of returning to work is a cause of keeping one's
account
open since a larger proportion of those that returned to work
had ac-
cepted a LS than those that had not yet returned to work.
To further examine the distributional choices of non-vested em-
ployees, we estimated a linear probability model with the
dependent
variable being an indicator for whether separating workers
chose to
withdraw their accounts and accept the LS's from the retirement
plan within one year of terminating employment. The results of
this
regression are presented in Table 5. We first consider how the
value
of the possible LS (the account balance) influences the choice
80. of with-
drawing funds. This relationship is shown to be quadratic,
whereby
the probability of withdrawing is increasing until the value of
the ac-
count reaches approximately $15,000, at which point the
relationship
becomes negative. Since none of these workers is eligible for an
annu-
ity, it is somewhat surprising that we observe this pattern,
although it
may be due to the possibility of returning to work in the future.
In Table 5, Column 2, we observe that men were more likely to
withdraw money. This could be due to less inertia or more
knowledge
among men. As was the case for vested employees, members of
TSERS
were significantly less likely to accept a LS than those in
LGERS. Again,
consistent with the patterns for vested workers, the youngest
and
oldest non-vested separating workers were least likely to
withdraw
funds, with the highest probability of withdrawing around age
42.
As discussed earlier, this might be due to lack of knowledge or
be-
cause of a higher likelihood to return to work among the
youngest
workers. In the final column of Table 5, we observe that
controlling
for years of service diminishes the coefficient on the account
balance
at separation somewhat. Here the omitted category is 2–2.99
years of
81. service and we observe that among non-vested workers those
with
approximately 1–2.99 years of service are the most likely to
with-
draw. We observe across the columns of Table 4 that the
importance
of the size of the LS is only partially explained by observed
work his-
tory and demographics, and the basic pattern suggests that those
with the smallest and largest potential LS values are the least
likely
to withdraw within one year of separation.
41 In addition, the retirement annuity from the state plan is
approximately a real an-
nuity with benefits typically being increased each year by the
legislature at a rate near
the level of inflation. In contrast, the annuity that one could
purchase in the market un-
der these assumptions would be a nominal annuity.
Table 6
The decision to cash out versus rollover benefits among vested
and non-vested workers accepting a lump sum distribution (LS).
Full sample (88.7% cash out) Vested (87.3% cash out) Non-
vested (89.1% cash out)
(1) (2) (3)
Mean Coeff. Mean Coeff. Mean Coeff.
Value of the LS (10 K) 0.66 −0.238** 1.75 −0.141** 0.35
−0.487**
82. (0.013) (0.036) (0.029)
Value of the LS (10 K)2 0.020** 0.007* 0.075**
(0.002) (0.003) (0.012)
Final average salary (10 K) 3.12 −0.008
(0.018)
Final average salary (10 K)2 0.002
(0.001)
Vested 22.7% 0.074**
(0.011)
Male 34.2% 0.031** 43.3% 0.027* 33.3% 0.033**
(0.005) (0.012) (0.006)
Unreported gender 13.9% 0.030** 14.0% 0.033**
(0.008) (0.009)
TSERS 63.2% −0.017** 60.0% −0.007 64.1% −0.020**
(0.005) (0.012) (0.006)
Age at separation 34.9 0.009** 38.4 0.008 34.0 0.010**
(0.003) (0.012) (0.003)
Age at separation2/100 −0.010* −0.009 −0.012*
(0.004) (0.015) (0.005)
Years of service 3.42 0.024** 8.48 0.014 1.95 0.047**
(0.004) (0.011) (0.010)
Years of Service2 −0.0004 0.0001 0.002
(0.0002) (0.0004) (0.002)
Separated in 2008 45.7% 0.024** 54.0% 0.029* 45.5% 0.026**
83. (0.005) (0.012) (0.006)
Constant 0.744** 0.783** 0.734**
(0.055) (0.221) (0.060)
Observations 16,213 3,167 12,7537
Notes: The samples include only those separating workers who
take a lump sum distribution (LS). For more information on the
sample for this table, see Table 2 and Appendix B.
Note that in Column (2) only workers whose final average
salary could be calculated are included in the sample, as in
Table 3. The dependent variable is the decision to cash out the
account balance (active termination refund or active termination
refund federal tax) instead of directly rolling over into an IRA
within one year of separation. Coefficients are
estimated from a linear probability model with standard errors
in parentheses.
*Significant at 5%; ** significant at 1%.
86 R.L. Clark et al. / Journal of Public Economics 116 (2014)
73–88
9. Cash distributions or rollovers: leakages from
retirement wealth
The analysis thus far indicates that only about one third of all
ter-
minating public employees in North Carolina request a LS
distribution
while two thirds leave their retirement funds in the system.
Thus, the
extent of retirement saving leakage among these workers is
limited.
However, among those requesting a LS distribution the risk of
leakage
is high. Terminated employees who have requested a lump sum
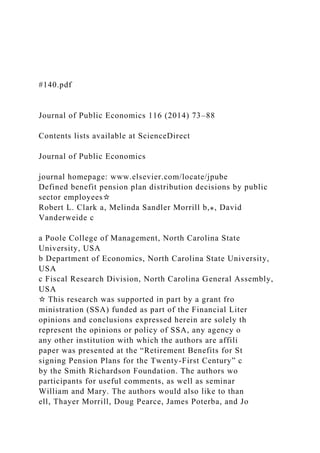
![and comments.
⁎ Corresponding author at: Department of Economics
sity, Box 8110, Raleigh, NC 27695-8110, USA. Tel.: +1 9
E-mail address: [email protected] (M.S. Mo
0047-2727/$ – see front matter © 2013 Elsevier B.V. All
http://dx.doi.org/10.1016/j.jpubeco.2013.05.005
a b s t r a c t
a r t i c l e i n f o
Article history:
Received 16 October 2012
Received in revised form 22 February 2013
Accepted 28 May 2013
Available online 11 June 2013
JEL Classification:
H7
J4
J3
Keywords:
Public employees
Defined benefit pensions
Distribution choices
Studies examining pension distribution choices have found that
the tendency of private-sector workers is to
select lump sum distributions instead of life annuities resulting
in leakage of retirement savings. In the public
sector, defined benefit pensions usually offer lump sum
distributions equal to employee contributions, not
the present value of the annuity. Thus, for terminating
employees that are younger or have shorter tenures,
the lump sum distribution amount may exceed the present value
of the annuity. We discuss the factors that](data:image/gif;base64,R0lGODlhAQABAIAAAAAAAP///yH5BAEAAAAALAAAAAABAAEAAAIBRAA7)