1. TRAFFIC SIGN BOARD AND SYMBOLES AWARNESS.
(A TRUCK DRIVERS SPECIFIC STUDY IN NORTH DELHI)
(SPECIAL REFERENCE ON SANJAY GHANDHI TRANSPORT NAGAR DELHI)
CHAPTER-1
INTRODUCTION & OBJECTIVE OF THE STUDY
INTRODUCTION
The research has conducted on specific group of drivers (truck drivers). In India where day by
day accident increasing and drivers don’t obey the traffic rule. And some drivers jump the red
light and other traffic road signs. If we see old records of road accident increasing day by day. It
may be some drivers had got driving just because they give they some handsome amount brokers
and broker provide them license help of some source. When the drivers drive the any type of
vehicle they will be made mistake on road that’s why the road accident happened. In this type of
case many people loss their life and so many insured.( The first one occurred on 10 january 2013
in bihar. A truck carrying several people lost its balance and a minimum of 25 people died. This
included 11 children as well. The second one happened in Punjab on 4 march 2013. A school
bus hit a truck and 12 people – a driver and 11 children – lost their lives. 10 children were
injured in the same.
The main problem of this type case the driver has not face the basic information of the road
safety . And some cities it will become major problem of the traffic block. And in Delhi it is the
big issue that people park the vehicle on road and they stop the vehicle where they want to stop.
And truck drivers also park track on road and some truck drivers don’t obey the traffic rule like
no entry and some time they jump the red light and some time they carrier over load and much
more rules they disobey. That’s why the accidents in india increasing and there is many way to
control the road accidents and traffic control. But some time due to some corrupt traffic police
officer they will do this type things in daily basis.
There are many way to control over the traffic rule disobeys drivers like red light, traffic police
officers, speed controller unit, 5 no. mostly people address the them 5 no. wale. And the traffic
police provide them guide line of all rut and they guide them by road signs, companion,
advertisement, by school of traffic training and also by exam while people apply for license, the
transport department provide all guide line by tv. Radio, enter net, news paper etc. they use all
medium which will reached to maximum people. The transport department use CCTV camera
for controlling the traffic so that the transit will be easy (sugam). And the transport department
2. update the system of controlling the traffic on timely. One major couse of road accident is drink.
Mostly happened with truck drivers and they commit the accidents. In track drivers mostly
drivers are uneducated and they can’t read the signs board which are fixed on roads they only
one think know that where he have to go. This type drivers mainly come on the road in night and
they drive over night. This study conducted on truck drivers to know how much they are
awareness about the road rule (traffic rule).
Road signs in the republic of india are similar to those used in some parts of the united kingdom,
except that they are bilingual. Most urban roads and state highways have signs in the state
language and English. National highways have signs in the state language hindi and English. In
2012 the tourism department of kerala announced plans to replace older signboards with new
fluorescent signs in the state to include maps of nearby hospitals the noida authority announced
plans to replace older signboards with new fluorescent signage. Traffic signs and road marking
are silent speakers to the road users. Every road user should know the marking and signs on the
road and the meaning there of.
Many different traffic signs are to be seen on the road. They give advance information about
road.
Many different traffic signs are to be seen on the roads. They give advance information about
road conditions ahead. Road markings also give orders, warning or guidance to drivers or riders.
Learn the meaning of these signs and markings and look out for them when on the road. You will
not then be surprised by a bend, a one-way street or a junction ahead. Good drivers and riders are
always prepared.
Road Traffic Signs -: Road signs are classified under the three heads:
1. Mandatory Signs 2- Cautionary Signs 3- Informatory Signs
Mandatory Signs
These signs are used to inform road users of certain laws and regulations to provide safety and
free flow of traffic. These include all signs which give notice of special obligation, prohibition or
3. restrictions with which the road user must comply. The violation of these signs is a legal offence.
Some of the signs, which fall under this category, are provided as follows.
Cautionary Signs:- These signs are used to warn the road users of the existence of certain
hazardous condition either on or adjacent to the roadway, so that the motorists are cautious and
take the desired action. Some of the signs, which fall under this category, are provided as
follows.
Informatory Signs: These signs are used to guide road users along routes, inform them about
destination and distance, identify points of geographical and historical interest and provide other
information that will make the road travel easier, safe and pleasant.
Road Safety Patrol programs exist in schools throughout the world. In addition to providing safe
passage for their fellow students, the students who participate in the Road Safety Patrol develop
important qualities and personal skills, including leadership and a sense of social responsibility.
The ROAD SAFETY PATROL (RSP) is involved in the educational aspect of Road Safety.
The RSP Scheme commenced way back in 1951, and was flagged off from the New Bharda
High School at Fort, Mumbai.The Road Safety Patrol unit in Coimbatore was restarted in the
year 2008 and has a strength of more than 1500 school children actively participating in
activities in and around their schools in the morning and in the evening during school open and
close hours.
4. PRIMARY FUNCTIONS :-
The primary functions of a Road Safety Patrol are described as below:
“To instruct, direct, and control students in crossing the roadways at or near schools; and to
assist teachers and parents in the instruction of school children in safe pedestrian practices at
all times and places.”
Patrollers guide children and prevent them from entering traffic when it is unsafe to do so.
Patrollers should not be charged with the responsibility of directing vehicular traffic, nor should
they be allowed to. Therefore, they do not need to be recognized by city bylaw dealing with the
control of vehicular traffic.
You can see the major accidents happening in the every state some of government record and
some other accidents happening in state we can’t know about it. Because it is happening in ruler
areas that why there were no source for any media. After observing the situation and knowing
about it. The researcher conducted the research on this problem.
OBJECTIVE OF THE STUDY
To find out awareness of traffic symbols.
To find out what media they mostly used.
To find out awareness of traffic sign.
5. Chapter-2
REVIEW OF LITERATURE
Traffic Signs and Road Safety
24.04.2015
By Rituparna Sengupta
Traffic signs are the silent speakers on the road. Be it the person behind the wheel or a
pedestrian, having a sound knowledge about road safety is absolutely necessary for all before
hitting the roads. Traffic signs give information about the road conditions ahead, provide
instructions to be followed at the major crossroads or junctions, warn or guide drivers, and
ensure proper functioning of road traffic. Being unaware of road signs is akin to throwing
caution to the wind. It can lead to loss of life and property. A person is supposed to be familiar
(get through a written or oral test) with the traffic signs and symbols before acquiring a driving
license in India.
Road safety signs are primarily of three types:
1. Mandatory Signs:
These signs are used to ensure free movement of traffic and make the road users
cognisant of certain laws and regulations, restrictions and prohibitions. Violation of these
signs is an offence, as per law.
2. Cautionary Signs:
These signs make the road users conscious of hazardous conditions on the road
beforehand. The drivers. Accordingly. Take necessary
Actions to handle the situation.
3. Informatory signs:
These signs guide the road users about destinations, distance, alternative routes, and
prominent locations food joints, public toilets, nearby hospitals, etc.
Road Safety Educations:
Education about road safety is often provided in school, colleges, workplaces, clubs and public
places. However, there could be other ways to create mass awareness:
1 Distribute booklets and pamphlets in schools.
2 Show presentations on road safety and negative aspects of road accidents in the class
rooms.
3 Share online content with peers.
4. Encourage parents to help children learn preventive measures in real time.
5. Educate teachers with the basic laws and regulations on the road.
6. Celebrating road safety:
Every year prominent metro cities of india celebrate the road safety week to promote road safety
measures. During the entire week the transport departments of various states create awareness
through community building process in schools, colleges, offices and on roads. They also
sensitise people about the outcome of drunken driving high- speed driving, importance of
wearing helmet for bikers and seat belts for four wheelers drives. At times they choose themes to
communicate to the massage. Road safety week 2015 was celebrated in india from 11-17
january.
Road to hell: National Statistics on Accidental Deaths in India
Driving in india can be more dangerous than you and I can ever imagine. According to the
statistical report published in 2013, an accident occurs in every minute in india. When all the
developed nations are focusing on reducing the rates of accidental deaths, Indian roads have
become worse than ever. According to a report published by the world health organization
(2013), india has the highest number of road accidental deaths(105725 people died on the road)
in the world. Among the Indian states, Maharashtra (where Mumbai has the highest numbes of
death cases I.e. 25471 road accidents) tops the list followed by the tamil nadu, Madhya Pradesh,
Karnataka and Andhra Pradesh. The report also clarifies that inefficient law enforcement,
drunken driving, low user adoption of helmets and seat belts and lack of child restraints in the
vehicles are the main causes behind such a high rate of road accidents in india.
Traffic Congestion In Delhi : Couses, Outcomes And Solutions
08.12.2014
By Rumani Saikai Phukan
Well one of the most common and irritating problems that one faces in the national capital of our
country is getting caught in traffic jams. The daily commuting on the roads of delhi is becoming
longer and more grueling day by day, depicting the failure of public transportation infrastructure
to keep pace with the growing developing activities in the capital. Sad but true one of the fastest
growing and developed cities of the world delhi is also renowned for all the wrong reasons.
According to a report made by IBM’s global commuter pain study in 2013 new delhi is among
the top 10 cities in the world having the worst traffic jams. Really the worsening traffic
congestion on delhi roads presents a depressing profile of the capital city.
Some of the major causes of traffic congestion in Delhi
1. Substantial increase in the number of vehicles on Delhi roads in recent years. In fact,
studies have shown more than a lakh vehicles are plying almost every day on most of the
important corridors in Delhi.
7. 2. The road length in Delhi has increased at the rate of 4.53% per year, which, of course, is
not in pace with the growing population. It is reported that the road density in Delhi is
around 155 km per 100,000 population and about 80 vehicles per km.
3. At the intersections, the cycle time ranges from 120 to 180 seconds, which leads to long
queues, especially in the peak hours.
4. Another major cause is that Delhi roads are characterised by mixed traffic, which include,
personal vehicles, buses, trucks, three-wheelers, two-wheelers, including animal-driven
carts and pedestrians. This creates problems for traffic management and leads to delays in
movement of the traffic.
5. Increase in the growth of the population in Delhi, which includes the growing number of
workforce, is another important cause.
6. There has been inadequate public transport system in Delhi. In spite of metro and bus
services, the transport system is not being able to keep pace with the growing population,
as a result of which, more and more people use their private vehicles, leading to increased
congestion on the roads.
7. Last, but not the least, ongoing construction of Metro network in various locations,
damaged roads, repairing roads all contribute to severe traffic congestion in the city.
Outcomes:
1. No doubt, traffic congestion is resulting into unnecessary delays and reduction in speed.
2. It has resulted into a non-productive activity for most people as when they get stuck in
traffic jams, they reach their workplace late or reach back home late.
3. It has resulted into high rate of road traffic fatalities, making travelling and driving very
unsafe in Delhi.
4. Traffic congestion has also led to an increase in the number of accidents on the roads. In
fact, Delhi has the highest accident rate in India and third-highest in the world.
5. Here the irony is that everyone is in a hurry but nobody reaches on time.
6. Traffic rules, red light, lane driving are not followed which are both the causes and effects
of traffic congestion in delhi.
7. Inability to forecast travel time accurately.
8. Fuel wastage.
9. Increasing air and noise pollution.
10. Wear and tear on vehicles.
11. Increased road rage.
12. Blocked traffic also interfares with the passage of emergency vehicles etc.
Role of Government in controlling traffic in Delhi
To improve the quality of public transport, some measures taken by the Government are:
8. 1. Completion of second phase of Delhi Metro has provided a convenient public transport
system to the commuters of Delhi and the adjoining NCR cities of Gurgaon, Noida and
Ghaziabad.
2. More than 3,500 low floor air-conditioned and non-airconditioned buses, including
corporate sector buses, have been introduced by the Delhi Transport Corporation (DTC)
3. Withdrawal of blue- line buses.
4. Construction of new roads, foot bridges, flyovers and widening of existing road network.
5. A delhi transport infrastructure development corporation has been set up to manage inter-
state bus terminals in delhi.
6. Ring road bypass and elevated corridors in some areas of delhi like barrapula drain, badali
to madhuban chowk etc.
Intelligent transport system (ITS) and delhi integrated multi- modal transit system ltd.
(DIMTS)
The main objective of DIMTS is to provide safe, accessible, reliable, sustainable and user-
friendly public transport for commuters and set up a mechanism to deliver public transport
service that keeps pace with growth. The problem of traffic on the roads of Delhi can be
solved with the implementation of Intelligent Transport System (ITS) in a proper manner, as
adopted by DIMTS. ITS in Delhi, for that matter, the whole of India, can bring about a
sustainable and balanced transportation solution. It is basically the use of computer and
communications technologies in the resolution of transport problems. It can help in timely
gathering of data or intelligence and then providing feedback to traffic managers and road-
users. Implementation of ITS can lead to reduced traffic congestion, better traffic efficiency,
better safety to drivers, improved energy efficiency and increased economic productivity.
Some examples of ITS include:
1. Advanced traffic management systems.
2. Advanced vehicle control systems.
3. Advanced traveler information systems.
4. Electronic toll collection systems.
5. Advanced public transportation systems.
6. Wireless traffic signal controller.
7. Red light- stop line violation and detection system.
8. CCTV junction surveillance.
9. Variable massage sign.
10. Video incident detection etc.
This has already been adopted in other countries for effective management of traffic. In delhi. It
has started only recently. Proper implementation of ITS will definitely improve the scerario.
9. What other measures can be taken?
some immediatnde steps that need to be taken by the government to allow traffic to move
somewhat safely in delhi are as follow:
1. Designing a well maintained and well- developed public transport system.
2. Designing sepatate road or lanes to control speeds and vehicles of different sizes, weights
and velocities.
3. Promoting traffic safety and traffic rules through education adverting and strict
efforcement.
4. Improvements in vehicle design.
5. Strict enforcement of travel demand management and policies to be adopted to reduce the
use of private vehicles.
6. Ensuring safety and convenience to commuters of public transport and pedestrians.
7. Introduction of cost effective environment- friendly and efficient new modes of public
transport for congested lanes streets and feeder system for major public transport.
The effectiveness of such measures depends to a great extent on us the public the road users
the police and of course proper enforcement of the laws.
Worst road accidents in india by truck a year wise.
The condition of road in india is far from ideal. Leave alone the rural hinterlands and the
semi-urban locations that are mushrooming across india with ludicrous regularity, even the
road of big cities are far from what can be called safe. In fact, in some of the newly-
developed and developed areas of these metro cities one can see craters that are of the size of
ones found on the moon. This is the reason why so often there are so many mishaps on these
roads. One also needs to take into cognizance the tendencies of rash driving by people behind
the wheel as well as the generally-irreverent and irresponsible attitude of pedestrians while
crossing the roads. The most often, they do not acknowledge traffic rules and deem it fit to
cross the roads as and when they wish to, thus putting themselves and others at risk.
Is india really the worst in terms of accidents?
In 2014 the-then union minister gopinath munde passed away in a road accident and this
brought forth some rather uncomfortable question regarding the situation of Indian roads. If
the ministers, who enjoy the highest level of benefits, are not safe then one can jolly well
understand the situation of the common people. However, it would be entirely wrong to
assume that india is the worst off when it comes to road accidents. The numbers are
frightening indeed. In 2012, road accidents of various denominations claimed 1,38,258.00
lives in india and the population of Maldives is just a little more than that. In the last few
years, china has been able to increase its levels of road safety, while india has overtaken its
northeastern neighbor in terms of road accidents, as per the national crime records bureau, in
10. 2012, on a daily basis 461 people lost their lives and 1301 were injured in road accidents. If
we calculate, each hour 19 people died in an accident, and each three minutes, one person
died in an accident in India.
There is a lot that india can do in order to ensure that its roads are safer. India is second in
world in terms of population and it is given that it would have its fair share of road accidents.
Even as india becomes more urban, more roads will be built and the number of truck and
other vehicles on the streets will increase as well. This will also mean that there the numbers
of accidents and related deaths shall increase as well, even as unfortunate as that may sound.
A good way in which one can judge road safety in a country is by looking at the amount of
death per 1000 people. The world health organization states that the global average in this
regards is 18 and india’s average is only marginally higher at 18.9. countries.
Accidents in 2014
2014 has seen a couple of major road accidents.
1. The first such incident happened on 4 february 2014 when a bus travelling between pune
and satara, maharastra,fell in the ditch. The accident claimed at least 10 lives and 33
people were injured.
2. In the other couple of accidents, which happened on 29 july 2014, a minimum of 33
people passed away.
Accidents in 2013
There were four major road accidents in this year.
1. The first one occurred on 10 january 2013 in bihar. A truck carrying several people lost
its balance and a minimum of 25 people died. This included 11 children as well.
2. The second one happened in Punjab on 4 march 2013. A school bus hit a
3. truck and 12 people – a driver and 11 children – lost their lives. 10 children were injured
in the same.
4. The third incident happened on 3 October 2013 in assam. A cargo truck rammed straight
into a couple of minivans, which were full of labourers. The incident, which happened
160 km towards the west of guwahati claimed 28 lives including that of 13 kids. 20
people were injured in the accident.
5. The last major accident of this year happened exactly a week later in himachal Pradesh. A
truck accident killed 20 peoples and wounded 30.
6. There was a solitary major road accident in 2012. It happened on 11 August when 51
people died after a bus dove into a gorge.
11. Stop Says The Red Light.
22-10-2014
By viji athrege
As I begin writing this article on the traffic situation in india, I hum a rhyme I learnt as a
child. Stop says the red light, go says the green, changing says the amber one, blinking in
between. In india it is time to show the red light to traffic till the conditions change and the
signal can be turned green again. And we, the people of india, have to contribute as
responsible citizens towards a better network of traffic.
Pedestrian traffic
Pedestrians in india feel they have the right of way on matter how fast a vehicle is coming
towards him. By just an inconspicuous move of hand, they expect the vehicle to stop so that
they can cross the road. Abroad, the pedestrians do have a right of way, wherein they are
expected to press a button, know as the bag buttons, on the sidewalk, which changes the
signal light from green to red. This is more organized, unlike in India, where anyone just
comes in the way of moving traffic.
There are no proper sidewalks to walk on and people can be found walking on the road along
with the moving traffic. Even if there are sidewalks, they are infested with hawkers and
shoppers, again forcing a pedestrian on the road. Zebra crossings, if present at all, are fading
in most of the places and people cross the road from where ever they find it convenient. A
part from causing congestion of traffic, the pedestrian also put their lives in danger.
Right of Way
In india right of way does not include fast moving vehicles. The rule is that the bigger the
vehicle the more right of way it has. So it can be found that trucks and other big vehicles
even at a slower speed are moving on the right side of the road blocking the way of other
faster moving vehicles. Thus the traffic gets congested. Even vehicles like autos and scooters
do not move on the left side staying in the centre of the road and as such blocking the smooth
movement of traffic.
No proper testing mechanism of drivers
In india on proper driving test are conducted a person just has to contact and agent who in
exchange of a measly sum of Rs. 1500/- will get a license of india are novices who have
learnt driving by the trial and hit( or should I say hit and run) method. They do not know
anything about the traffic rules and blatantly flout each and every regulation of traffic. Those
who cannot afford to pay even the sum of Rs. 1500/- for a license feel free to drive without a
license there many honest traffic constables in india but the truth is that there are also an
12. equal number of dishonest ones. And drivers without license, if caught, just bribe their way
out of trouble in most of the cases.
Age No Bar
In india for obtaining a licence to drive motorcycles with an engine capacity of 88 cc or less
the minimum age is 16. One must be 18 years or older to drive any other type of vehicle.
However one can see under 16 year olds driving motorcycles on the busy streets and under
18 years olds driving cars this is where the india parent comes into scenel we as parents
should see to it that our children are not breaking rules and regulations. While driving on a
traffic congested road when we are cursing all the other drivers of the wrongs that they are
doing we should be clear in our conscious that we have not done anything wrong.
Huge rise in vehicles in india
In the last decade the increase in the number of vehicles on the road is astounding again we
the people of india are to be blamed we do not believe in commuting by public transport thus
one can see a single individual in a car which sears a minimum of 4 people driving to the
place of work we do not realis that the more the number of vehicles the more the traffic jam
other related problems also arise because of this viz parking woes unnecessary consumption
of fuel and increase In both air and noise pollution in Bangalore it takes 45 mins to cover a
distance of 5-6 kms at the peak office hours here the people do not talk in terms of kms when
they talk about distance they talk in terms of time taken.
Ways out
we as Indians have to contribute towards a better traffic scenario in india there are many
ways and the following are just a few.
1. The government should ensure proper sidewalks and no encroachment by hawkers.
2. CCTV cameras should be installed at all important junctures and any vehicle breaking the
rule of traffic like the right of way should be immediately impounded.
3. A proper written and driving test should be conducted before the driving license is issued.
We as the citizens should see to it that we have gone through the rigmarole before we
obtain a license.
4. Seat belts and helmets should be made absolutely compulsory.
5. Honking of horns should be restricted within specific time periods to reduce the sound
pollution.
6. Like in London a congestion charge should be introduced where vehicles plying at peak
hours have to pay a toll this reduces traffic and raises money to improve traffic.
7. Wherever possible we should use public transport and also adopt the policy of car pools
8. Last but not least we the citizens of india should be conscientious about the rules and not
try to bribe our way out of trouble.
13. It is time to make a change for a better tomorrow.
TABLE OF ACCIDNETS HAPPENED YEARLY IN STATE
SL STATES 2004 2005 2006 2007 2008 2009 2010 2011
1 DELHI 8072 8447 8280 7711 7343 6936 7108 7226
TOTAL IN
INDIA
4,64,521 4,65,282 4,96,481 5,13,340 5,23,193 5,15,458 5,27,512 5,11,394
THE DATA IS DRAWN FROM
TOTAL KILLED IN ROAD ACCIDENTS FROM 2004 TO 2011 IN DELHI
SL STATES 2004 2005 2006 2007 2008 2009 2010 2011
DELHI 1907 1862 2169 2141 2093 2325 2153 2065
TOTAL KILLED IN ROAD ACCIDENTS IN 2013 IN DELHI
SL STATES YEAR CAUSE MALE FEMALE TOTAL
1 DELHI 2013 Truck/Lorry (Government) 4 0 4
DELHI 2013 Truck/Lorry (Private) 178 23 201
DELHI 2013 Total Truck/Lorry 182 23 205
2 TOTAL (ALL
INDIA)
2013 Truck/Lorry (Government 317 63 380
TOTAL (ALL
INDIA)
2013 Truck/Lorry (Private) 20921 2780 23701
TOTAL (ALL
INDIA)
2013 Total Truck/Lorry 21238 2843 24081
14. CHAPTER-3
APPROACH AND METHODOLOGY
RESEARCH APPROACH
In this research the researcher cannot say that how people is realizing and implement information
about the track drivers how much they are awareness the traffic sign and symbols that’s why the
researcher want to study the problem with Quantitative Research Approach. Quantitative
research is generally associated with the positivist/postpositivist paradigm. It usually involves
collecting and converting data into numerical form so that statistical calculations can be made
and conclusions drawn. And in this approach we use statistical analysis. In this approach mainly
we study no. It is easy to calculate the mean median mode and standard deviation etc.
RESEARCH METHODOLOGY
This research is a micro level study on some truck drives special who is present in delhi in
sanjay Gandhi transport nagar thats why the researcher decided that they have to study truck
drivers and their consumption of media and how much they are aware about the traffic sign
board and symbols. In every research it is most important that what is the methodology you are
going to use in this research the researcher will use descriptive research methodology because
the researcher wants to describe the current scenario of the truck drivers and how much
they are aware about the traffic sign board and symbols.
15. CHAPTER-4
RESEARCH DESIGN
AREA OF RESEARCH
After long consideration it is decided that he will research in ruler area in any city where truck
drivers mostly lived and which is more convenience for the researcher. Delhi is most engaged
city. Traffic is big issue in delhi and mostly people facing traffic problem in the city on daily
basis. That’s why the research study place will be Delhi. Because in delhi there are so many
people they are belong from different place and different culture and in delhi may people they
are blaming on track drivers. In Delhi the researcher decided that he will study only North Delhi
in sanjay Gandhi transport nagar.
POPULATION
After decided place researcher have to decide his study population because his study is a micro
level study so it necessary to his population will be clear the researcher will study only truck
drivers who is presented in North Delhi sanjay Gandhi transport nagar delhi . Because track
drivers are some is educated and another hand some truck drivers are uneducated they don’t
know properly about the traffic sing board and symbols and other there are some new training
drivers who drive the truck with ought license and also don’t know about the traffic sing they
just know only red light and some other popular sing and symbols.
SAMPLE
Sample is the representation of population it is selected from population. In sampling method
when we are selecting sample there is equal chance to selected every individuals. There is two
type of sampling method one is probability sampling method and other is non probability
sampling method. In this research the researcher will be used non probability method. In non
probability method there is some limitation for selecting the sample in non probability method
there is no equal chance for the respondent to participate in the research who researcher want
only he will be participate in the research there are many type of non probability sampling
method and the researcher dicieded that he will be use purposive sampling method. In purposive
sampling method the researcher will focus them whom, who is have information about the topic
and he request him he will be give the answer and no may not give the answer.
16. PURPOSIVE SAMPLING METHOD
In this research the researcher has decided that he is going to study in delhi. In delhi his
particular area is north delhi sanjay Gandhi transport nagar delhi. But sanaj Gandhi transport
nagar delhi population is almost 30,000,.00 transport office it is not possible for us to study them
like census. And it is his study project and he have no sufficient balance for conducting this
research on census basis. That why he decided that he is going to use sampling method in this
research. In this research he is going to use purposive sampling method. In method we will
select them who is truck drivers. We are continuous selecting the sample while we will reach our
sample size.
SAMPLE SIZE
In this research researcher is not going to take sample size according to his timing schedule and
convenience. he will collect the minimum sample size. the sample size will be 30.00 he is going
to study 30 people.
Sample Size -: 30 Sample
17. CHAPTER-5
DATA COLLECTION TOOL & TECHNIQUES
DATA COLLECTION METHOD
In every study it should be clear that how we are going to collect the data. We should keep in
mind our data collection is appropriate according to our project and according to approach,
methodology etc. because it is the stage where a little mistake may make our entire project fail.
In this research the researcher is going to use survey. In survey method he will go for field
survey .In field survey we will go in field and collect data from the respondent. In field survey
the researcher will use questionnaire schedule in questionnaire schedule researcher go in field
and with questionnaire schedule and asked to respondent question and fill the schedule himself.
IMPORTANT OF FIELD SURVEY
1) In this method we have to need of man power for colleting the data.
2) In this method response started immediately.
3) In the method the respondent have pressure about filling the questionnaire schedule
immediately.
4) It is much reliable method.
5) It is expensive method.
6) It is not easy to collect data.
7) In this method there is boundary because you can only your focus field of study.
WEAKNESS OF MAIL SURVEY
In this data collection tool the researcher have to face many problem when he is in the field
for collecting data he is dealing peoples. And face many problem time problem, behavior,
and other extraneous problem etc.
DATA COLLECTION TECHNIQUES.
It is most important thing when you are going to collect data you should decide a appropriate
data collection techniques. There are different type of techniques for data collection in this
techniques what is the best techniques for your research. You should decide it according to
your research and your approach, methodology and data collection method.
In this research the researcher will conduct field survey so it is necessary to use to
questionnaire schedule because in this research the respondent may be educated and
uneducated so that researcher will used questionnaire schedule for data collection techniques.
In this research he is using questionnaire schedule for data collection. With this
18. questionnaire schedule researcher will be go to respondent for filling and summiting the
form. Because in questionnaire schedule we need educated and uneducated people for
filling the questionnaire schedule the researched asked question to respondent and he fill
the schedule himself. According to researcher that questionnaire schedule is the best way to
collect the data from the field for this research.
QUESTIONNAIRE SCHEDULE
Questionnaire schedule is the tool of data collection. There is two type of questionnaire one
is open end and second is close ended in this research researcher will use close ended
question for questionnaire schedule.
19. CHAPTER-6
DATA ANALYSIS & INTERPRETATION
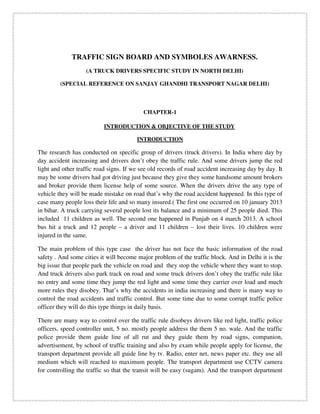
AGE
Frequency Percent Valid Percent Cumulative
Percent
Valid
18 TO 30 YEAR 15 50.0 50.0 50.0
31 TO 42 YEAR 6 20.0 20.0 70.0
43 TO 54 YEAR 7 23.3 23.3 93.3
ABOVE 54 2 6.7 6.7 100.0
Total 30 100.0 100.0
in the chart and also frequency table it shown that
50% respondent who is participate in the
Conducted research they are 18 to 30 year
Old drivers means out of 30 responcedent
15 responted and also 2nd
things is 20%
Respondent between 31 to 32 age grup
Mean out of 30 respondent 6 respondent
Age grup is 31 to 42.and also there are 23.3% respondent
Age group is 43 to 54 means out of 30 respondent 7 respondent age is between 43-54 and last
6.7% respondent who participate in the research. Means out of 30 respondent there are 2
respondent who is above 54
20. EXPERIANCE STATUS
Frequency Percent Valid Percent Cumulative
Percent
Valid
UPTO 1 YEAR 3 10.0 10.0 10.0
1 TO 3 YEAR 4 13.3 13.3 23.3
3 TO 6 YEAR 4 13.3 13.3 36.7
6 TO 9 YEAR 1 3.3 3.3 40.0
9 TO ABOVE 18 60.0 60.0 100.0
Total 30 100.0 100.0
In the pie chart and frequency table the is shown that
In research track drivers have how much
Experience and after that they how much
Aware about the traffic sign bord and
Sign. In the research upto 1 year
Experience 10% means out of 30
Respondendent thare is 3 respondent
Who have upto one year experience and 1 to 3
Years experience there are 13.33% respondent means out of 30 respondent there are 4
respondent and 3.33% respondent who participate in the research 6to 9 years experience there
are 1 respondent who participated in the research and last 9 to above there are 60% respondent
who participated in the research means out of 30 respondent there are 18 respondent who have 9
to above track driving experience mean in this research all level of drivers involve so our
research is most authentic.
21. EDCUCATION STATUS
Frequency Percent Valid Percent Cumulative
Percent
Valid
UPTO 5 CLASS 4 13.3 13.3 13.3
6 TO MATRIC CLASS 14 46.7 46.7 60.0
11 TO 12 INTERMEDIATE 8 26.7 26.7 86.7
ABOVE INTERMEDIATE 4 13.3 13.3 100.0
Total 30 100.0 100.0
It is the educational background detail about the
Respondent who participate in the research
It shown that how much drivers are educated
In the research there are 13.33% respondents
Educational back ground is upto 5 class means
Out of 30 respondent 4 drivers are are passed upto
5 class and 46.67% respondent are 6 to matric pass means
Out of 30 drivers there are 14 drives who have passed 6 to 10 class. And 26.67% track drivers
are educational detail is 11 to 12 class means there are 8 drivers who have done up to
intermediate college. Last 13.33% drivers educational background is above intermediate college
means out of 30 drives there are 4 drivers who is above intermediate college. Over all in truck
drivers now educated drives involving and it is good for transport department because they are
educated and they will read the sign board and symbols as compare to uneducated drives.
22. SALARY STATUS
Frequency Percent Valid Percent Cumulative
Percent
Valid
UPTO 5000 10 33.3 33.3 33.3
5001 TO 10000 12 40.0 40.0 73.3
10001 TO 15000 6 20.0 20.0 93.3
15001 TO ABOVE 2 6.7 6.7 100.0
Total 30 100.0 100.0
in the research 33.33% track drivers who get salary upto 5000 means
out of 30 drivers there are 10 drives who get the upto 5000
salary and there are 40.00% drivers who gets 5001 to
10000 thousand salary means out of 30 drivers there
Are 12 drives who get the salary 5001 to 10000 also
There 20% drivers who get 10001 to 15000 salary.
Means out of 30 drivers only 6 drives get the 10001 to
15000 salary. Last 6.67% drives who get above 15000 salary
Means there are only 2 drives who get 15000 above salary. In according to data it shown that
there are mostly drivers are getting salary 5000 to 1000 .
23. Best Media For Drives
Frequency Percent Valid Percent Cumulative
Percent
Valid
NEWS PAPER 9 30.0 30.0 30.0
RADIO 15 50.0 50.0 80.0
TELEVISION 6 20.0 20.0 100.0
Total 30 100.0 100.0
in the research 30% drives say that news paper is the best
media which is used by them means out of 30 drivers there
are 9 drivers who say this statement. And there are
50% drives who say that radio is the best media
Which is used by them means out of 30 drives there
Are 15 drivers who say that the radio is the best
Media according there time schedule also there are 20%
Drivers who say that the TV is the best media for them means
Out of 30 drives there are only 6 drivers who say this statement. As all mostly driver used radio
because they have time limitation they always drive track and they no time so they used to radio
24. Zebra Line Sign
Frequency Percent Valid Percent Cumulative
Percent
Valid
USE PADRATION FOR
CROSSING THE ROAD
4 13.3 13.3 13.3
NEXT TO ZEBRA LINE 17 56.7 56.7 70.0
NEXT MAY BE
PADARATION
4 13.3 13.3 83.3
PADARATION
PROHIBITED
1 3.3 3.3 86.7
DON'T KNOW 4 13.3 13.3 100.0
Total 30 100.0 100.0
Zebra Line
In the research 13.33% people say that the
It sign show use padaration for road crossing
Means out of 30 drivers 4 drivers don’t know
Actual meaning of zebra line they just know
It is use for the road crossing. 56.67% drives
Say that is the zebra line means out of 30 drivers
There are 17 drivers who say it is the zebra line. Also
13.33% drivers say that it may be next to padaration means out of 30 drivers 4drivers say it. Also
3.33% drivers say that it is padaration prohibited sing. Mean out of 30 drivers 1 drivers say it.
Last 13.33% drivers say that they don’t know about the sign. Means there are 56.67% are aware
about the zebraline and 43.33% drivers are don’t aware about the zebra line they need some
awareness treatment about traffic sing
25. Speed Braker Sign
Frequency Percent Valid Percent Cumulative
Percent
Valid
NEXT TO BREAKER 26 86.7 86.7 86.7
NEXT TO ASSENT ROAD 1 3.3 3.3 90.0
NEXT TO DECENT ROAD 1 3.3 3.3 93.3
NEXT TO ROUGH ROAD 1 3.3 3.3 96.7
DON'T KNOW 1 3.3 3.3 100.0
Total 30 100.0 100.0
Speed Braker
In the research 86.67% drivers say next to
Speed braker means there are 26 drivers out
Of 30 who say it is speed braker and less
3.33% drivers say it is assent road and 3.33%
Drivers say it is decent road and 3.33% drivers
Say it is rough road and last 3.33% drivers say that they
Don’t know. Over all it is good result for us that 86.67% drives know about the speed braker.
26. STOP SIGN
Frequency Percent Valid Percent Cumulative
Percent
Valid
STOP 10 33.3 33.3 33.3
NO ENTRY 5 16.7 16.7 50.0
CROSSING ROAD
PROHIBITED
1 3.3 3.3 53.3
PARKING PROHIBITED 4 13.3 13.3 66.7
DON'T KNOW 10 33.3 33.3 100.0
Total 30 100.0 100.0
In the research 33.33% drivers say that the shown
Sign is for stop means out of 30 drivers 10 drives
Say this is the stop sign. And 16.67% drives say
It is no entry sign. Means out of 30 drivers
5 drivers say it and 3.33% drives say it is
Road crossing prohibited sign. Means out of
30 drives 1 drives say it also 13.33% drives say
This sign shown it means parking prohibited means
Out of 30 drivers 4 drivers say it. And last 33.33% drives say don’t know about the sign. Means
out of 30 drivers 10 drivers don’t know about the stop sign.
In the shown result it means there are need of traffic sign and symbols awareness with in drivers.
27. TRUCK PROHIBITED
Frequency Percent Valid Percent Cumulative
Percent
Valid
HEAVY VEHICLE
PROHIBITED
12 40.0 40.0 40.0
TRACK PROHIBITED 6 20.0 20.0 60.0
ALL VEHICLE PROHIBITED 3 10.0 10.0 70.0
DON'T KNOW 9 30.0 30.0 100.0
Total 30 100.0 100.0
in the shown pie chart 40% drivers say the shown
sign is heavy vehicle prohibited means out of 30 drivers
12 drives say it is heavy vehicle prohibited sign.
And 20% drivers say it means truck prohibited sign
Means out of 30 drives 6 drives say it is truck
Prohibited sign 10% drivers say it means all vehicle
Prohibited sign means out of 30 drives 3 drives say it.
At last 30% drivers say that they don’t know about the sign
Means out of 30 drivers 9 drivers say they don’t know about the truck prohibited sign.
It mean drivers are confused about the traffic sing board and symbol they need training for it.
28. GIVE WAY SIGN
Frequency Percent Valid Percent Cumulative
Percent
Valid
NEXT TO ROAD NARROW 14 46.7 46.7 46.7
NEXT TO TRAFFIC POLICE
STATION
2 6.7 6.7 53.3
GIVE THE PASS 4 13.3 13.3 66.7
DON'T KNOW 10 33.3 33.3 100.0
Total 30 100.0 100.0
GIVE WAY SIGN
In this chart 46.67% drivers say the shown sign
Is say next to road narrow means out of 30 drivers
14 drivers say it. And 6.67% drivers say it mean
Next to traffic police station mean out of 30
Drivers 2 drivers say it. And 13.33% drivers say
It means give way (give the pass) means out of 30
Drivers 4 drivers say it. 33.33% drivers say they don’t know about the sign.
It mean out 30 drivers 10 drivers are not aware about the give way sign they say don’t know .
In the according to research drivers need good training about the traffic sign board and symbols.
29. NO ENTRY SIGN
Frequency Percent Valid Percent Cumulative
Percent
Valid
ONEWAY ROAD 5 16.7 16.7 16.7
NO ENTRY 13 43.3 43.3 60.0
OVER TAKING
PROHIBITED
3 10.0 10.0 70.0
ROAD END 4 13.3 13.3 83.3
DON'T KNOW 5 16.7 16.7 100.0
Total 30 100.0 100.0
According to chart 16.67% drivers say the shown sign
Is one way road means out of 30 drivers 5 drivers say
That it. And 43.33% drivers say it no entry sign it
Means out of 30 drivers 13 drives say it is no entry
Sign. And 10% drives say it is over taking prohibited
Sign it means out of 30 drives 3 drivers say it also 13.33%
Drivers say it means road end it means out of 30 drives 4 drives
Say it. 16.67% drives say that they don’t know about the sign. Mean out of 30 drivers 5 drivers
say it.
According to research drivers are unaware about the traffic sign board and symbol they need
good training about it.
30. NO STOPING AND STANDING
Frequency Percent Valid Percent Cumulative
Percent
Valid
ROAD END 16 53.3 53.3 53.3
NO PARKING 5 16.7 16.7 70.0
STOPING AND HALTING
PROHIBITED
2 6.7 6.7 76.7
SPEED LIMIT END 1 3.3 3.3 80.0
DON'T KNOW 6 20.0 20.0 100.0
Total 30 100.0 100.0
NO STOPING AND STANDING
According to chart 53.33% drivers say it mean
Road end means out of 30 drivers 16 drivers
Say it. And 16.67% drivers say it means no
Parking it means out of 30 drivers 5 drivers
Say it. And 6.67% drivers say it is stopping and
Standing prohibited means out of 30 drivers 2
Drivers say it. And 3.33% drivers say it means speed limit end
Means out of 30 drivers 1 drivers say it. 20% drivers say they don’t know about the no stopping
and standing sign.
Means driver need training about the traffic rule and sign.
31. U- TRUN PROHIBITED SIGN
Frequency Percent Valid Percent Cumulative
Percent
Valid
NEXT TO U TURN CLOSED 10 33.3 33.3 33.3
U TURN PROHIBITED 8 26.7 26.7 60.0
NEXT TO U TURN
COMPUSSORY
8 26.7 26.7 86.7
STOPING AND HALTING
PROHIBITED
1 3.3 3.3 90.0
DON'T KNOW 3 10.0 10.0 100.0
Total 30 100.0 100.0
In the shown chart 33.33% drivers say it means
Next to u turn closed means out of 30 drivers 10
Drivers say it 26.67% drivers say it means
U turn prohibited means out of 30 drivers
8 drivers say it 26.67% drives say it means
Next to u turn compulsory means out of 30
Drivers 8 drivers say it. 3.33% drivers say it means
Stopping and standing it prohibited. It means out of 30
Drives 1 drivers say it. Last 10% drivers say they don’t know about the sign that means out of 30
drives there are 3 drives who don’t know u turn sign.
According to research it need training of traffic rule and sign board also symbol.
32. ONE WAY SIGN
Frequency Percent Valid Percent Cumulative
Percent
Valid
NEXT TO ROAD CLOSED 6 20.0 20.0 20.0
STATE GOING PROHIBITED 3 10.0 10.0 30.0
NEXT TO BOTH ROAD
CLOSED
5 16.7 16.7 46.7
ONEWAY ROAD 10 33.3 33.3 80.0
DON'T KNOW 6 20.0 20.0 100.0
Total 30 100.0 100.0
in the chart it shown that 20% drives say the shown sign
is for next to road closed it means out of 30 drives
6 drives say it. And 10% drivers say it means
State going is prohibited means out of 30
Drives 3 drives say it. And 16.67% drives say
It mean next to both road closed it means out of
30 drives 5 drives say it. 33.33% drives say it means
One way road means out of 30 drives 10 drives say it. And last
20% drives say they don’t know about the one way sign. Means out of 30 drives 6 drives don’t
know about it.
33. OVERTAKING PROHIBITED SIGN
Frequency Percent Valid Percent Cumulative
Percent
Valid
NEXT TO U TURN CLOSED 6 20.0 20.0 20.0
NEXT TO GOLCHAKKAR SE
TURNING PROHIBITED
10 33.3 33.3 53.3
OVER TAKING
PROHIBITED
6 20.0 20.0 73.3
OVER TAKING
COMPULSSORY
2 6.7 6.7 80.0
DON'T KNOW 6 20.0 20.0 100.0
Total 30 100.0 100.0
according to chart 20% drives say the shown sign is for
next to u turn closed means out 30 drives 6 drives say it.
And 33.33% drives say it means next to golchhaker se
U tun prohibited mans out of 30 drives 10 drives say
It. 20% drives say it means over taking prohibited
Means out of 30 drives 6 drives say it and 6.67% driver
Say it means over taking compulsory it means 2 drives say it
Out of 30 drives. It mean they need training
34. BOTH SIDE ENTRY PROHIBITED
Frequency Percent Valid Percent Cumulative
Percent
Valid
NEXT TO ROAD CLOSED 9 30.0 30.0 30.0
GOING STRATE IS
PROHIBITED
3 10.0 10.0 40.0
ONE WAY ROAD 1 3.3 3.3 43.3
GOING TO BOTH
DIRECTION PROHIBITED
13 43.3 43.3 86.7
DON'T KNOW 4 13.3 13.3 100.0
Total 30 100.0 100.0
According to chart 30% drives say the shown sign means
Next to road closed means out of 30 drives 9 drivers say
It. And 10% drives say it means going state prohibited
Means 3 drivers say it out of 30 drivers. And 3.33%
Drivers say it means one way road means out of 30
Drivers 1 driver say it. 43.33% drives say both
Direction prohibited road means out of 30 drives 13
Drivers say it. 13.33% say they don’t know about the sign
According to chart analysis it seem it need more training for road safty sign and symbol.
35. CONCLUSION
After analysis and interpretation the researcher find that mostly drivers need to good training for
traffic rule and sign and also symbols according to the research researcher find major problems
of the truck drivers according to the their answer. Through this research the researcher find that
their media consumption detail that means mostly what medium they used for entertainment the
finding is that drivers want to use TV but they have no time that why mostly drivers used radio
for the entertainment 50% drivers used radio during the duty or driving vehicles.
In this research other variable are studying the founding is mention below.
in this research researcher put some other major variables for studing the situation means he
used to evolves all level of drivers they participated 18 years to 57 years old people. And study
their experience and also their educational detail in this variable there is good news for us that in
driving line there are many drivers are who completed graduation and then they are driving truck
and if they got good training for it they well know about the traffic rule and sign and symbols.
And researcher want to study that how much drivers know about the zebra line the result shown
that 56.67% drivers are aware about the zebra line other 33.33% drivers need training and they
don’t know about the zebra line. and other hand researcher put braker sign the respondent say
86.67% drivers give the right answer and less they don’t know about the brakers.the other
variables is stop sign 33.33% drivers know about the sign and 67.67% drives they don’t know
about the stop sign. And he asked about the truck prohibited sign only 20% drives give right
answer and remain 80% drivers they don’t know meaning of the sign. Researcher put the sign
give pass 13.33% drivers give right answer and remain 87.67% respondent they don’t know
about the sign. Researcher asked about the no entry 43.33% drivers give the right answer about
the sign. And he asked about the stopping and standing prohibited 6.67% drivers give right
answer about the sign he asked about the u turn 26.67% drivers give right answer about
it.74.33% drivers give wrong answer the last variable is rough road only 20% drivers give right
and and 80% drivers give wrong answer. According to the finding of the research it is necessary
that all drivers need training through and medium and road show and conducted workshop about
it. That will control the accident in india
Limitation of The Study.
1. In this study the major limitation is time and also this type research need some handsome
of money and man power when data collection period I face many problems like I mated
drunker and other miss behavior personality.
2. Small sample size study in this research with special reference of sanjay Gandhi transport
nagar.
3. In this research there are no variances about the state just because of this we can’t say any
this about any particular state. That which state drivers are well known about the traffic
rule and sign and symbols.