Download to read offline


![ Test environment: Go to: https://act.dataverse.nl/
[ Actual website: https://www.dataverse.nl ]
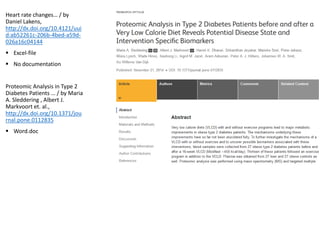
Click ‘Log in’ (at the top right)
Select SURFconext in the Please select your institution list and click Continue.
Select Eindhoven University of Technology and log on with your TU/e username
and password
When asked for it, give permission to share your data by answering Yes or click
this Tab
When asked to create an account, answer Yes or click this Tab.
When you succeeded to create an account, your username is: @[prefix of your
email address]
DataverseNL
log in | creating an account](https://image.slidesharecdn.com/proofrdm2015versieadvanced2015-11-12v2-151113115908-lva1-app6892/85/Research-data-management-16-320.jpg)
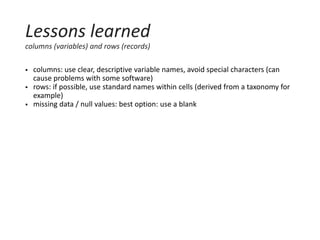
![Storage and backup of data through DANS [Dutch Archiving and Networking
Services]
Data transfer: up to 2 Gb per dataset
Via 3TU.Datacentrum: up to 50 Gb free
DataverseNL
storage and backup of data](https://image.slidesharecdn.com/proofrdm2015versieadvanced2015-11-12v2-151113115908-lva1-app6892/85/Research-data-management-17-320.jpg)
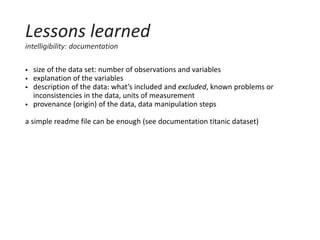
![ Organization of data in Dataverse [Dataverse] Dataset (Data)file
Before uploading, you have to describe your data (‘metadata’)
+ Discovery metadata
+ Formal metadata (for citation)
+ Substantial metadata (for discovery)
+ Metadata on data collection and methodology
+ …
Version control of datasets, not of (data) files!
DataverseNL
organization and description of your data](https://image.slidesharecdn.com/proofrdm2015versieadvanced2015-11-12v2-151113115908-lva1-app6892/85/Research-data-management-18-320.jpg)
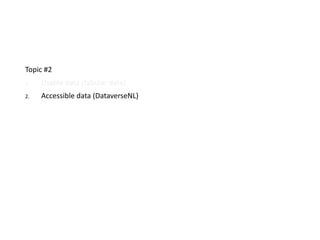
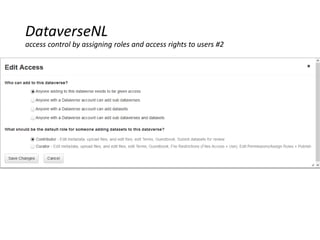
![Read-, edit- and access rights by assigning roles to registered users
A role defines the permissions you have
Access restricted site: reading rights only (downloading datafiles)
Contributor: the previous plus creating and editing own Studies
Contributor +: all the previous plus editing all Studies in a Dataverse
Curator: all the previous plus publishing (‘releasing’) Studies & assigning access rights to
Studies
Admin: all the previous plus assigning roles to users in a Dataverse & creating external user
accounts
Access rights to specified groups at Dataverse, Study and data file level
‘Unreleashed’ Study; only visible to persons who have access rights to that Study
‘Released’ Study: default Public ; after that access can be restricted (‘restricted access’)
Access rights = 1reading/downloading data files ; 2edit rights = editing metadata, adding or
deleting data files [defined by a role]
DataverseNL
access control by assigning roles and access rights to users #1](https://image.slidesharecdn.com/proofrdm2015versieadvanced2015-11-12v2-151113115908-lva1-app6892/85/Research-data-management-19-320.jpg)
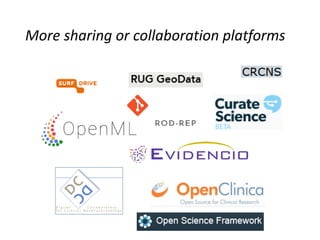
![DataverseNL
recognition for and collaborating on your data
Persistent identifier (DOI)
Assigning roles (with edit-rights) to users
[ Jointly / online analysis of data (Stata, SPSS, GraphML) ]](https://image.slidesharecdn.com/proofrdm2015versieadvanced2015-11-12v2-151113115908-lva1-app6892/85/Research-data-management-21-320.jpg)


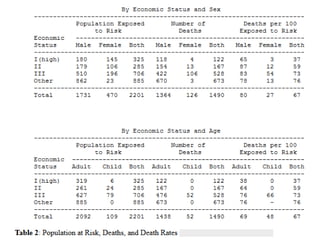
This document provides a comprehensive overview of research data management, focusing on the usability and accessibility of data. It discusses effective data organization, metadata requirements, the importance of documentation for data provenance, and outlines the functionalities of DataverseNL for data sharing and storage. Key lessons emphasize the significance of clear variable names, data formats, and user roles in a collaborative environment for effective data management.


![Research data management : [part of] PROOF course Finding and controlling sci...](https://cdn.slidesharecdn.com/ss_thumbnails/proofrdm19-11-2014-141119054859-conversion-gate02-thumbnail.jpg?width=640&height=640&fit=bounds)


![[DSC Europe 25] Danilo Djukanovic - From Vibes to KPIs: Turning Culture Into ...](https://cdn.slidesharecdn.com/ss_thumbnails/inqestws5wf0cik2glgv-3-danilo-djukanovic-from-vibes-to-kpis-presentation-260114111931-dacff81f-thumbnail.jpg?width=640&height=640&fit=bounds)

![[DSC Europe 25] Mijat Kustudic - Building Financial Intelligence with AI Agen...](https://cdn.slidesharecdn.com/ss_thumbnails/38y2lb5lse6wstegtvas-3-mijat-kustudic-building-financial-intelligence-with-ai-agents-260114111931-1a4783ce-thumbnail.jpg?width=640&height=640&fit=bounds)


![[DSC Europe 25] Slobodan Dolinic - Smart and Intelligent Green Region.pptx](https://cdn.slidesharecdn.com/ss_thumbnails/0bribinjsp6ghwtvsvor-2-sigre-slobodan-dolinic-260115093812-c9c10e90-thumbnail.jpg?width=640&height=640&fit=bounds)

![[DSC Europe 25] Srba Markovic - From Pilot to Production: Overcoming AI Deplo...](https://cdn.slidesharecdn.com/ss_thumbnails/yjjmrtytmwbalxlba7px-4-srba-markovic-from-pilot-to-production-overcoming-ai-deployment-blockers-with-260114111931-4a892d44-thumbnail.jpg?width=640&height=640&fit=bounds)
![[DSC Europe 25] Nikola Vasiljevic - Player segmentation by combat playstyles ...](https://cdn.slidesharecdn.com/ss_thumbnails/mnvbf0yvrwaqsipzrrv3-2-nikola-vasiljevic-player-segmentation-by-playstyles-in-action-shooter-games-260114111931-b4d766cd-thumbnail.jpg?width=640&height=640&fit=bounds)