
Recommended
Recommended
More Related Content
Similar to 2 8 5L e a r n I n g o b j e c t I v e sC H A P T E R.docx
Similar to 2 8 5L e a r n I n g o b j e c t I v e sC H A P T E R.docx (19)
More from lorainedeserre
More from lorainedeserre (20)
Recently uploaded
Recently uploaded (20)
2 8 5L e a r n I n g o b j e c t I v e sC H A P T E R.docx
- 1. 2 8 5 L e a r n I n g o b j e c t I v e s C H A P T E R 1 0 Q U A L I T Y M A N A G E M E N T I N T H E P H Y S I C I A N P R A C T I C E Quality and reliability are system properties. —W. Edwards Deming ➤ Articulate the nature of performance management. ➤ Describe the approaches to performance improvement. ➤ Appreciate the impact of variation on performance. ➤ Discuss the components of the Triple Aim. ➤ Describe process improvement. In t r o d u c t I o n One of the most important issues to address in the medical practice is the quality and safety of the care provided to patients. The Institute of Medicine (IOM 2001), a presti- gious branch of the National Institutes of Health, stated in its landmark report Crossing the Quality Chasm: A New Health System for the 21st Century, “In its current form, habits, and
- 2. environment, American health care is incapable of providing the public with the quality health care it expects and deserves.” C o p y r i g h t 2 0 1 7 . H e a l t h A d m i n i s t r
- 7. o r a p p l i c a b l e c o p y r i g h t l a w . EBSCO Publishing : eBook Academic Collection (EBSCOhost) - printed on 4/16/2020 7:48 PM via SUNY CANTON AN: 1839064 ; Wagner, Stephen L..; Fundamentals of Medical Practice Management Account: s8846236.main.ehost
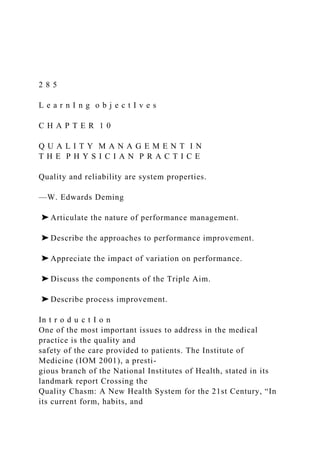
- 8. F u n d a m e n t a l s o f M e d i c a l P r a c t i c e M a n a g e m e n t2 8 6 Another historic IOM (2000) report, To Err Is Human: Building a Safer Health System, indicated that a shocking number of people—an estimated 44,000 to 98,000 per year—are harmed by the healthcare system. A more recent study found that this number has increased since publication of the 2000 IOM report despite substantial efforts to improve. Medical errors have now become the third leading cause of death in the United States (Makary and Daniel 2016). The complexity of medical service and the inconsistency with which these services are delivered, not to mention the fragmented nature of the system, have led to a number of quality concerns (Mosadeghrad 2014), including a lack of systematic approaches to care delivery and quality improvement. Efforts to improve quality in the medical profession have a long tradition of focusing on individual performance versus system performance. Exhibit 10.1 illustrates the potential flaw in this thinking. The bell-shaped curve, P-1, represents the overall performance of any given system. Curve P-2 illustrates an improved system of performance where the median performance is moved from M-1 to M-2. If an organization seeks to improve by only focusing on the low performers, it experiences only a small improvement, shown as I-1. By improving the system as
- 9. a whole, a much larger improvement is seen, as demonstrated by I-2. Although focusing on removing bad behavior and poor performance is necessary, it will not produce the optimum level of improvement being sought in the US healthcare system. Qu a L I t y a n d sa f e t y Im P r o v e m e n t Much of the work in quality improvement has focused on healthcare institutions such as hospitals; however, the findings of the IOM research are applicable to the medical practice as well. A common denominator in all healthcare environments is the healthcare provider. exhIbIt 10.1 Performance Improvement M-1 P-1 P-2 Remove the Bad M-2 EBSCOhost - printed on 4/16/2020 7:48 PM via SUNY CANTON. All use subject to https://www.ebsco.com/terms-of- use
- 10. 2 8 7C h a p t e r 1 0 : Q u a l i t y M a n a g e m e n t In a landmark study published by RAND Corporation in 2006, quality was found to be lacking in the services offered by medical practices. Overall, adults received about half of the recommended care; furthermore, that finding did not vary significantly across metropolitan areas. In addition, wide variability in the quality of care received was noted across communities for the same disease state. All social and demographic groups were affected. One conclusion of the study is that the lack of care received by patients was caused by the absence of investment in systemwide information technology, performance tracking, and incentives for improving care (RAND 2006). For the most part, practices still are not reimbursed for services by third-party payers on the basis of the quality of care delivered, but on volume (McKesson 2016). Although no practice wishes to provide care in a way that produces poor quality, the focus on volume and the lack of focus on outcomes create distortions in the way leaders manage their prac- tices. In fact, this reimbursement methodology is a major contributing factor to misaligned incentives (Network for Regional Health Improvement 2008; Miller 2009). These ideas are not new, but progress toward moving to value from a volume-based system has been slow, painstaking, and resisted by stakeholders. As discussed in the “Change Management” section of chapter 8, healthcare is plagued by high resistance to
- 11. change. The National Committee for Quality Assurance (NCQA) has also made striking observations about the US healthcare system. A report published in 2007 states, “Research shows that the quality of health care in America is, at best, imperfect, and, at worst, deeply flawed” (NCQA 2007). In Crossing the Quality Chasm, IOM (2001) recommends that private and public purchasers, healthcare organizations, clinicians, and patients work together to redesign healthcare processes in accordance with the rules that follow: 1. Care should be based on continuous healing relationships. Patients should receive care whenever they need it and in many forms, not just through face- to-face visits. The health care system should be responsive at all times (24 hours a day, every day), and access to care should be provided over the Internet, by telephone, and by other means in addition to face-to-face visits. 2. Care should be customized based on the patient’s needs and values. The system of care should be designed to meet the most common needs but should have the flexibility to respond to an individual patient’s choices and preferences. 3. The patient should be in control. Patients should be given necessary information and the opportunity to exercise as much control as they choose
- 12. over health care decisions that affect them. The health system should be able to accommodate differences in patient preferences and should encourage shared decision making. 4. The system should encourage shared knowledge and the free flow of information. Patients should have unfettered access to their own medical EBSCOhost - printed on 4/16/2020 7:48 PM via SUNY CANTON. All use subject to https://www.ebsco.com/terms-of- use F u n d a m e n t a l s o f M e d i c a l P r a c t i c e M a n a g e m e n t2 8 8 information and to clinical information. Clinicians and patients should communicate effectively and share information. 5. Decision making should be evidence-based. Patients should receive care based on the best available scientific knowledge. Care should not vary illogically from clinician to clinician or from place to place. 6. Safety should be a property of the system. Patients should be safe from injury caused by the care system. Reducing risk and ensuring safety will require systems that help prevent and mitigate errors.
- 13. 7. The system should be transparent. The health care system should make information available to patients and their families that allows them to make informed decisions when selecting a health plan, a hospital, or a clinical practice or when choosing among alternative treatments. Patients should be informed of the system’s performance on safety, evidence-based practice, and patient satisfaction. 8. The system should anticipate patients’ needs. The health system should be proactive in anticipating a patient’s needs, rather than simply reacting to events. 9. The system should constantly strive to decrease waste. The health system should not waste resources or patients’ time. 10. The system should encourage cooperation among clinicians. Clinicians and institutions should actively collaborate and communicate with each other to ensure that patients receive appropriate care. The prevailing mind-set and attitude about quality and safety should be in alignment with the sentiment from this quote from Antigone, by Sophocles (2005): “All men make mistakes, but a good man yields when he knows his course is wrong, and repairs the evil. The only crime is pride.” Errors of commission, errors of omission, errors of communica- tion, errors of context, and diagnostic errors are all to blame.
- 14. Furthermore, the human desire to be perfect contributes to the problem, not the solution (James 2013). The illusion of perfection is a point of view that is unrealistically held by the public. In the face of all these issues and variables surrounding patient safety and quality, leaders and managers of medical practices can no longer cling to the status quo. th e tr I P L e aI m Medical practices are at the forefront of population health management, as the medical practice is often the first contact patients have with the healthcare system. The Triple Aim is a cornerstone population health concept developed by Donald M. Berwick, MD, founder, president emeritus, and senior fellow of the Institute for Healthcare Improvement (IHI). In a sense, the approach has become national health policy in terms of the way many healthcare providers are beginning to think about healthcare. As shown in exhibit 10.2, the Triple Aim is focused on the following intersecting elements (IHI 2017): EBSCOhost - printed on 4/16/2020 7:48 PM via SUNY CANTON. All use subject to https://www.ebsco.com/terms-of- use 2 8 9C h a p t e r 1 0 : Q u a l i t y M a n a g e m e n t ◆ Per capita cost. This component of the Triple Aim intends to lower the cost of care per person (not cost in aggregate, because as population
- 15. increases, costs should naturally rise). ◆ Patient experience. The Triple Aim is concerned with patient experience because it has a huge impact on whether patients adhere to the treatment prescribed by providers. Evidence shows that patients who are satisfied with the care they receive and consider the care experience to be “good” are more likely to comply with the recommendations of their providers than are those who perceive their experience as unsatisfactory. Another benefit of consistently positive patient experiences is that it provides for an overall pleasant environment in the practice (Manary et al. 2013). ◆ Better health for the population as well as the individual. Considering the care of individual patients is no longer sufficient; to improve patient care, medical practices must take a broad look at the communities and populations served and develop strategies that improve the overall health of those groups. Naturally, medical practices are focused on individuals and individual care. They want to achieve the best outcome for each patient. However, attending to the health of the entire population is important because small segments of that population use enormous exhIbIt 10.2
- 16. The IHI Triple Aim Health for the Population We Serve Patient Experience Per Capita Healthcare Cost Source: Adapted from IHI (2017). EBSCOhost - printed on 4/16/2020 7:48 PM via SUNY CANTON. All use subject to https://www.ebsco.com/terms-of- use F u n d a m e n t a l s o f M e d i c a l P r a c t i c e M a n a g e m e n t2 9 0 amounts of healthcare resources, and society is asking the medical practice to take a sub- stantial role in addressing this critical issue. Qu a L I t y Im P r o v e m e n t Pr o c e s s e s Over the years, the terminology related to quality improvement has shifted from quality improvement (QI) to total quality management to process improvement, Lean, and Six Sigma, and now to Lean Six Sigma. All these have their basis in the work of W. Edwards Deming and other pioneers in the field. Deming often spoke about the
- 17. nature of the process and outcomes, teaching about process, the involvement of the individuals doing the work, and how important it was to the outcome. To demonstrate this lesson, he used a tool called the red bead experiment (Deming Institute 2017). In the red bead experiment, participants work on a mock production line. They are given specific instructions on how to carry out their work. They are not allowed to make any adjustments to the process or to the inputs or in any way influence how the result is produced. They are simply required to follow the exact instructions of their supervisor and “work hard.” The objective is to make white beads, not red beads. Some participants are given paddles containing small holes to accommodate the beads. They dip the paddle in a con- tainer full of red and white beads, shake off the excess, and take the paddle to an inspector, who counts the number of white beads the producer has made. Importantly, the inspector’s role adds no value to the process. The process is repeated, and frustration mounts as the participants realize achieving the best outcome (producing all white beads) is impossible because the input of red and white beads into the paddle is random. This simple but extremely effective experiential activity demonstrates the fact that the process is fundamental to the outcome of any activity. For example, over-reliance on
- 18. incentives to deliver performance is misguided; instead, practices must rely on providers’ internal motivation to do the right thing while having an environment and processes in place that create trust and allow employees to flourish. No one ever comes to work on any given day intending to do a poor job. When medical practices rely only on incentives to motivate members, they may accomplish their metrics, but as research has shown, they do not necessarily see improvement (Heidenreich et al. 2016). Metrics often are set too low to ensure success, and any failures to meet the metrics are easily explained. Practices must help all members of the practice evolve in terms of process improvement to contribute to and produce the outcomes desired by engaging teammates’ greatest asset—their mind. In this section, we discuss a variety of tools for process improvement. All these tools should be used with discretion and judgment and with a skill base that develops over time. EBSCOhost - printed on 4/16/2020 7:48 PM via SUNY CANTON. All use subject to https://www.ebsco.com/terms-of- use 2 9 1C h a p t e r 1 0 : Q u a l i t y M a n a g e m e n t v a r I at I o n a n d QI Another important issue in quality and safety are the standards established for the work
- 19. performed. Medical practices are now expected to create standard work processes that allow activities to be completed in the best way each time to reduce variation. Consider a practice that sees many patients each day. Several of those patients have similar attributes: the same diagnosis, the same gender, the same age, and so on. Why does one patient leave the practice pleased and praising the experience and another leave upset and threatening to never return? They saw the same provider, may even have been in the same corridor, and were seen in adjacent and presumably similar rooms. How could their experiences be so different? The answer is variation. Variation is the enemy of quality and of standard processes. In the absence of standards, tremendous variation emerges in all activities, pro- ducing a wide range of experiences and outcomes. To illustrate this point further, conduct the “draw a pig” exercise, related to visual cues and carefully crafted instructions, known as standard work. The complete exercise can be found in the Minnesota Office of Continuous Improvement Toolkit (MNCI 2016). Briefly, participants are asked to perform four sequential stages of this exercise. Stage 1: Each participant is given a sheet of paper with nine equal squares on it. They are asked to draw a pig. Each participant is given two minutes to complete the activity. The facilitator collects all the papers, and the group views the outcomes. The results vary tremendously in
- 20. the appearance of the pig (the outcome). Each person has applied his or her creativity in producing the pig, which is limited by each person’s expertise in drawing. Significantly, many participants tend not to finish the exercise in the time allowed. Stage 2: Each participant is given a sheet of paper with nine equal squares on it, as in the first stage. The difference this time is the facilitator also provides a carefully written set of instructions on how to draw the pig. The participants are again given two minutes to draw the pig. Each person reads and interprets the instructions according to his or her own frame of reference. The facilitator again collects all the papers, and again the group sees a great deal of variation, albeit less than in stage 1. As in the first stage of the exercise, a number of the participants typically are unable to finish the activity in the time allowed. Stage 3: Each participant is again given a sheet of paper with nine equal squares on it. This time, the facilitator provides the group with instructions for drawing the pig as well as an image of what the final result should look like. The participants are given one minute to complete the task.
- 21. EBSCOhost - printed on 4/16/2020 7:48 PM via SUNY CANTON. All use subject to https://www.ebsco.com/terms-of- use F u n d a m e n t a l s o f M e d i c a l P r a c t i c e M a n a g e m e n t2 9 2 At the end of the time, the facilitator collects the drawings and finds that virtually everyone was able to complete the task, with a striking reduction in the variation of the drawings (see exhibit 10.3). Stage 4: The participants review the group’s drawings from each stage, further illustrating the points of the exercise. The overall lesson from this exercise may be obvious, but it is a dramatic dem- onstration in an experiential learning framework that allows the participants to see the nature of variation as well as how important standard work is in reducing that variation. It also emphasizes the importance of experience in the work performed. The more learning opportunities of this nature that practice members experience, the more able they are to understand why similar patients may have very different experiences and perceive a differ- ence in service in a practice. The red bead experiment and the “draw a pig” exercise might be seen as contra- dictory. The red bead experiment implies that work should not
- 22. be standardized and that workers should be involved in how the work is done, whereas the “draw a pig” exercise seems to support the notion that standardization improves quality by reducing variation. Both implications are true. Practices must standardize effective processes and continually exhIbIt 10.3 The Standard Pig 1 10 8 7 13 9 11 2 6 3 5 12 4 EBSCOhost - printed on 4/16/2020 7:48 PM via SUNY CANTON. All use subject to https://www.ebsco.com/terms-of- use
- 23. 2 9 3C h a p t e r 1 0 : Q u a l i t y M a n a g e m e n t improve them through worker involvement. In that way, they provide the best methods of performing the work at any given time to all their patients. Direct contact with the patient requires that professional judgment and variation be applied, but these direct contact processes, including front- and back-office operations and how patients flow through the practice, can all benefit from standardization. L e a n Regardless of a practice’s size or the services it provides, a fundamental knowledge of the quality improvement process is essential. We can always do better, and we should always consider that opportunity in everything we do. The minute a practice stops improving or looking for opportunities to improve, it begins to stagnate. Staying the same in a medical practice is not an option. Lean is a quality improvement process created by the Toyota Motor Company that focuses on the elimination of waste (Liker 2004). Waste is defined from the perspective of the customer—for medical practices, the patient—as unnecessary steps in a process or procedure that create no value for the customer.
- 24. The eight commonly identified types of waste in Lean are as follows: ◆ Overproduction, or doing more than is required or doing it earlier than needed. ◆ Waiting, for people, supplies, or activities, at any step in a process. Waiting to see the clinician, standing in line to register, or being on hold during a phone call are examples. ◆ Transportation, or getting people or things to their required locations. Moving mobile equipment from place to place is an example. ◆ Inventory, such as records, supplies, and unfinished work. Having unfinished charts or keeping more supplies at the work station than needed are examples. ◆ Motion, or extra steps taken because of inefficient layouts of the workplace. Having a work station far away from the examining rooms is an example. ◆ Defects, or rework that must be done because of an error. A lost lab test or record is an example; another is repeat phone calls to the practice due to slow follow-up. ◆ Underutilization of people, or having people work beneath their skill level and not listening to their ideas.
- 25. EBSCOhost - printed on 4/16/2020 7:48 PM via SUNY CANTON. All use subject to https://www.ebsco.com/terms-of- use F u n d a m e n t a l s o f M e d i c a l P r a c t i c e M a n a g e m e n t2 9 4 The time a patient waits to see a provider in a medical practice provides no value to the patient and, in fact, provides no value to the practice. In the author’s experience, the number one complaint for many medical practices is waiting time: Of the more than 5,000 complaints reviewed, roughly 4,000 were related to complaints about wait times or delays in receiving test results. A typical Lean project in a medical practice undertaken to address patient wait times is demonstrated by the following story. The CEO of a well- known healthcare organization was showing a Lean master from Japan around the organization. With much pride, the CEO guided the master from place to place and gave a careful explanation of the services and aspects of each location. When they entered a waiting room, the Lean master asked, “What space is this?” The CEO replied, “It’s a waiting room.” The Lean master responded, “What waits here?” And the CEO, now startled, replied, “Patients, of course!” The Lean master said, “Didn’t you know they were coming?” The CEO said, “Of course. Some of them have had appointments for almost a year.” At that, the Lean master looked the CEO in the eye and said, “Aren’t you
- 26. ashamed?” He meant, shouldn’t the practice be ashamed that it was not better prepared to receive patients even though it had ample time to do so? The CEO gained a new perspective following this visit (Virginia Mason Medical Center, personal communication, 2013). The Lean master only asked questions up until the final statement. He was helping the CEO understand the nature of the situation, not simply telling him what it was. In addition, the story helps us see that we are often too interested in explaining why something is wrong or why it cannot be changed, rather than thinking deeply about how we might improve the situation. This excuse making may be particularly evident in healthcare because of the industry’s reluctance to admit its shortcomings. Another important aspect of Lean is visual management. Lean relies on visual man- agement to be effective; this means going to see what is happening in the work area, not simply reading a report or reviewing second-hand information. Leaders must be present in the gemba, the place where the work occurs, and determine for themselves what is tak- ing place. Reports and accounts by others have a biased frame of reference, are subject to misinterpretation, and in the rare case are intentionally deceptive. Visual management is an essential skill for the effective practice manager; it can even be practiced at some level in the largest provider practices. The Five Whys
- 27. One Lean tool used for root cause analysis is known as “the five whys.” If you ask why in response to each statement when looking at a situation, the root cause of the issue will emerge if “why” is asked enough times. Take the following example: 1. Why do patients have to wait? Because we do not allow enough time for each visit. EBSCOhost - printed on 4/16/2020 7:48 PM via SUNY CANTON. All use subject to https://www.ebsco.com/terms-of- use 2 9 5C h a p t e r 1 0 : Q u a l i t y M a n a g e m e n t 2. Why? Because we have routinely scheduled patients at 15- minute intervals. 3. Why? Because that’s the way we have always done it, and we need to see a certain number of patients each day. 4. Why? The providers often do not stay on schedule. 5. Why? Because they’re too busy. All these answers hold the possibility for change. One can begin to see the nature of the five whys and its usefulness as a technique in root cause analysis. Implicit in the technique is the idea of helping others discover solutions and
- 28. the causes of problems rather than relying on management to tell them what to do. A fundamental aspect of Lean leader- ship and management is to create problem solvers. The Six Ss Another easy-to-apply Lean tool is the six Ss. This technique is useful in helping practice members organize their work area. The steps include the following: 1. Sort. Remove all unnecessary supplies and items from the work area. In essence, reduce the clutter. 2. Set. Organize the remaining items in the work area in a way that is logical and useful. 3. Shine. Clean the work area and inspect it for needed repairs. 4. Standardize. Prepare written standards for how the workspace is to be organized, which may include labels or even outlines of where particular items are to be located. 5. Sustain. Ensure that the standards are applied on a regular basis by inspecting the work area. 6. Safety. Ensure that the work area is safe and free of visible hazards, such as electrical cords that create a trip hazard or medicines that are not stored
- 29. properly and pose a poison hazard. Success is achieved when waste created by a poorly organized work area is eliminated, thereby removing the need to look for supplies or equipment. This strategy can also elimi- nate the largest waste of all: an injury caused by unsafe working conditions (Jackson 2009). EBSCOhost - printed on 4/16/2020 7:48 PM via SUNY CANTON. All use subject to https://www.ebsco.com/terms-of- use F u n d a m e n t a l s o f M e d i c a l P r a c t i c e M a n a g e m e n t2 9 6 c o n d u c t I n g a L e a n P r o j e c t The philosophy of continuous improvement is often referred to as kaizen, a Japanese business term, and can be used interchangeably with “Lean project.” After a six S is completed, a more ambitious undertaking in the medical practice is a Lean process improvement proj- ect. Some additional training in Lean is advisable for those who wish to become proficient practitioners of the technique (Martin and Osterling 2007). A Lean process improvement project involves seven important steps: Step 1: Introduce the Project Introduction of the project is a critical first step in the process. All members of the team
- 30. must understand the nature of and the desired outcome for the project. Also important is to gain commitment to the project from each team member. Most practices have several issues that require attention and could benefit from an improvement project. On the basis of input from different areas of the practice, the leader- ship should select projects and prioritize them according to the greatest benefit to patients in the practice. Examples include reducing waiting time, reducing the time patients are left on hold when they call, reducing billing cycle time, reducing medical record error rates, and increasing immunization rates for children in the practice. Practices need not undertake and complete one project at a time. In fact, multiple simultaneous projects may be considered, depending on the capacity of the practice. Step 2: Define the Problem Projects often fail because participants lack clarity about the nature of the project and, more specifically, a clear definition of the problem being addressed. Problem statements need to be concise, measurable, and within the power of the team to manage. For example, addressing Medicare regulations would be unrealistic for a process improvement team as they are beyond the power of the team to change them. Of course, a process that helps the practice comply with a particular regulation might be a worthy project.
- 31. Process improvement projects are always data driven. The process being examined must have measurable features that can be tracked over time as a way of measuring improve- ment. The adage, “You can’t manage what you can’t measure” is true for process improve- ment. The team must determine what metrics (measurements) will be collected for the project. Existing data are helpful for establishing a baseline measurement for the process. A simple charter for the team can be used that indicates the purpose of the team, the problem it is addressing, and the desired outcome. Such a document helps prevent “scope creep,” when the purpose and focus of the project begin to drift and the team loses sight of its original purpose. Certainly, revising the problem statement is necessary if the EBSCOhost - printed on 4/16/2020 7:48 PM via SUNY CANTON. All use subject to https://www.ebsco.com/terms-of- use 2 9 7C h a p t e r 1 0 : Q u a l i t y M a n a g e m e n t team discovers new information that better addresses the original concern. However, this decision should be made in a deliberate and orderly fashion. Step 3: Introduce the Project, Form a Team Unlike some approaches to problem solving in which the leadership or the manager makes
- 32. the decision about what to do, effective QI procedure takes a team approach, such that the stakeholders of the process take part in improving the process. This notion stems from the understanding that those who perform the work have the greatest insight into how to improve any work process. The team should be multidisciplinary, as attention should always be paid to how the work comes to the practice, what the practice does with it, and who encounters the results of the work. These teams should be relatively small; five to seven members is often deemed an appropriate number, depending on the size of the practice. One essential member of the team is a physician champion. This individual is a physician who has demonstrated an interest in the project, works well on teams, and has the time and inclination to serve on the team. A physician champion not only provides expertise but also represents the clinicians and can help explain and garner support for the project, which will be necessary for its acceptance and success. Another valuable idea for beginning a process improvement activity is to start with a small issue first. This approach allows the group to develop expertise, experience some success, and gain a thorough knowledge of the concepts before beginning large, complex projects. Step 4: Determine the Present Circumstances Defining the current situation is crucial in process
- 33. improvement. A process flowchart, also known as a value stream map, may be helpful in identifying all the parts of the process, particularly those areas that are of the greatest concern. Exhibit 10.4 illustrates a simple flowchart. A flowchart defines an overall process, such as patient flow through the practice, or a subset of that operation, for example, the check-in process. The critical points in the process flowchart include the input, which is the starting point of the process; the tasks performed using the input; and the production of an output, which can be further utilized in the operation. The input should be carefully identified, as should each task and the desired out- put from the process. The pace of the process, or the time taken to perform each task, is called takt time. Takt time is often used as a metric in process improvement, especially in processes that seem to get bogged down and produce substantial waiting times or other unnecessary delays. EBSCOhost - printed on 4/16/2020 7:48 PM via SUNY CANTON. All use subject to https://www.ebsco.com/terms-of- use F u n d a m e n t a l s o f M e d i c a l P r a c t i c e M a n a g e m e n t2 9 8
- 34. With a well-designed flowchart, the team should be able to identify areas that require improvement (Jackson 2013). Step 5: Launch the Plan-Do-Study-Act Cycle At this point in the Lean process, the team must determine what possible solutions may improve the process being examined, and a pilot of the solution should be tested. The Plan-Do-Study-Act (PDSA) cycle, discussed in chapter 8, allows the team to experiment with a proposed solution to determine its effectiveness in improving outcomes. As shown in exhibit 10.5, the PDSA cycle can be repeated with new ideas and solutions until an optimum outcome is achieved. At that point, new standard work is created to sustain the improvement over time. If new standard work is not documented and communicated to those involved in doing the work, the process quickly reverts to its old methodology. As the illustration shows, the new standard work becomes the wedge that prevents the improve- ment from going back in time. Step 6: Implement the Improvement Once the team is satisfied with the results of the pilot study, widespread implementation of the new standard work is deployed. This implementation requires careful communication, changes in job aides or procedure manuals, and any training to adopt the new process. The importance of this step must not be underestimated. Adequate time and attention must
- 35. be taken to ensure acceptance and understanding of the new procedure. Variation is the enemy of quality, and implementing new standard work around important processes in the medical practice is essential to improving the outcome of practice activities. exhIbIt 10.4 Simple Process Flowchart Start Task 1 Task 2Task 3 Task 4 Input Output Next Process EBSCOhost - printed on 4/16/2020 7:48 PM via SUNY CANTON. All use subject to https://www.ebsco.com/terms-of- use 2 9 9C h a p t e r 1 0 : Q u a l i t y M a n a g e m e n t Step 7: Reflect on the Process Every learning activity must be followed by reflection. This
- 36. step provides an opportunity to ask what went well and what did not go as well as expected. What should the practice do differently next time to improve the process of quality improvement? It is also a good time to celebrate the success of the project. In this step, the three Rs are essential (ASQ 1996; Bicheno and Holweg 2008): 1. Reflection. What have you learned from this experience, not only in terms of the process being examined but of carrying out a Lean project? 2. Reward. The success and sometimes the simple completion of the project should be celebrated. Rewards can be simple recognitions of the efforts that individuals made in the learning. 3. Renewal. This is a good time for renewal and thinking about refocusing on the mission of the practice and on each member’s role in producing the outcomes the practice wishes to achieve. That sense of renewal and refocus is instrumental in helping motivate and maintain the commitment necessary for optimal practice performance. The IHI developed an informative and practical tip sheet, titled “The Seven Spreadly Sins,” for successfully sharing the results of process improvement work to increase adoption and utilization of the new standard work (exhibit 10.6). exhIbIt 10.5
- 37. Standard Work Improvement PDSA Cycles Rat e of Imp rove men t Time Im p ro ve m en t N ew S tan d ard
- 38. W o rk EBSCOhost - printed on 4/16/2020 7:48 PM via SUNY CANTON. All use subject to https://www.ebsco.com/terms-of- use F u n d a m e n t a l s o f M e d i c a l P r a c t i c e M a n a g e m e n t3 0 0 Qu a L I t y Im P r o v e m e n t to o L s The art and science of quality improvement are not limited to Lean, and often many addi- tional tools can be used in a Lean project or independently to help the manager and leaders of the practice address improvement issues. QI is a continuous process, and the following list of tools can be used to assist in identifying and managing quality issues (HRSA 2017): exhIbIt 10.6 Tips for Sharing Results from Improvement Work SIN: Give one person the responsibility to do it all. Depend on “local heroes.” DO THIS INSTEAD: Make spread a team effort.
- 39. SIN: Rely solely on vigilance and hard work. DO THIS INSTEAD: Sustain gains with an infrastructure to support them. SIN: Spread the success unchanged. Don’t waste time “adapting” because, after all, it worked so well the first time. DO THIS INSTEAD: Allow some customization, as long as it is controlled and elements that are core to the improvements are clear. SIN: Require the person and team who drove the initial improvements to be responsible for spread throughout a hospital or facility. DO THIS INSTEAD: Choose a spread team strategically and include the scope of the spread as part of your decision. SIN: Expect huge improvements quickly then start spreading right away. DO THIS INSTEAD: Create a reliable process before you start to spread. SIN: Don’t bother testing— just do a large pilot.
- 40. DO THIS INSTEAD: Start with small, local tests and several PDSA cycles. SIN: Check huge mountains of data just once every quarter. DO THIS INSTEAD: Check small samples daily or frequently so you can decide how to adapt spread practices. S P R E A D LY S I N S I II VI I V I I V II IV P D S A SOURCE: Institute for Healthcare Improvement. Used with permission. P R AC T I C A L T I P S F O R S U C C E S S F U L S H A
- 41. R I N G Source: IHI (2015). Used with permission. EBSCOhost - printed on 4/16/2020 7:48 PM via SUNY CANTON. All use subject to https://www.ebsco.com/terms-of- use 3 0 1C h a p t e r 1 0 : Q u a l i t y M a n a g e m e n t ◆ Checklist or check sheet. These simple tables or lists enumerate all the necessary steps or processes needed to complete a function. They are designed to assist the team or the individual performer and prevent him or her from forgetting any of the important steps in a process or procedure. Atul Gawande brought new attention to using checklists as a way of reducing errors and increasing quality in surgery. The concept stems from the fact that human beings can only focus on so much at one time and cannot always remember to do everything in a complex sequence of activities ( Gawande 2011). Reason (1990) adds that unaided recall is only about 90 percent accurate, which, for activities as important as healthcare delivery, is simply not good enough. In the Six Sigma methodology (discussed later in this chapter), “good enough” is represented by an error rate of 3.4 defects
- 42. per million opportunities, of six standard deviations (6σ) from the mean, or 99.997 percent error free, as shown in exhibit 10.7. Relying on human accuracy only, one might expect ten defects per hundred opportunities, or 100,000 errors per million opportunities, versus 3.4 if 6σ is achieved (Total defects ÷ Total opportunities × 1,000,000). ◆ Control chart. A control chart is used to measure the variation in a process over time. It records the activity of a process as a single line plot and indicates the upper and lower limits the process has produced. The wider the limits, the more variation is in the process, and this kind of chart allows the user to determine when the process is out of control and if the cause of the variation is due to special causes or normal variation. ◆ Strengths, weaknesses, opportunities, and threats (SWOT) analysis. As discussed in chapter 5, SWOT analysis is a way to capture the strengths, weaknesses, opportunities, and threats of the practice as part of a strategic planning or evaluation process. ◆ Run chart. Similar to a control chart, a run chart measures a process over time as a single line measure. It is the simplest form of plotting activity. Unlike the control chart, it does not contain upper and lower limits.
- 43. ◆ Fishbone diagram. These diagrams are also known as Ishikawa diagrams or cause-and-effect diagrams, which is more descriptive of their use. The fishbone diagram is a visual way of capturing possible root causes of a problem. ◆ Scatterplot. These plots are simple graphs depicting two variables as discrete events on two axes as a way to determine a potential correlation. ◆ Nodes of influence analysis. This is an analytical tool for determining who in any group of people has influence on the other members of the group. EBSCOhost - printed on 4/16/2020 7:48 PM via SUNY CANTON. All use subject to https://www.ebsco.com/terms-of- use F u n d a m e n t a l s o f M e d i c a l P r a c t i c e M a n a g e m e n t3 0 2 This technique is useful when determining the key individuals to enlist in introducing change to a practice. ◆ Brainstorming. Usually conducted with facilitation, brainstorming is a technique for obtaining input from a group without placing undue influence on the individual members of the group, thereby obtaining many
- 44. ideas from the maximum number of people. ◆ Affinity chart. This tool provides a method for organizing key themes from a brainstorming activity. ◆ Focus group. For this type of information gathering, members of a target group are convened to obtain facilitated input on issues or questions important to the practice. ◆ Focused conversation. Similar to the focus group, a focused conversation usually involves a facilitator and the issues or questions are related to particular issues or questions. However, focused conversations typically are conducted with only one or two individuals. ◆ Appreciative inquiry. This method seeks input from stakeholders by asking for examples of when they have had a positive experience. For example, a medical practice might ask a patient an appreciative inquiry question similar to this: “Tell me about a time when you received excellent care.” With this approach, the facilitator is able to glean important information about what exhIbIt 10.7 Graphic Representation of
- 45. Six Sigma 0 1–1 2–2 3–3 4–4 5–5 6–6 Lower Specification Limit 3.4 Defects per Million 3.4 Defects per Million Mean 99.997% Defect Free Upper Specification Limit EBSCOhost - printed on 4/16/2020 7:48 PM via SUNY CANTON. All use subject to https://www.ebsco.com/terms-of- use 3 0 3C h a p t e r 1 0 : Q u a l i t y M a n a g e m e n t made the visit a positive experience. It also focuses on the positive rather than simply looking for the counterfactual in reviewing complaints, and it does not presume an understanding of what patients expect. We often like to think we know, but we usually don’t.
- 46. ◆ Histogram. This tool is a simple graph consisting of rectangular bars that represent proportional frequency of the process or activity being measured. It provides a means to convey information quickly and in a way that illustrates variation. ◆ Pie chart. This simple graph illustrates a group of data where each section of a circle represents a proportion of the whole. Pie charting is one of the simplest ways to present information. ◆ Prioritization matrix. A prioritization matrix is a simple tool to sort a diverse group of items by order of priority. The priority is determined by the criteria of the user. s I x s I g m a Six Sigma was developed by Bill Smith at Motorola Corporation (Aveta Business Institute 2016) and was based in part on the work of Walter Shewhart, a statistical process control engineer and mathematician (Shewhart and Deming 2011) and on the concept of the normal curve, which dates back to the research of Carl Gauss in the eighteenth century (Tent 2006). As with all work that relies on statistical analysis, Six Sigma looks at inputs as a function of their output. This relationship can be expressed as
- 47. Y = f (x), where Y is the inputs, and the outcome is a function (f ) of the individual components (x) that drive outcome. Six Sigma uses the DMAIC methodology to work through improvement processes as follows: 1. Define what is critical to the patient, and map those processes at a high level. 2. Measure the inputs by planning the data collection to validate that the measurements are accurate. Establishing baseline measures for the processes EBSCOhost - printed on 4/16/2020 7:48 PM via SUNY CANTON. All use subject to https://www.ebsco.com/terms-of- use F u n d a m e n t a l s o f M e d i c a l P r a c t i c e M a n a g e m e n t3 0 4 being studied is a key activity in DMAIC. This step also includes identifying the variables that are most responsible for producing the desired outcome. 3. Analyze by using statistical methodology to test which inputs have the greatest influence on the outcome.
- 48. 4. Improve by designing solutions and selecting one to pursue and then determining the controls and type of culture needed to prove its effectiveness and sustain it. 5. Control by developing feedback loops, creating a process control plan to sustain the gains implemented, and then replicating the cycle. Six Sigma allows organizations to convert a practical issue into statistical terms and then find a statistical solution that is then implemented in practice. For example, when looking at wait times, a medical practice measures them to identify the components that affect the wait time, performs statistical analysis to determine those components that are most important, creates a solution that should address them, and implements the suggested solution. Say the overall wait time from check-in to leaving the practice following the visit is 15 minutes on average. The practice notes that the check-in portion of this wait cre- ates a significant increase in the patient’s overall waiting time at the office and institutes a solution—routine preregistration—that is expected to reduce check-in time. By reducing check-in time, the practice reduces overall wait time. As with Lean, most Six Sigma practitioners receive training on the tools and tech- niques involved (Barry, Brubaker, and Murcko 2002; Pyzdek and Keller 2014).
- 49. One debate that surfaces from time to time in QI circles is whether to use Six Sigma or Lean strategies. On the one hand, achieving an error rate of 6σ, the “namesake” goal of the Six Sigma methodology, or 3.4 defects per million opportunities, is such a daunting prospect that people feel demoralized and unable to commit to the QI process. Lean, on the other hand, focuses on improvement without placing a value judgment on the magnitude of that improvement. Although the ideal aim is to maximize the opportunities to improve the care provided to patients and the processes that serve the practice, the Lean process tends to be more palatable in practice than Six Sigma is. That said, Six Sigma is often very effective in the hands of skilled quality improve- ment practitioners. The primary differences between Lean and Six Sigma are illustrated in exhibit 10.8. As a rule of thumb, use Lean when streamlining any process and reducing process waste; use Six Sigma when process metrics are more difficult to collect or understand and project success requires analysis of multiple inputs. These are often chronic problems. Regardless of the strategy chosen, success hinges on applying the right tools. EBSCOhost - printed on 4/16/2020 7:48 PM via SUNY CANTON. All use subject to https://www.ebsco.com/terms-of- use
- 50. 3 0 5C h a p t e r 1 0 : Q u a l i t y M a n a g e m e n t data an a Ly t I c s Data analytics is discussed in detail in chapter 12 because it plays a big role in the future of healthcare. In this section, we introduce data analytics in the context of QI. Data are useless unless they can be turned into information that can be acted on. The lack of utility of the enormous amounts of data generated by the healthcare system has been a significant issue in the field. Paper records, multiple sources of records, and the general inability to bring information together to make sense of it are just some of the barriers to using data effectively. Consider this story: As a population health strategy, a large multispecialty practice aims to determine if A1c levels—an important measurement of diabetic control in patients— are recorded not only for all diabetic patients but also for patients diagnosed with a heart condition. Despite the meaningful use mandates, the practice has not yet converted its paper-based charts to an electronic health record system. In the absence of digital retrieval capabilities, the practice manager begins the data collection process by asking for a list, by chart number, of the records for all relevant patients. Next, he asks the medical records department to pull each of the charts on the list to check if an A1c level was recorded. When he receives the first hundred charts, he looks at the first
- 51. chart and notes that the A1c level is not recorded, even though this chart is for a diabetic patient. He walks back to the medical records department to see if the laboratory record was simply not placed in the chart. Receiving an inconclusive answer, he seeks out the provider to verify that the A1c level was ordered. Ultimately, he cannot find any A1c data for this patient. He cannot be sure if the test was performed; the only verifiable information he obtained is that the level was not recorded. How does a practice in this situation collect the data necessary to conduct popu- lation health activities and monitor the effectiveness of the practice without an efficient data collection process? The conclusion is obvious: Practices must develop digital systems exhIbIt 10.8 Comparison of Lean and Six Sigma Lean = Improvement focused on improving patient flow and eliminating the eight deadly wastes. • Define value • Measure • Analyze process (flow) • Improve process (pull) • Create new standard work (for the improvement)
- 52. Six Sigma = Process breakthroughs, design, or improvement. Teams focused on eliminating chronic problems and reducing variation in processes. • Define • Measure • Analyze • Improve • Control EBSCOhost - printed on 4/16/2020 7:48 PM via SUNY CANTON. All use subject to https://www.ebsco.com/terms-of- use F u n d a m e n t a l s o f M e d i c a l P r a c t i c e M a n a g e m e n t3 0 6 to collect and manage patient information to improve the health of a patient population. Payers and patients alike are demanding such capabilities. Making decisions on the basis of large sets of data without the use of powerful ana- lytical tools is beyond the capacity of the human mind and any manual capability. How- ever, the use of these tools is still fragmented and uneven in healthcare, especially in small medical practices. Without data analytics, the practice can be distracted by its paradigms and beliefs, which may obscure reality. We must use data to drive decisions, reduce bias, and effect improvements in the delivery of care.
- 53. 1. Describe the difference between “removing the bad” and “moving mean performance” for improving practice quality. 2. Describe each component of the Triple Aim and its importance to the US healthcare delivery system. 3. Identify and discuss the principles of Lean process improvement. 4. Write a brief outline of the steps in the Lean process. 5. How do Lean and Six Sigma differ? 6. Identify the components of the PDSA cycle, and discuss how each component is used in quality improvement. 7. Discuss the “seven spreadly sins.” Why are they important to quality improvement? American Society for Quality (ASQ). 1996. Handbook for Basic Process Improvement. Pub- lished May. http://rube.asq.org/gov/handbook-for-basic-process- improvement.pdf. Aveta Business Institute. 2016. “The History and Development of Six Sigma.” Accessed July 7. www.sixsigmaonline.org/six-sigma-training- certification-information/the-history -and-development-of-six-sigma.
- 54. Barry, R., C. Brubaker, and A. Murcko. 2002. The Six Sigma Book for Healthcare: Improving Outcomes by Reducing Errors. Chicago: Health Administration Press. Bicheno, J., and M. Holweg. 2008. The Lean Toolbox: The Essential Guide to Lean Transfor- mation, 4th ed. Johannesburg, South Africa: Picsee. d I s c u s s I o n Q u e s t I o n s r e f e r e n c e s EBSCOhost - printed on 4/16/2020 7:48 PM via SUNY CANTON. All use subject to https://www.ebsco.com/terms-of- use 3 0 7C h a p t e r 1 0 : Q u a l i t y M a n a g e m e n t Deming Institute. 2017. “Red Bead Experiment.” Accessed May 22. https://deming.org/ management-system/red-bead-experiment. Gawande, A. 2011. The Checklist Manifesto: How to Get Things Right. New York: Picador. Health Resources and Services Administration (HRSA). 2017. “Quality Improvement.” Accessed May 23.
- 55. www.hrsa.gov/quality/toolbox/methodology/qualityimprovemen t. Heidenreich, P., P. Solis, M. Estes, G. Fonarow, C. Jurgens, J. Marine, D. McManus, and R. McNamara. 2016. “2016 AHA Clinical Performance and Quality Measures for Adults with Atrial Fibrillation or Atrial Flutter.” Circulation: Cardiovascular Quality and Outcomes 9: 443–88. Institute for Healthcare Improvement (IHI). 2017. “Triple Aim for Populations.” Accessed May 22. www.ihi.org/Topics/TripleAim/Pages/default.aspx. . 2015. “Seven Spreadly Sins.” Cambridge, MA: IHI. Institute of Medicine (IOM). 2001. Crossing the Quality Chasm: A New Health System for the 21st Century. Washington, DC: National Academies Press. . 2000. To Err Is Human: Building a Safer Health System. Washington, DC: National Academies Press. Jackson, T. 2013. Mapping Clinical Value Streams. Washington, DC: Rona Consulting Group and Productivity Press.
- 56. . 2009. 5S for Healthcare. Washington, DC: Productivity Press. James, J. 2013. “A New, Evidence-Based Estimate of Patient Harms Associated with Hospital Care.” Journal of Patient Safety 9 (3): 122–28. Liker, J. 2004. The Toyota Way. New York: McGraw-Hill Education. Makary, M. A., and M. Daniel. 2016. “Medical Error—the Third Leading Cause of Death in the US.” Published May 3. www.bmj.com/content/bmj/353/bmj.i2139.full.pdf. Manary, M. P., W. Boulding, R. Staelin, and S. W. Glickman. 2013. “The Patient Experience and Health Outcomes.” New England Journal of Medicine 368: 201–3. Martin, K., and M. Osterling. 2007. The Kaizen Event Planner: Achieving Rapid Improvement in Office, Service, and Technical Environments. Washington, DC: Productivity Press. EBSCOhost - printed on 4/16/2020 7:48 PM via SUNY CANTON. All use subject to https://www.ebsco.com/terms-of- use F u n d a m e n t a l s o f M e d i c a l P r a c t i c e M a n a g
- 57. e m e n t3 0 8 McKesson Corporation. 2016. “Value-Based Reimbursement vs. Volume-Based Care.” Accessed July 1. www.mckesson.com/population-health- management/ population-health/know-the-challenges. Miller, H. 2009. “From Volume to Value: Better Ways to Pay for Health Care.” Health Affairs 28 (5): 1418–28. Minnesota Office of Continuous Improvement (MNCI). 2016. “CI Toolbox.” Accessed July 4. https://mn.gov/admin/continuous- improvement/resources/projects/toolbox. Mosadeghrad, A. M. 2014. “Factors Influencing Healthcare Service Quality.” International Journal of Health Policy and Management 3 (2): 77–89. National Committee for Quality Assurance (NCQA). 2007. The Essential Guide to Health Care Quality. Washington, DC: NCQA. Network for Regional Health Improvement. 2008. From Volume to Value: Transforming Health Care Payment and Delivery Systems to Improve Quality and Reduce Costs. New
- 58. York: Robert Wood Johnson Foundation. Pyzdek, T., and P. Keller. 2014. The Six Sigma Handbook, 4th ed. New York: McGraw-Hill Education. RAND Corporation. 2006. “The First National Report Card on Quality of Health Care in Amer- ica.” Santa Monica, CA: RAND. Reason, J. 1990. Human Error. Cambridge, UK: Cambridge University Press. Shewhart, W., and W. E. Deming. 2011. Statistical Method from the Viewpoint of Quality Control. Mineola, NY: Dover. Sophocles. 2005 (441 B.C.). Antigone. Clayton, DE: Prestwick House. Tent, M. B. W. 2006. The Prince of Mathematics: Carl Friedrich Gauss. Natick, MA: A K Peters/CRC Press. EBSCOhost - printed on 4/16/2020 7:48 PM via SUNY CANTON. All use subject to https://www.ebsco.com/terms-of- use Head-to-Toe Assessment
- 59. NSG3012 Week 4 Project System Findings (normal/abnormal) Equipment needed Laboratory findings