Keppel Ltd. 1Q 2024 Business Update Presentation Slides
Evaluation of particle shedding and trace metal extraction from high purity pumps
1. FT38- 01_5 CRITICAL
COMPONENTS
& SUB SYSTEMS
Evaluation of particle shedding and
trace metal extraction from high
purity pumps
Mark R. Litchy, CT Associates, Inc., Minnesota, USA & Reto Schoeb, Levitronix, LLC, Massachusetts, USA
ABSTRACT
The production of semiconductor devices continues to be extremely sensitive to particulate and metallic contamination. As
feature sizes continue to decrease, the need for purity will continue to increase. Various types of pumps are used in bulk chemical
delivery systems, recirculating etch baths, and other high purity process applications. Many of these pumps shed significant
quantities of particles that may reduce product yield or impact the performance or lifetime of filters used in the process loop.
Furthermore, metallic contamination in process chemicals can cause a variety of yield-related issues. This paper evaluates the
levels of trace metal extraction and particle shedding under different operating conditions using two high purity pump types
from three manufacturers.
Introduction centrifugal pumps deliver higher flow dampener – used to reduce pulsations
from the diaphragm pumps – was
rates at lower pressures.
The pumps being used for this study
employed during each pump test (even
(positive displacement pumps from Particle shedding though no pulse dampener was necessary
manufacturers A and B; magnetically
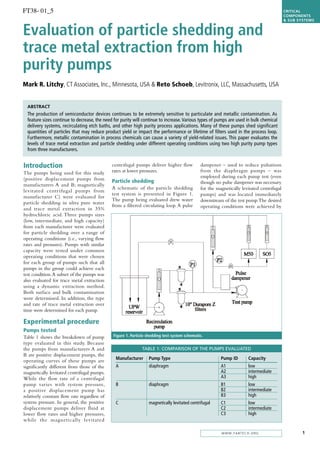
A schematic of the particle shedding for the magnetically levitated centrifugal
levitated centr ifugal pumps from
test system is presented in Figure 1. pumps) and was located immediately
manufacturer C) were evaluated for
The pump being evaluated drew water downstream of the test pump.The desired
particle shedding in ultra pure water
from a filtered circulating loop. A pulse operating conditions were achieved by
and trace metal extraction in 35%
hydrochloric acid. Three pumps sizes
(low, intermediate, and high capacity)
from each manufacturer were evaluated
for particle shedding over a range of
operating conditions (i.e., varying flow
rates and pressures). Pumps with similar
capacity were tested under common
operating conditions that were chosen
for each group of pumps such that all
pumps in the group could achieve each
test condition. A subset of the pumps was
also evaluated for trace metal extraction
using a dynamic extraction method.
Both surface and bulk contamination
were determined. In addition, the type
and rate of trace metal extraction over
time were determined for each pump.
Experimental procedure
Pumps tested
Figure 1. Particle shedding test system schematic.
Table 1 shows the breakdown of pump
type evaluated in this study. Because
the pumps from manufacturers A and TABLE 1: COMPARISON OF THE PUMPS EVALUATED
B are positive displacement pumps, the
Manufacturer Pump Type Pump ID Capacity
operating curves of these pumps are
A diaphragm A1 low
significantly different from those of the
A2 intermediate
magnetically levitated centrifugal pumps.
A3 high
While the flow rate of a centrifugal
pump var ies with system pressure, B diaphragm B1 low
B2 intermediate
a positive displacement pump has
B3 high
relatively constant flow rate regardless of
system pressure. In general, the positive C magnetically levitated centrifugal C1 low
displacement pumps deliver fluid at C2 intermediate
C3 high
lower flow rates and higher pressures,
while the magnetically levitated
1
WWW.FABTECH.ORG
2. FT38- 01_5
CRITICAL
COMPONENTS
& SUB SYSTEMS
either adjusting the pump rotational speed
(magnetically levitated centrifugal pumps)
or air pressure (diaphragm pumps) to the
pump and the pump outlet pressure with
a control valve located downstream of the
test pump.
A Particle Measuring Systems HSLIS-
M50 particle monitor and a Particle
Measuring Systems LiQuilaz-S05 liquid
particle counter were used to measure
particle sizes ranging from 0.05µm to
larger than 10µm.
Each pump was run under typical
operating conditions for a minimum of
three days prior to the start of this test
program to ensure that any particles
being shed were not simply due to the
fact that the pump was new. Following
this break-in period, quasi steady-state
particle shedding from each pump was
monitored over a range of operating
conditions. A minimum of two hours
of data was averaged once particle
concentrations had stabilized following
each change in operating conditions.
Trace metal extraction
The pumps were tested for trace metal
extraction using the dynamic extraction
Figure 2. Trace metal extraction system schematic.
test apparatus shown in Figure 2.
Figure 3. PSDs measured downstream of the low capacity pumps at selected operating conditions.
2 SEMICONDUC T O R F A B T E C H – 3 8 TH E D I T I O N
3. FT38- 01_5 CRITICAL
COMPONENTS
& SUB SYSTEMS
Figure 4. PSDs measured downstream of the intermediate capacity pumps at selected operating conditions.
Figure 5. PSDs measured downstream of the high capacity pumps at selected operating conditions.
3
WWW.FABTECH.ORG
4. FT38- 01_5
CRITICAL
COMPONENTS
& SUB SYSTEMS
This method allows measurement
o f b o t h s u rf ace contamination,
which is removed within a few
minutes of exposure to chemical,
and contamination from the bulk
mater ial. The total contamination
extracted from the component is
the sum of the surface and bulk
contamination. Since the contaminants
are measured over time, the rate of
extraction may also be determined [1].
High purity 35% HCl was used as
the extractant during each test. The
test pumps were operated during the
test to ensure that the acid was well
mixed in each system. Prior to each
test, a background sample was taken;
subsequent samples were taken at time
intervals evenly spaced on a logarithmic
scale from a sample port located in the
circulation loop. The chemical samples
were analyzed for 37 metallic elements,
while the results of these analyses were Figure 6. Surface, bulk, and total contamination measured during five pump tests.
converted to cumulative mass extracted.
channel, ≥ 0.05µm. The detection limit centrifugal pumps and the other pumps
Results and discussion of the M50 particle counter is believed at larger particle sizes and smaller
to be ~0.07-0.08µm, rather than 0.05µm. differences at smaller particle sizes.
Particle shedding This is not due to the fact that the M50 Table 2 presents a comparison of
An example of the quasi steady-state was not calibrated, but because how the the particle shedding results presented
par ticle concentrations measured manufacturer defines the sensitivity at in Figures 3-5. The ratios of the
downstream of each pump is presented 0.05µm. particle concentrations downstream
for selected operating conditions in The magnetically levitated centrifugal of positive displacement pumps to the
Figures 3, 4, and 5. System background (C1-C3) pumps consistently shed the particle concentrations downstream of
particle concentrations are also included. fewest particles of the pumps tested, comparably sized centrifugal pumps are
Each graph presents the cumulative regardless of operating conditions. presented for two particle size channels,
particle size distr ibution (PSD) at Furthermore, the particle concentrations ≥ 0.1µm and ≥ 0.5µm. The geometric
common operating conditions (flow measured downstream of the centrifugal mean and geometric standard deviation
rate and pump outlet pressure) denoted pumps were often close to (within a (GSD) are presented rather than
above each graph. The results from both factor of 5) the system background arithmetic mean since the concentration
particle counters were combined and concentrations. ratios appear to be lognor mally
presented in each graph. Typically, the slopes of the PSDs distr ibuted rather than nor mally
The PSDs presented were linear measured downstream of the centrifugal distributed. Pumps from manufacturers
when plotted on a log-log scale, which pumps were steeper than the other A and B typically shed approximately
is typical of particle shedding from pumps and were similar to the slope of 5-30 times as many particles ≥ 0.1µm as
components in liquids [2]. A linear the background PSD. The steeper slopes a comparable centrifugal pump, and 40-
regression through each set of data is measured during the centrifugal pump 275 times as many particles ≥ 0.5µm.
also included in each graph. The PSDs tests resulted in much larger differences Operating conditions had little
tend to flatten out at the smallest size in particle concentrations between the overall effect on particle concentrations
TABLE 2: COMPARISON OF THE PUMP MEAN PARTICLE CONCENTRATION RATIOS
Geometric Mean and GSD of the Concentration Ratios of Pumps from
Manufacturers A and B to the Comparable Sized Pump from Manufacturer C
≥ 0.l µm ≥ 0.5 µm
Pump
Manufacturer Pump ID Geometric Mean GSD Geometric Mean GSD
A A1 17 1.6 115 1.4
A2 18 1.8 133 1.5
A3 6 1.4 72 1.7
B B1 23 1.9 48 1.7
B2 7 3.1 40 3.5
B3 32 2.0 277 2.4
4 SEMICONDUC T O R F A B T E C H – 3 8 TH E D I T I O N
5. FT38- 01_5 CRITICAL
COMPONENTS
& SUB SYSTEMS
Figure 7. Mass extracted from the bulk material of five pumps
Figure 8. Mass extraction rates from five pumps at selected times.
over time.
Summary
downstream of the pumps [3]. Pump The metallic extraction from all
outlet pressure had a greater effect on of the pumps was considered to be
Particle shedding from nine high
particle concentrations than flow rate, relatively low. The magnetically levitated
pur ity pumps from three different
with particle concentrations typically centrifugal pumps had lower surface,
manufacturers was measured under
remaining the same or increasing with bulk, and total metallic contamination
typical operating conditions. The three
increasing outlet pressure. Meanwhile, than the other pumps (although two of
magnetically levitated centr ifugal
flow rate had a minimal effect on these pumps were considerably smaller
pumps shed the fewest particles of
par ticle concentrations at most than the other pumps). The rates of
the nine pumps evaluated, regardless
operating conditions tested; as a result, extraction were lowest for the C1 and
of operating conditions. The particle
the number of particles shed typically C2 magnetically levitated centrifugal
concentrations measured downstream
increased linearly with increasing flow pumps, while extraction rates from A3,
of the centrifugal pumps were often
rate. Under some operating conditions, B3, and C3 pumps were similar.
ver y close to system backg round
particle concentrations increased with concentrations. The slopes of the PSDs
increasing flow rate. Differences among downstream of the centrifugal pumps REFERENCES
the pumps were similar under all were steeper than the other pumps
operating conditions. [1] Grant, D.C., Lemke, T., Duepner, G.,
and similar to the slope of the system
Wilkes, D. & Powell, N. 1996, J. Inst.
background. As a result, the difference
Trace metal extraction
Env. Sci., 39(2), pp. 29-37.
in particle concentrations increased
Figure 6 compares the surface, bulk,
as particle size increased. Operating [2] Grant, D.C. & Schmidt, W.R. 1987,
and total metallic contamination
conditions had little overall effect on J. Env. Sci., 30(3), pp. 28-30.
extracted from each pump tested.
particle concentrations downstream
All of the pumps showed relatively [3] Litchy, M.R. & Schoeb, R. 2008,
of the pumps. Particle shedding from
slow extraction with the total mass Ultra Pure Fluid and Wafer Cleaning
the two types of positive displacement
extracted varying from 1 to 13µg. The Conference, February 13, 2008,
pumps were often similar.
three pumps supplied by manufacturer Santa Clara, CA.
C showed the lowest level of surface
ABOUT THE AUTHORS
contamination; however, surf ace
contamination is less important than Mark Litchy works as a Research Engineer for CT technology. He has 18 years of experience in
extraction rate as it can be removed Associates, Inc., a contract research, development bearingless motor technology, and has authored
by pre-extracting a component prior and testing services company for contamination or co-authored 34 patents. A graduate of the
to its use. control, particle measurement and control, ETH Zurich in Switzerland, he has an M.S. degree
Figure 7 shows the mass extracted
filtration, permeation and chemical engineering. in electrical engineering and a Ph.D. in technical
from the bulk material of each pump
He has more than 12 years of experience in science.
over time for all measured elements.
particle measurement and control in high purity
Since theory predicts that the extraction
liquid chemicals and gases and CMP slurry
data can be fit by a power law equation, ENQUIRIES
the data should follow a straight line characterization. He is the author or co-author
Mark Litchy – CT Associates, Inc.
when plotted on a log-log scale [1]. of more than 30 publications and presentations.
7121 Shady Oak Road
The rate of trace metal extraction can He has an M.S. degree in mechanical engineering
Eden Prairie
be determined from the slope of these from the University of Minnesota (Minneapolis,
MN 55344
data. The mass extraction rates for each MN) and a B.S. degree in physics from St. John’s
USA
pump at selected times are presented in University (Collegeville, MN).
Figure 8. The rates of extraction were
lowest for the C1 and C2 centrifugal Tel: +1 (952) 470 0166
Reto Schoeb is the CEO and founding member of
pumps. Extraction rates from A3, B3, Email: mark@ctassociatesinc.com
Levitronix GmbH, a pioneer in bearingless pump
and C3 pumps were similar.
5
WWW.FABTECH.ORG