SlideShare a Scribd company logo
1 of 4
Download to read offline
Research systems with free software
                              Karl T. Diedrich Karl.Diedrich@utah.edu
                                          University of Utah
                                Department of Biomedical Informatics
                             Utah Center for Advanced Imaging Research
                                              11/30/2009


I want to share with you research systems I have built using free and open-source software. Your
research will be different than mine but I think many of you can benefit from the same tools and
systems.

My main research system is composed of the image processing tool ImageJ (http://rsbweb.nih.gov/ij/),
the relational database management system MySQL (http://www.mysql.com/), and the statistics and
plotting tool R (http://www.r-project.org/). Additional software connects these tools into a system. The
MySQL JDBC Connector (http://dev.mysql.com/downloads/connector/j/3.1.html) allows ImageJ to
store data in MySQL. RMySQL (http://cran.r-project.org/web/packages/RMySQL/) allows R to access
and display data stored in MySQL. Next I will demonstrate how this system works in my research and
hopefully how they can help in yours.

ImageJ is an image processing graphical user interface (GUI) with many built in tools for reading,
writing and manipulating images (Figure 1). ImageJ can handle the medical image DICOM format. In
addition ImageJ provides a macro scripting tool for automating repetitive tasks and a Java
programming library accessing all of ImageJ's features. New applications written using the ImageJ
application programming interface (API) can either be plug-ins to ImageJ appearing in the ImageJ
plug-in menu or they can be separate programs using only the parts of ImageJ needed. ImageJ provides
image processing tools from easy to use GUI tools to an application programming library depending on
your needs. This allows you to start using ImageJ for simple uses, write macros to automate task and
then write your own programs as your research needs grow.


Figure 1. ImageJ image processing graphical user interface.

In my experiments I try image manipulations with many parameters. The parameters and experiment
results and measurements are import to save for optimizing my parameters. This normally means
copying or typing them into a spreadsheet. ImageJ enables you to write plug-in dialog boxes to input
the extensive parameters (Figure 2). The JDBC connector saves all the parameters to the MySQL
relational database. The relation database allows you to query out just the parameters you want to see
as seen in Figure 3. Querying data with the structured query language (SQL) provided by MySQL lets
you see and focus on only the data you need and ask and answer questions on your data such as your
subjects' average age, number of males and females or any other information recorded. Unfortunately if
the data wasn't put in the database you cannot query the information out. So when developing a
database application I try to record everything including were the mouse was clicked on images. I will
talk more on this level of detailed record keeping later.


Figure 2. Program parameters


Figure 3. Querying only the desired parameters from the database.

With ImageJ I was able to develop plug-ins that interact with the images. The ends of white line in the
image below (Figure 4) were selected on the image with mouse clicks. The ImageJ plug-ins measures
the twistedness of the line and radius of the artery at each point along the white line (Figure 5). I want
to save the end points of the white measurement line. The important point to take home is there is a
vast amount of data to save per study subject and the database keeps all the data in an accessible
format.
Figure 4. Image measurements.


Figure 5. Measurements are recorded to the database.
The database and SQL make it easy to get all the recorded data back in endless columns of data. To
make sense of the data import the data into the into the statistics tool called R. R provides full statistical
analysis tools and publication quality graph and plot production tools. Some examples are shown below
(Figure 6). The RMyQSL package to R directly connects R to MySQL to create plots those in the
images below in one step.


Figure 6. Statistical analysis plotting and graphing with R.

The free software tools ImageJ, MySQL and R can be chained into a research data recording and
graphical analysis system. There are several advantages to the system being built with free software.
First it's free, you don't have to pay from the software this becomes even more important than at first
thought when you want to run the software on multiple computers. These software packages are also
open-source. This is important because they have been compiled for almost every operating system
including Microsoft Windows, Apple Mac and Linux. This means you can have the same system on a
Windows desktop computer, a Mac laptop for demonstrating your systems and research and the Linux
server at the University of Utah Center for High Performance Computing for heavy duty computation.
You can distribute your system to users without their buying a license or run on multiple processors to
speed processing times without worrying about having enough licenses.

More Related Content

What's hot

Modern Database Systems - Lecture 00
Modern Database Systems - Lecture 00Modern Database Systems - Lecture 00
Modern Database Systems - Lecture 00Michael Mathioudakis
 
Introduction to databases
Introduction to databasesIntroduction to databases
Introduction to databasesBryan Corpuz
 
Introduction to database with ms access.hetvii
Introduction to database with ms access.hetviiIntroduction to database with ms access.hetvii
Introduction to database with ms access.hetvii07HetviBhagat
 
Data_Processing_Program
Data_Processing_ProgramData_Processing_Program
Data_Processing_ProgramNeil Dahlqvist
 
Granularity analysis of classification and estimation for complex datasets wi...
Granularity analysis of classification and estimation for complex datasets wi...Granularity analysis of classification and estimation for complex datasets wi...
Granularity analysis of classification and estimation for complex datasets wi...IJECEIAES
 
Database Concepts and Components
Database Concepts and ComponentsDatabase Concepts and Components
Database Concepts and ComponentsRIAH ENCARNACION
 
Data repository for sensor network a data mining approach
Data repository for sensor network  a data mining approachData repository for sensor network  a data mining approach
Data repository for sensor network a data mining approachijdms
 
Importance of database design (1)
Importance of database design (1)Importance of database design (1)
Importance of database design (1)yhen06
 
Data Models [DATABASE SYSTEMS: Design, Implementation, and Management]
Data Models [DATABASE SYSTEMS: Design, Implementation, and Management]Data Models [DATABASE SYSTEMS: Design, Implementation, and Management]
Data Models [DATABASE SYSTEMS: Design, Implementation, and Management]Usman Tariq
 
Data Modeling Basics
Data Modeling BasicsData Modeling Basics
Data Modeling Basicsrenuindia
 

What's hot (17)

Modern Database Systems - Lecture 00
Modern Database Systems - Lecture 00Modern Database Systems - Lecture 00
Modern Database Systems - Lecture 00
 
Introduction to databases
Introduction to databasesIntroduction to databases
Introduction to databases
 
Lecture1 data structure(introduction)
Lecture1 data structure(introduction)Lecture1 data structure(introduction)
Lecture1 data structure(introduction)
 
Introduction to database with ms access.hetvii
Introduction to database with ms access.hetviiIntroduction to database with ms access.hetvii
Introduction to database with ms access.hetvii
 
Database fundamentals
Database fundamentalsDatabase fundamentals
Database fundamentals
 
Different data models
Different data modelsDifferent data models
Different data models
 
Data_Processing_Program
Data_Processing_ProgramData_Processing_Program
Data_Processing_Program
 
Granularity analysis of classification and estimation for complex datasets wi...
Granularity analysis of classification and estimation for complex datasets wi...Granularity analysis of classification and estimation for complex datasets wi...
Granularity analysis of classification and estimation for complex datasets wi...
 
Abstract.DOCX
Abstract.DOCXAbstract.DOCX
Abstract.DOCX
 
Database Concepts and Components
Database Concepts and ComponentsDatabase Concepts and Components
Database Concepts and Components
 
Data repository for sensor network a data mining approach
Data repository for sensor network  a data mining approachData repository for sensor network  a data mining approach
Data repository for sensor network a data mining approach
 
Importance of database design (1)
Importance of database design (1)Importance of database design (1)
Importance of database design (1)
 
Data Models [DATABASE SYSTEMS: Design, Implementation, and Management]
Data Models [DATABASE SYSTEMS: Design, Implementation, and Management]Data Models [DATABASE SYSTEMS: Design, Implementation, and Management]
Data Models [DATABASE SYSTEMS: Design, Implementation, and Management]
 
Weka
Weka Weka
Weka
 
Week 9.docx
Week 9.docxWeek 9.docx
Week 9.docx
 
Data Modeling Basics
Data Modeling BasicsData Modeling Basics
Data Modeling Basics
 
Assigment 2
Assigment 2Assigment 2
Assigment 2
 

Similar to Diedrich Free Research Systems

Big Data visualization
Big Data visualizationBig Data visualization
Big Data visualizationShilpa Soi
 
IRJET- Plug-In based System for Data Visualization
IRJET- Plug-In based System for Data VisualizationIRJET- Plug-In based System for Data Visualization
IRJET- Plug-In based System for Data VisualizationIRJET Journal
 
GENERATION OF DATABASE AND GUI IN SHAPE MATCHING TECHNIQUE | J4RV3I12001
GENERATION OF DATABASE AND GUI IN SHAPE MATCHING TECHNIQUE | J4RV3I12001GENERATION OF DATABASE AND GUI IN SHAPE MATCHING TECHNIQUE | J4RV3I12001
GENERATION OF DATABASE AND GUI IN SHAPE MATCHING TECHNIQUE | J4RV3I12001Journal For Research
 
Data analytics using R programming
Data analytics using R programmingData analytics using R programming
Data analytics using R programmingUmang Singh
 
IRJET - Health Medicare Data using Tweets in Twitter
IRJET - Health Medicare Data using Tweets in TwitterIRJET - Health Medicare Data using Tweets in Twitter
IRJET - Health Medicare Data using Tweets in TwitterIRJET Journal
 
WELCOME TO AI PROJECT shidhant mittaal.pptx
WELCOME TO AI PROJECT shidhant mittaal.pptxWELCOME TO AI PROJECT shidhant mittaal.pptx
WELCOME TO AI PROJECT shidhant mittaal.pptx9D38SHIDHANTMITTAL
 
RGBEXCEL: AN RGB IMAGE DATA EXTRACTOR AND EXPORTER FOR EXCEL PROCESSING
RGBEXCEL: AN RGB IMAGE DATA EXTRACTOR AND EXPORTER FOR EXCEL PROCESSINGRGBEXCEL: AN RGB IMAGE DATA EXTRACTOR AND EXPORTER FOR EXCEL PROCESSING
RGBEXCEL: AN RGB IMAGE DATA EXTRACTOR AND EXPORTER FOR EXCEL PROCESSINGsipij
 
Minor Project Synopsis on Data Structure Visualizer
Minor Project Synopsis on Data Structure VisualizerMinor Project Synopsis on Data Structure Visualizer
Minor Project Synopsis on Data Structure VisualizerRonitShrivastava057
 
Data Science: A Revolution of Data
Data Science: A Revolution of DataData Science: A Revolution of Data
Data Science: A Revolution of DataIRJET Journal
 
Search engine based on image and name for campus
Search engine based on image and name for campusSearch engine based on image and name for campus
Search engine based on image and name for campusIRJET Journal
 
Virtual Research Environment for Cancer Imaging
Virtual Research Environment for Cancer ImagingVirtual Research Environment for Cancer Imaging
Virtual Research Environment for Cancer ImagingJisc
 
Tools for Unstructured Data Analytics
Tools for Unstructured Data AnalyticsTools for Unstructured Data Analytics
Tools for Unstructured Data AnalyticsRavi Teja
 
Efficiency and Effectiveness: Shared services to support STEM subjects
Efficiency and Effectiveness: Shared services to support STEM subjectsEfficiency and Effectiveness: Shared services to support STEM subjects
Efficiency and Effectiveness: Shared services to support STEM subjectsJisc
 

Similar to Diedrich Free Research Systems (20)

Big Data visualization
Big Data visualizationBig Data visualization
Big Data visualization
 
IRJET- Plug-In based System for Data Visualization
IRJET- Plug-In based System for Data VisualizationIRJET- Plug-In based System for Data Visualization
IRJET- Plug-In based System for Data Visualization
 
Module 1
Module  1Module  1
Module 1
 
GENERATION OF DATABASE AND GUI IN SHAPE MATCHING TECHNIQUE | J4RV3I12001
GENERATION OF DATABASE AND GUI IN SHAPE MATCHING TECHNIQUE | J4RV3I12001GENERATION OF DATABASE AND GUI IN SHAPE MATCHING TECHNIQUE | J4RV3I12001
GENERATION OF DATABASE AND GUI IN SHAPE MATCHING TECHNIQUE | J4RV3I12001
 
B040101007012
B040101007012B040101007012
B040101007012
 
SVD Based Blind Video Watermarking Algorithm
SVD Based Blind Video Watermarking AlgorithmSVD Based Blind Video Watermarking Algorithm
SVD Based Blind Video Watermarking Algorithm
 
Data analytics using R programming
Data analytics using R programmingData analytics using R programming
Data analytics using R programming
 
IRJET - Health Medicare Data using Tweets in Twitter
IRJET - Health Medicare Data using Tweets in TwitterIRJET - Health Medicare Data using Tweets in Twitter
IRJET - Health Medicare Data using Tweets in Twitter
 
Fulltext01
Fulltext01Fulltext01
Fulltext01
 
WELCOME TO AI PROJECT shidhant mittaal.pptx
WELCOME TO AI PROJECT shidhant mittaal.pptxWELCOME TO AI PROJECT shidhant mittaal.pptx
WELCOME TO AI PROJECT shidhant mittaal.pptx
 
RGBEXCEL: AN RGB IMAGE DATA EXTRACTOR AND EXPORTER FOR EXCEL PROCESSING
RGBEXCEL: AN RGB IMAGE DATA EXTRACTOR AND EXPORTER FOR EXCEL PROCESSINGRGBEXCEL: AN RGB IMAGE DATA EXTRACTOR AND EXPORTER FOR EXCEL PROCESSING
RGBEXCEL: AN RGB IMAGE DATA EXTRACTOR AND EXPORTER FOR EXCEL PROCESSING
 
Minor Project Synopsis on Data Structure Visualizer
Minor Project Synopsis on Data Structure VisualizerMinor Project Synopsis on Data Structure Visualizer
Minor Project Synopsis on Data Structure Visualizer
 
Data Science: A Revolution of Data
Data Science: A Revolution of DataData Science: A Revolution of Data
Data Science: A Revolution of Data
 
COMPARATIVE ANALYSIS OF DIFFERENT MACHINE LEARNING ALGORITHMS FOR PLANT DISEA...
COMPARATIVE ANALYSIS OF DIFFERENT MACHINE LEARNING ALGORITHMS FOR PLANT DISEA...COMPARATIVE ANALYSIS OF DIFFERENT MACHINE LEARNING ALGORITHMS FOR PLANT DISEA...
COMPARATIVE ANALYSIS OF DIFFERENT MACHINE LEARNING ALGORITHMS FOR PLANT DISEA...
 
Search engine based on image and name for campus
Search engine based on image and name for campusSearch engine based on image and name for campus
Search engine based on image and name for campus
 
Ems
EmsEms
Ems
 
Virtual Research Environment for Cancer Imaging
Virtual Research Environment for Cancer ImagingVirtual Research Environment for Cancer Imaging
Virtual Research Environment for Cancer Imaging
 
Tools for Unstructured Data Analytics
Tools for Unstructured Data AnalyticsTools for Unstructured Data Analytics
Tools for Unstructured Data Analytics
 
Spreadsheet Software Market
Spreadsheet Software MarketSpreadsheet Software Market
Spreadsheet Software Market
 
Efficiency and Effectiveness: Shared services to support STEM subjects
Efficiency and Effectiveness: Shared services to support STEM subjectsEfficiency and Effectiveness: Shared services to support STEM subjects
Efficiency and Effectiveness: Shared services to support STEM subjects
 

Diedrich Free Research Systems

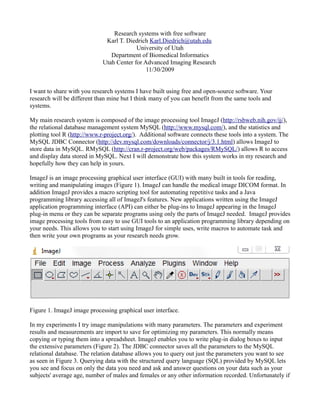
  • 1. Research systems with free software Karl T. Diedrich Karl.Diedrich@utah.edu University of Utah Department of Biomedical Informatics Utah Center for Advanced Imaging Research 11/30/2009 I want to share with you research systems I have built using free and open-source software. Your research will be different than mine but I think many of you can benefit from the same tools and systems. My main research system is composed of the image processing tool ImageJ (http://rsbweb.nih.gov/ij/), the relational database management system MySQL (http://www.mysql.com/), and the statistics and plotting tool R (http://www.r-project.org/). Additional software connects these tools into a system. The MySQL JDBC Connector (http://dev.mysql.com/downloads/connector/j/3.1.html) allows ImageJ to store data in MySQL. RMySQL (http://cran.r-project.org/web/packages/RMySQL/) allows R to access and display data stored in MySQL. Next I will demonstrate how this system works in my research and hopefully how they can help in yours. ImageJ is an image processing graphical user interface (GUI) with many built in tools for reading, writing and manipulating images (Figure 1). ImageJ can handle the medical image DICOM format. In addition ImageJ provides a macro scripting tool for automating repetitive tasks and a Java programming library accessing all of ImageJ's features. New applications written using the ImageJ application programming interface (API) can either be plug-ins to ImageJ appearing in the ImageJ plug-in menu or they can be separate programs using only the parts of ImageJ needed. ImageJ provides image processing tools from easy to use GUI tools to an application programming library depending on your needs. This allows you to start using ImageJ for simple uses, write macros to automate task and then write your own programs as your research needs grow. Figure 1. ImageJ image processing graphical user interface. In my experiments I try image manipulations with many parameters. The parameters and experiment results and measurements are import to save for optimizing my parameters. This normally means copying or typing them into a spreadsheet. ImageJ enables you to write plug-in dialog boxes to input the extensive parameters (Figure 2). The JDBC connector saves all the parameters to the MySQL relational database. The relation database allows you to query out just the parameters you want to see as seen in Figure 3. Querying data with the structured query language (SQL) provided by MySQL lets you see and focus on only the data you need and ask and answer questions on your data such as your subjects' average age, number of males and females or any other information recorded. Unfortunately if
  • 2. the data wasn't put in the database you cannot query the information out. So when developing a database application I try to record everything including were the mouse was clicked on images. I will talk more on this level of detailed record keeping later. Figure 2. Program parameters Figure 3. Querying only the desired parameters from the database. With ImageJ I was able to develop plug-ins that interact with the images. The ends of white line in the image below (Figure 4) were selected on the image with mouse clicks. The ImageJ plug-ins measures the twistedness of the line and radius of the artery at each point along the white line (Figure 5). I want to save the end points of the white measurement line. The important point to take home is there is a vast amount of data to save per study subject and the database keeps all the data in an accessible format.
  • 3. Figure 4. Image measurements. Figure 5. Measurements are recorded to the database.
  • 4. The database and SQL make it easy to get all the recorded data back in endless columns of data. To make sense of the data import the data into the into the statistics tool called R. R provides full statistical analysis tools and publication quality graph and plot production tools. Some examples are shown below (Figure 6). The RMyQSL package to R directly connects R to MySQL to create plots those in the images below in one step. Figure 6. Statistical analysis plotting and graphing with R. The free software tools ImageJ, MySQL and R can be chained into a research data recording and graphical analysis system. There are several advantages to the system being built with free software. First it's free, you don't have to pay from the software this becomes even more important than at first thought when you want to run the software on multiple computers. These software packages are also open-source. This is important because they have been compiled for almost every operating system including Microsoft Windows, Apple Mac and Linux. This means you can have the same system on a Windows desktop computer, a Mac laptop for demonstrating your systems and research and the Linux server at the University of Utah Center for High Performance Computing for heavy duty computation. You can distribute your system to users without their buying a license or run on multiple processors to speed processing times without worrying about having enough licenses.