![PAGE 2 Irving Park Elementary
SAFE, ORDERLY AND HIGH STUDENT PERFORMANCE, CONTINUED
CARING SCHOOLS School Performance
Each year, schools in North Carolina may receive several designations based on their performance
School Safety on the state's ABCs tests. These designations are awarded on the basis of the percentage of
The number of acts of crime or students performing at grade level and on whether students have learned as much as they are
violence reported below includes all expected to learn in one year. The designations earned by your school are displayed below,
followed by a brief description of each designation.
Our Schoolʼs Designation(s): School of Progress, Expected Growth
acts occurring in school, at a bus
stop, on a school bus, on school
grounds, or during off-campus,
school-sponsored activities. GROWTH: PERCENT OF SCHOOLS
DESIGNATION PERFORMANCE: LEARNING ACHIEVED WITH DESIGNATION
High Expected Expected
STUDENTS PERFORMING AT GRADE LEVEL IN ONE YEAR
Out of 691 students in our
Growth Growth Growth Not
Achieved
school, there were a total of 0 DISTRICT STATE
act[s] of crime or violence.
HONOR SCHOOL At least 90% of students at grade level and the
OF EXCELLENCE school made adequate yearly progress (AYP) 8% 5%
The number of acts of crime or SCHOOL OF EXCELLENCE At least 90% of students at grade level 0% 0%
violence reported per 100 students: SCHOOL OF DISTINCTION At least 80% of students at grade level 18% 22%
SCHOOL OF PROGRESS At least 60% of students at grade level 35% 49%
OUR SCHOOL 0 NO RECOGNITION 60 to 100% of students at grade level 3% 5%
DISTRICT 1 PRIORITY SCHOOL 50 to 60% of students at grade level, OR
27% 17%
Less than 50% of students at grade level
STATE 1
LOW PERFORMING Less than 50% of students at grade level 9% 3%
Access to Technology Adequate Yearly Progress (AYP) Results
In any group where the percentage of students
Percentage of classrooms North Carolina has set target goals that schools at a grade level is greater than 95% or less
connected to the Internet must meet to make Adequate Yearly Progress than 5%, the actual values are not displayed
(AYP) under the federal No Child Left Behind (NCLB). because of federal privacy regulations. In
100.0% 99.5% 99.3%
100% Our school did not make adequate yearly these cases the results are shown as 95%
progress. or 5% for the group.
80%
Our school met 24 out of 25 AYP targets.
60%
40% QUALITY TEACHERS
20%
Total Number Fully Classes Taught by Teachers National Years of Teaching Experience Teacher
0–3 4–10 10+
0% of Classroom Licensed Highly Qualified with Board Turnover
years years years
Our District State Teachers* Teachers Teachers Advanced Certified Rate
School Degrees Teachers*
Our School 45 100% 100% 33% 5 20% 29% 51% 10%
District 38 97% 100% 24% 5 24% 28% 48% 11%
Keeping you informed State 37 98% 100% 27% 5 23% 30% 47% 12%
More information about your * The total number of teachers in this school and the average number of teachers in schools with similar grade ranges at the district
and state level.
school is available on the NC
School Report Cards website at:
http://www.ncreportcards.org Public Schools of North Carolina
State Board of Education | Department of Public Instruction](data:image/gif;base64,R0lGODlhAQABAIAAAAAAAP///yH5BAEAAAAALAAAAAABAAEAAAIBRAA7)
Recommended
Recommended
More Related Content
Similar to Irving Park School Report Card
Similar to Irving Park School Report Card (20)
More from Trevor Davenport
More from Trevor Davenport (6)
Recently uploaded
Recently uploaded (20)
Irving Park School Report Card
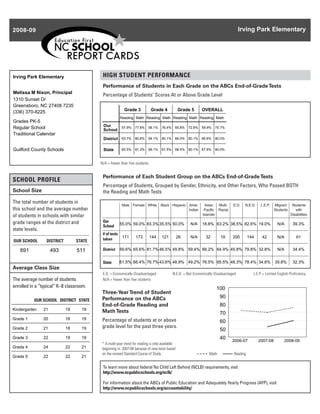
- 1. 2008-09 Irving Park Elementary Irving Park Elementary HIGH STUDENT PERFORMANCE Performance of Students in Each Grade on the ABCs End-of-Grade Tests Melissa M Nixon, Principal Percentage of Students’ Scores At or Above Grade Level 1310 Sunset Dr Greensboro, NC 27408 7235 Grade 3 Grade 4 Grade 5 OVERALL (336) 370-8225 Reading Math Reading Math Reading Math Reading Math Grades PK-5 Our Regular School School 57.9% 77.8% 56.1% 76.4% 65.8% 72.8% 59.9% 75.7% Traditional Calendar District 63.7% 80.6% 64.1% 80.1% 66.0% 80.1% 65.6% 80.0% Guilford County Schools State 65.5% 81.3% 69.1% 81.5% 68.5% 80.1% 67.6% 80.0% N/A = Fewer than five students Performance of Each Student Group on the ABCs End-of-Grade Tests SCHOOL PROFILE Percentage of Students, Grouped by Gender, Ethnicity, and Other Factors, Who Passed BOTH School Size the Reading and Math Tests Male Female White Black Hispanic Amer. Asian Multi- E.D. N.E.D. L.E.P. Migrant Students The total number of students in this school and the average number Indian Pacific Racial Students with of students in schools with similar Islander Disabilities grade ranges at the district and Our 55.0% 59.0% 83.3% 35.5% 50.0% N/A 18.8% 63.2% 38.5% 82.6% 19.0% N/A 39.3% School state levels. # of tests 171 173 144 121 26 N/A 32 19 200 144 42 N/A 61 OUR SCHOOL DISTRICT STATE taken 691 493 511 District 59.6% 65.6% 81.7% 46.5% 49.8% 59.4% 66.2% 64.9% 45.8% 79.8% 32.8% N/A 34.4% State 61.5% 66.4% 76.7% 43.6% 48.9% 49.2% 76.5% 65.5% 48.3% 78.4% 34.6% 35.8% 32.3% Average Class Size E.D. = Economically Disadvantaged N.E.D. = Not Economically Disadvantaged L.E.P. = Limited English Proficiency The average number of students N/A = Fewer than five students enrolled in a “typical” K–8 classroom. 100 Three-Year Trend of Student Performance on the ABCs 90 OUR SCHOOL DISTRICT STATE End-of-Grade Reading and 80 Kindergarten 21 18 19 Math Tests 70 Grade 1 20 18 19 Percentage of students at or above 60 Grade 2 21 18 19 grade level for the past three years. 50 Grade 3 22 19 19 40 2006-07 2007-08 2008-09 * A multi-year trend for reading is only available Grade 4 24 22 21 beginning in 2007-08 because of new tests based on the revised Standard Course of Study. Math Reading Grade 5 22 22 21 To learn more about federal No Child Left Behind (NCLB) requirements, visit http://www.ncpublicschools.org/nclb/ For information about the ABCs of Public Education and Adequately Yearly Progress (AYP), visit http://www.ncpublicschools.org/accountability/
- 2. PAGE 2 Irving Park Elementary SAFE, ORDERLY AND HIGH STUDENT PERFORMANCE, CONTINUED CARING SCHOOLS School Performance Each year, schools in North Carolina may receive several designations based on their performance School Safety on the state's ABCs tests. These designations are awarded on the basis of the percentage of The number of acts of crime or students performing at grade level and on whether students have learned as much as they are violence reported below includes all expected to learn in one year. The designations earned by your school are displayed below, followed by a brief description of each designation. Our Schoolʼs Designation(s): School of Progress, Expected Growth acts occurring in school, at a bus stop, on a school bus, on school grounds, or during off-campus, school-sponsored activities. GROWTH: PERCENT OF SCHOOLS DESIGNATION PERFORMANCE: LEARNING ACHIEVED WITH DESIGNATION High Expected Expected STUDENTS PERFORMING AT GRADE LEVEL IN ONE YEAR Out of 691 students in our Growth Growth Growth Not Achieved school, there were a total of 0 DISTRICT STATE act[s] of crime or violence. HONOR SCHOOL At least 90% of students at grade level and the OF EXCELLENCE school made adequate yearly progress (AYP) 8% 5% The number of acts of crime or SCHOOL OF EXCELLENCE At least 90% of students at grade level 0% 0% violence reported per 100 students: SCHOOL OF DISTINCTION At least 80% of students at grade level 18% 22% SCHOOL OF PROGRESS At least 60% of students at grade level 35% 49% OUR SCHOOL 0 NO RECOGNITION 60 to 100% of students at grade level 3% 5% DISTRICT 1 PRIORITY SCHOOL 50 to 60% of students at grade level, OR 27% 17% Less than 50% of students at grade level STATE 1 LOW PERFORMING Less than 50% of students at grade level 9% 3% Access to Technology Adequate Yearly Progress (AYP) Results In any group where the percentage of students Percentage of classrooms North Carolina has set target goals that schools at a grade level is greater than 95% or less connected to the Internet must meet to make Adequate Yearly Progress than 5%, the actual values are not displayed (AYP) under the federal No Child Left Behind (NCLB). because of federal privacy regulations. In 100.0% 99.5% 99.3% 100% Our school did not make adequate yearly these cases the results are shown as 95% progress. or 5% for the group. 80% Our school met 24 out of 25 AYP targets. 60% 40% QUALITY TEACHERS 20% Total Number Fully Classes Taught by Teachers National Years of Teaching Experience Teacher 0–3 4–10 10+ 0% of Classroom Licensed Highly Qualified with Board Turnover years years years Our District State Teachers* Teachers Teachers Advanced Certified Rate School Degrees Teachers* Our School 45 100% 100% 33% 5 20% 29% 51% 10% District 38 97% 100% 24% 5 24% 28% 48% 11% Keeping you informed State 37 98% 100% 27% 5 23% 30% 47% 12% More information about your * The total number of teachers in this school and the average number of teachers in schools with similar grade ranges at the district and state level. school is available on the NC School Report Cards website at: http://www.ncreportcards.org Public Schools of North Carolina State Board of Education | Department of Public Instruction