SlideShare a Scribd company logo
1 of 2
Download to read offline
Vol. 10, No. 146 / July 30, 2012

Market Comments                                                                                                        December 2012 Corn Futures

Feed crisis deepens:

Corn futures were sharply higher in overnight trading and as of
the writing of this report, September corn futures were at an all
time record high of $8.20/bushel, 22 cents higher than the previous
close. Similarly, the benchmark December 2012 corn futures con-
tract was priced at $8.16/bushel, 22.75 cents higher than the pre-
vious close. Limited rainfall overall the weekend and the prospect
of ongoing drought conditions across much of the US corn belt and
the Greta Plains has caused farmers and market analysts alike to
lower their expectations about the potential of the current corn
and soybean crops. Some estimates now openly pegging the ex-
pected average yield of the US corn crop below 130 bushels per
acre with one well followed firm indicating yields could be in the
low 120s. Also dramatic will be the impact of the drought on the
number of harvested acres. As we noted in our reports in early
July, previous drought impacts have significantly reduced the                                                             US Seasonal Drought Outlook: Valid for July 19 - October 31, NOAA
number of acres harvested for grain. In addition to lower yields,
we could a decline of about 3 million harvested acres from previous
estimates. Yields in the 120s and lower harvested acres would
imply even more significant reductions in US feed use in order to
ration the available supply. A big wild card at this point is the
position of the EPA with regard to the ethanol mandate. At what
point does the impact of high feed costs on livestock producers be-
comes high enough to warrant a temporary waiver of the man-
date? In some areas livestock production has been tenuous enough
that the current feed crisis could lead to thousands of family farms
getting out of business. This kind of structural change would have
long lasting repercussions for US meat production going forward.
It is a political decision that becomes even more complicated in a
presidential election year.

Meat supply update

Combined red meat and poultry production for the week ending
July 28 was 1.703 billion pounds, 0.7% higher than a year ago.
Beef supplies remain limited but some of the dramatic reductions
in slaughter numbers have been offset by heavier cattle coming to
market. Dressed cattle weights are currently some 2.5% above
year ago levels. As packers slow down slaughter in an effort to                                                           year go. Hog weights also quoted by USDA some 2% above year
bring a margin back in their business, cattle on feed are tacking on                                                      ago levels but that number appears to be overstated and will
more pounds, with steer and heifer weights sharply higher than a                                                          likely be revised lower. Full supply details on page 2.


     The Daily Livestock Report is published by Steve Meyer and Len Steiner. To subscribe/unsubscribe visit www.dailylivestockreport.com.
     Disclaimer: The Daily Livestock Report is intended solely for information purposes and is not to be construed, under any circumstances, by implication or otherwise, as an offer to sell or a solicitation to buy or trade any
     commodities or securities whatsoever. Information is obtained from sources believed to be reliable, but is in no way guaranteed. No guarantee of any kind is implied or possible where projections of future conditions are
     attempted. Futures trading is not suitable for all investors, and involves the risk of loss. Past results are no indication of future performance. Futures are a leveraged investment, and because only a percentage of a con-
     tract’s value is require to trade, it is possible to lose more than the amount of money initially deposited for a futures position. Therefore, traders should only use funds that they can afford to lose without affecting their life-
     style. And only a portion of those funds should be devoted to any one trade because a trader cannot expect to profit on every trade.


     CME Group is the trademark of CME Group, Inc. The Globe logo, Globex® and CME® are trademarks of Chicago Mercantile Exchange, Inc. CBOT® is the trademark of the Board of Trade of the City of Chicago. NYMEX,
     New York Mercantile Exchange, and ClearPort are trademarks of New York Mercantile Exchange. Inc. COMEX is a trademark of Commodity Exchange, Inc. Copyright © 2011 CME Group. All rights reserved.
Page 2


                                                                                                                   Vol. 10, No. 146 / July 30, 2012


PRODUCTION & PRICE SUMMARY                                                                                 Week Ending                   7/28/2012
                                                            Current                       Pct.                        Pct.                  Y/Y %
     Item                              Units                  Week Last Week            Change     Last Year        Change        YTD      Change
                                                            28-Jul-12    21-Jul-12                     30-Jul-11


     Total Red Meat & Poultry          mil lbs., cwe            1,703        1,671        1.90%           1,691       0.73%     49,506       10.5%

     FI Slaughter                      Thou. Head                637           654       -2.60%             665      -4.22%     18,589       -4.3%
 C   FI Cow Slaughter **               Thou. Head                125           101       23.90%             130      -3.75%      3,313       -3.4%
 A   Avg. Live Weight                  Lbs.                     1297          1304       -0.54%            1268       2.29%      1,296        1.7%
 T   Avg. Dressed Weight               Lbs.                      793           793        0.00%             774       2.45%        786        2.0%
 T   Beef Production                   Million Lbs.            504.4         518.0       -2.63%           513.2      -1.71%     14,576       -2.2%
 L   Live Fed Steer Price              $ per cwt              113.93        112.90        0.91%          108.57       4.94%
 E   Dressed Fed Steer Price           $ per cwt              180.13        178.88        0.70%          174.48       3.24%
     OKC Feeder Steer, 600-700         $ per cwt                 N/A           N/A          N/A          139.17         N/A
 &   Choice Beef Cutout                $ per cwt              178.06        182.07       -2.20%          175.04       1.73%
     Hide/Offal                        $ per cwt, live wt      13.32         13.28        0.30%           13.67      -2.56%
 B   Rib, Choice                       $ per cwt              263.64        270.42       -2.51%          244.93       7.64%
 E   Round, Choice                     $ per cwt              158.05        158.27       -0.14%          150.88       4.75%
 E   Chuck, Choice                     $ per cwt              139.94        141.72       -1.26%          140.37      -0.31%
 F   Trimmings, 50%                    $ per cwt               45.85         47.80       -4.08%           77.73     -41.01%
     Trimmings, 90%                    $ per cwt              208.75        214.87       -2.85%          181.34      15.12%
     FI Slaughter                      Thou. Head              2,003         1,961        2.14%           1,989       0.68%     62,015        1.2%
     FI Sow Slaughter **               Thou. Head               57.7          43.2       33.42%            56.1       2.83%      1,551       -2.1%
 H   Avg. Dressed Weight               Lbs.                    203.0         203.0        0.00%           199.0       2.01%        207        0.4%
 O   Pork Production                   Million Lbs.            405.3         398.5        1.71%           396.4       2.25%     12,853        1.7%
 G   Iowa-S. Minn. Direct              Wtd. Avg.               94.45         94.40        0.05%          100.89      -6.38%
 S   Natl. Base Carcass Price          Wtd. Avg.               93.10         92.67        0.46%           95.49      -2.50%
     Natl. Net Carcass Price           Wtd. Avg.               95.57         95.23        0.36%           98.62      -3.09%
     Pork Cutout                       185 Lbs.                92.27         90.33        2.15%          102.55     -10.02%
     Hams                              $ per cwt               74.46         73.24        1.67%           81.60      -8.75%
     Loins                             $ per cwt              104.00        101.09        2.88%          122.07     -14.80%
     Bellies                           $ per cwt              139.54        134.90        3.44%          142.47      -2.06%
 C   Young Chicken Slaughter *         Million Head            158.7         156.3        1.51%           160.5      -1.15%      4,404       -4.9%
 H   Avg. Weight (Live)                Lbs.                     5.67          5.56        1.98%            5.66       0.18%       5.72       -0.2%
 I   Chicken Production (RTC)          Million Lbs.            679.2         656.1        3.51%           676.8       0.36%     18,968       -4.0%
 C   Eggs Set                          Million                 195.2         195.8       -0.32%           195.1       0.02%      5,714       -3.8%
 K   Chicks Placed                     Million Head            163.1         162.9        0.14%           162.8       0.17%      4,763       -3.2%
 E   12-City Broiler Price             Composite               81.89         83.92       -2.42%           79.78       2.64%
 N   Georgia Dock Broiler Price        2.5-3 Lbs.              93.88         93.92       -0.04%           86.02       9.14%
     Northeast Breast, B/S             $/cwt                  139.11        137.92        0.86%          116.95      18.95%
     Northeast Legs                    $/cwt                    63.5         61.99        2.44%           63.21       0.46%
 T   Young Turkey Slaughter *          Million Head            4.735         4.253       11.33%           4.544       4.20%    126.654       -0.5%
 U   Avg. Live Weight                  Lbs.                    30.16         29.01        3.96%           28.71       5.05%      30.11        0.0%
 R   Turkey Production (RTC)           Million Lbs.            114.2          98.7       15.76%           104.3       9.46%      3,110        1.8%
 K   Eastern Region Hen Price          8-16 Lbs.              107.50        106.50        0.94%          104.00       3.37%
 G   Corn, Omaha                       $ per Bushel             7.78          8.12       -4.19%            7.24       7.46%
 R   DDGs, Minnesota                   $ per Ton              287.50        272.50        5.50%          182.50      57.53%
 A   Wheat, Kansas City                $ per Bushel             8.78          9.13       -3.83%            7.47      17.54%
 I   Soybeans, S. Iowa                 $ per Bushel            17.01         17.96       -5.29%           13.83      22.99%
 N   Soybn Meal, 48% Decatur           $ per Ton              553.30        551.00        0.42%          347.80      59.09%
* Chicken & turkey slaughter & production are 1 week earlier than the date at the top of this sheet.
** Cow and sow slaughter reflect levels from two weeks ago due to reporting lag.

More Related Content

Viewers also liked

Cupos dispmaty prod2012i
Cupos dispmaty prod2012iCupos dispmaty prod2012i
Cupos dispmaty prod2012iCEDCyT
 
Ikea store opening_award_2011
Ikea store opening_award_2011Ikea store opening_award_2011
Ikea store opening_award_2011Saif Islam
 
Notas i periodo informatica grado 9 año lectivo 2012 facebook
Notas i periodo informatica grado 9 año lectivo 2012 facebookNotas i periodo informatica grado 9 año lectivo 2012 facebook
Notas i periodo informatica grado 9 año lectivo 2012 facebookmirella
 
Mah ads 006 001
Mah ads 006 001Mah ads 006 001
Mah ads 006 001akosicha
 
Letter of reccomendation_MC
Letter of reccomendation_MCLetter of reccomendation_MC
Letter of reccomendation_MCKelly Martins
 
Claudia SELARU_PD Certificate
Claudia SELARU_PD CertificateClaudia SELARU_PD Certificate
Claudia SELARU_PD CertificateClaudia Selaru
 
La computadora (2) (2)
La computadora  (2) (2)La computadora  (2) (2)
La computadora (2) (2)ariana110494
 
Client - Craig Lack - Performance Based Health Plans
Client - Craig Lack - Performance Based Health PlansClient - Craig Lack - Performance Based Health Plans
Client - Craig Lack - Performance Based Health PlansTR Garland
 
SPE WA_Kalra (1)
SPE WA_Kalra (1)SPE WA_Kalra (1)
SPE WA_Kalra (1)ANKIT KALRA
 
Client - Craig Lack - Performance Based Health Plans
Client - Craig Lack - Performance Based Health PlansClient - Craig Lack - Performance Based Health Plans
Client - Craig Lack - Performance Based Health PlansTR Garland
 
Recursos exposició oral
Recursos exposició oralRecursos exposició oral
Recursos exposició oralescolasonferrer
 
Tpn°1 TIC II Ley Sopa
Tpn°1  TIC II Ley SopaTpn°1  TIC II Ley Sopa
Tpn°1 TIC II Ley Sopapomelo2
 

Viewers also liked (20)

Cupos dispmaty prod2012i
Cupos dispmaty prod2012iCupos dispmaty prod2012i
Cupos dispmaty prod2012i
 
Doc1
Doc1Doc1
Doc1
 
Preguntas sheyla lunes
Preguntas sheyla lunesPreguntas sheyla lunes
Preguntas sheyla lunes
 
Ikea store opening_award_2011
Ikea store opening_award_2011Ikea store opening_award_2011
Ikea store opening_award_2011
 
Notas i periodo informatica grado 9 año lectivo 2012 facebook
Notas i periodo informatica grado 9 año lectivo 2012 facebookNotas i periodo informatica grado 9 año lectivo 2012 facebook
Notas i periodo informatica grado 9 año lectivo 2012 facebook
 
Mah ads 006 001
Mah ads 006 001Mah ads 006 001
Mah ads 006 001
 
Victoria humerez
Victoria humerezVictoria humerez
Victoria humerez
 
AIM RBI FFS & NDE
AIM RBI FFS & NDEAIM RBI FFS & NDE
AIM RBI FFS & NDE
 
Letter of reccomendation_MC
Letter of reccomendation_MCLetter of reccomendation_MC
Letter of reccomendation_MC
 
Claudia SELARU_PD Certificate
Claudia SELARU_PD CertificateClaudia SELARU_PD Certificate
Claudia SELARU_PD Certificate
 
La computadora (2) (2)
La computadora  (2) (2)La computadora  (2) (2)
La computadora (2) (2)
 
Client - Craig Lack - Performance Based Health Plans
Client - Craig Lack - Performance Based Health PlansClient - Craig Lack - Performance Based Health Plans
Client - Craig Lack - Performance Based Health Plans
 
Quero um emprego
Quero um empregoQuero um emprego
Quero um emprego
 
SPE WA_Kalra (1)
SPE WA_Kalra (1)SPE WA_Kalra (1)
SPE WA_Kalra (1)
 
Client - Craig Lack - Performance Based Health Plans
Client - Craig Lack - Performance Based Health PlansClient - Craig Lack - Performance Based Health Plans
Client - Craig Lack - Performance Based Health Plans
 
BSF2
BSF2BSF2
BSF2
 
Ttt
TttTtt
Ttt
 
Recursos exposició oral
Recursos exposició oralRecursos exposició oral
Recursos exposició oral
 
Texto coesão
Texto coesãoTexto coesão
Texto coesão
 
Tpn°1 TIC II Ley Sopa
Tpn°1  TIC II Ley SopaTpn°1  TIC II Ley Sopa
Tpn°1 TIC II Ley Sopa
 

Similar to December 2012 Corn Futures Rise Sharply

360° Benchmarking for Pork Production
360° Benchmarking for Pork Production360° Benchmarking for Pork Production
360° Benchmarking for Pork ProductionNational Pork Board
 
Dr. Mike Brumm - Impact of heavy swine market weights on facility and equipme...
Dr. Mike Brumm - Impact of heavy swine market weights on facility and equipme...Dr. Mike Brumm - Impact of heavy swine market weights on facility and equipme...
Dr. Mike Brumm - Impact of heavy swine market weights on facility and equipme...John Blue
 
Sweetener Colloquium.Grains & Oilseeds
Sweetener Colloquium.Grains & OilseedsSweetener Colloquium.Grains & Oilseeds
Sweetener Colloquium.Grains & OilseedsIntlFood
 
Dr. Kyle Coble - Introduction: How Do We Define Wean Age
Dr. Kyle Coble - Introduction: How Do We Define Wean AgeDr. Kyle Coble - Introduction: How Do We Define Wean Age
Dr. Kyle Coble - Introduction: How Do We Define Wean AgeJohn Blue
 
Inflation Watch: March 2012
Inflation Watch: March 2012Inflation Watch: March 2012
Inflation Watch: March 2012REALTORS
 
Dr. Steve Meyer - Market & Grain Outlook
Dr. Steve Meyer - Market & Grain OutlookDr. Steve Meyer - Market & Grain Outlook
Dr. Steve Meyer - Market & Grain OutlookJohn Blue
 
Inflation Watch: January 2012
Inflation Watch: January 2012Inflation Watch: January 2012
Inflation Watch: January 2012REALTORS
 
Tyson Q1 09 financial results
Tyson Q1 09 financial resultsTyson Q1 09 financial results
Tyson Q1 09 financial resultsearningsreport
 
101842285 july-2012-rebgv-stats-package-adam-scalena
101842285 july-2012-rebgv-stats-package-adam-scalena101842285 july-2012-rebgv-stats-package-adam-scalena
101842285 july-2012-rebgv-stats-package-adam-scalenavancouverhomesteam
 
Felmy api 2010
Felmy api 2010Felmy api 2010
Felmy api 2010Ngy Ea
 
10.3 2016 investor presentation pea
10.3 2016 investor presentation   pea10.3 2016 investor presentation   pea
10.3 2016 investor presentation peaFalcoCorporate
 
Palm Springs Area Listings Sold By Calendar Quarter (Through March 2010)
Palm Springs Area Listings Sold By Calendar Quarter (Through March 2010)Palm Springs Area Listings Sold By Calendar Quarter (Through March 2010)
Palm Springs Area Listings Sold By Calendar Quarter (Through March 2010)SDM: Music Venture
 
Daily livestock report sep 10 2012
Daily livestock report sep 10 2012Daily livestock report sep 10 2012
Daily livestock report sep 10 2012joseleorcasita
 
Daily livestock report sep 10 2012
Daily livestock report sep 10 2012Daily livestock report sep 10 2012
Daily livestock report sep 10 2012joseleorcasita
 
Dr. Joel DeRouchey - Managing High Feed Costs
Dr. Joel DeRouchey - Managing High Feed CostsDr. Joel DeRouchey - Managing High Feed Costs
Dr. Joel DeRouchey - Managing High Feed CostsJohn Blue
 
Dr. Steve Pollmann - Sow lifetime productivity: Importance of monitoring in c...
Dr. Steve Pollmann - Sow lifetime productivity: Importance of monitoring in c...Dr. Steve Pollmann - Sow lifetime productivity: Importance of monitoring in c...
Dr. Steve Pollmann - Sow lifetime productivity: Importance of monitoring in c...John Blue
 
Brunswick (BC) Pitch - Jonathan Chang - FINAL COPY
Brunswick (BC) Pitch - Jonathan Chang - FINAL COPYBrunswick (BC) Pitch - Jonathan Chang - FINAL COPY
Brunswick (BC) Pitch - Jonathan Chang - FINAL COPYJonathan Chang
 

Similar to December 2012 Corn Futures Rise Sharply (20)

360° Benchmarking for Pork Production
360° Benchmarking for Pork Production360° Benchmarking for Pork Production
360° Benchmarking for Pork Production
 
Dr. Mike Brumm - Impact of heavy swine market weights on facility and equipme...
Dr. Mike Brumm - Impact of heavy swine market weights on facility and equipme...Dr. Mike Brumm - Impact of heavy swine market weights on facility and equipme...
Dr. Mike Brumm - Impact of heavy swine market weights on facility and equipme...
 
Sweetener Colloquium.Grains & Oilseeds
Sweetener Colloquium.Grains & OilseedsSweetener Colloquium.Grains & Oilseeds
Sweetener Colloquium.Grains & Oilseeds
 
1. 2020 Commodity Outlook
1. 2020 Commodity Outlook1. 2020 Commodity Outlook
1. 2020 Commodity Outlook
 
Dr. Kyle Coble - Introduction: How Do We Define Wean Age
Dr. Kyle Coble - Introduction: How Do We Define Wean AgeDr. Kyle Coble - Introduction: How Do We Define Wean Age
Dr. Kyle Coble - Introduction: How Do We Define Wean Age
 
Inflation Watch: March 2012
Inflation Watch: March 2012Inflation Watch: March 2012
Inflation Watch: March 2012
 
Dr. Steve Meyer - Market & Grain Outlook
Dr. Steve Meyer - Market & Grain OutlookDr. Steve Meyer - Market & Grain Outlook
Dr. Steve Meyer - Market & Grain Outlook
 
Houston Market Report July 2010
Houston Market Report July 2010Houston Market Report July 2010
Houston Market Report July 2010
 
Inflation Watch: January 2012
Inflation Watch: January 2012Inflation Watch: January 2012
Inflation Watch: January 2012
 
Tyson Q1 09 financial results
Tyson Q1 09 financial resultsTyson Q1 09 financial results
Tyson Q1 09 financial results
 
101842285 july-2012-rebgv-stats-package-adam-scalena
101842285 july-2012-rebgv-stats-package-adam-scalena101842285 july-2012-rebgv-stats-package-adam-scalena
101842285 july-2012-rebgv-stats-package-adam-scalena
 
Felmy api 2010
Felmy api 2010Felmy api 2010
Felmy api 2010
 
10.3 2016 investor presentation pea
10.3 2016 investor presentation   pea10.3 2016 investor presentation   pea
10.3 2016 investor presentation pea
 
Palm Springs Area Listings Sold By Calendar Quarter (Through March 2010)
Palm Springs Area Listings Sold By Calendar Quarter (Through March 2010)Palm Springs Area Listings Sold By Calendar Quarter (Through March 2010)
Palm Springs Area Listings Sold By Calendar Quarter (Through March 2010)
 
Daily livestock report sep 10 2012
Daily livestock report sep 10 2012Daily livestock report sep 10 2012
Daily livestock report sep 10 2012
 
Daily livestock report sep 10 2012
Daily livestock report sep 10 2012Daily livestock report sep 10 2012
Daily livestock report sep 10 2012
 
Dr. Joel DeRouchey - Managing High Feed Costs
Dr. Joel DeRouchey - Managing High Feed CostsDr. Joel DeRouchey - Managing High Feed Costs
Dr. Joel DeRouchey - Managing High Feed Costs
 
Dr. Steve Pollmann - Sow lifetime productivity: Importance of monitoring in c...
Dr. Steve Pollmann - Sow lifetime productivity: Importance of monitoring in c...Dr. Steve Pollmann - Sow lifetime productivity: Importance of monitoring in c...
Dr. Steve Pollmann - Sow lifetime productivity: Importance of monitoring in c...
 
Brunswick (BC) Pitch - Jonathan Chang - FINAL COPY
Brunswick (BC) Pitch - Jonathan Chang - FINAL COPYBrunswick (BC) Pitch - Jonathan Chang - FINAL COPY
Brunswick (BC) Pitch - Jonathan Chang - FINAL COPY
 
REBGV Stats Package Oct 2012
REBGV Stats Package Oct 2012REBGV Stats Package Oct 2012
REBGV Stats Package Oct 2012
 

More from joseleorcasita

Inac boletin semanal 24082013
Inac boletin semanal 24082013Inac boletin semanal 24082013
Inac boletin semanal 24082013joseleorcasita
 
Bcr boletin informativo 23082013
Bcr boletin informativo 23082013Bcr boletin informativo 23082013
Bcr boletin informativo 23082013joseleorcasita
 
Bcr informativo semanal 19042013
Bcr informativo semanal 19042013Bcr informativo semanal 19042013
Bcr informativo semanal 19042013joseleorcasita
 
Inac boletin semanal 13042013
Inac boletin semanal 13042013Inac boletin semanal 13042013
Inac boletin semanal 13042013joseleorcasita
 
Daily livestock report apr 19 2013
Daily livestock report apr 19 2013Daily livestock report apr 19 2013
Daily livestock report apr 19 2013joseleorcasita
 
Daily livestock report apr 18 2013
Daily livestock report apr 18 2013Daily livestock report apr 18 2013
Daily livestock report apr 18 2013joseleorcasita
 
Daily livestock report apr 17 2013
Daily livestock report apr 17 2013Daily livestock report apr 17 2013
Daily livestock report apr 17 2013joseleorcasita
 
Daily livestock report apr 16 2013
Daily livestock report apr 16 2013Daily livestock report apr 16 2013
Daily livestock report apr 16 2013joseleorcasita
 
Daily livestock report apr 15 2013
Daily livestock report apr 15 2013Daily livestock report apr 15 2013
Daily livestock report apr 15 2013joseleorcasita
 
Usda report april 2013
Usda report april 2013Usda report april 2013
Usda report april 2013joseleorcasita
 
Daily livestock report apr 12 2013
Daily livestock report apr 12 2013Daily livestock report apr 12 2013
Daily livestock report apr 12 2013joseleorcasita
 
Daily livestock report apr 11 2013
Daily livestock report apr 11 2013Daily livestock report apr 11 2013
Daily livestock report apr 11 2013joseleorcasita
 
Daily livestock report apr 10 2013
Daily livestock report apr 10 2013Daily livestock report apr 10 2013
Daily livestock report apr 10 2013joseleorcasita
 

More from joseleorcasita (20)

Bcr boletin 06092013
Bcr boletin 06092013Bcr boletin 06092013
Bcr boletin 06092013
 
Inac boletin 31082013
Inac boletin 31082013Inac boletin 31082013
Inac boletin 31082013
 
Boletim do leite 221
Boletim do leite 221Boletim do leite 221
Boletim do leite 221
 
Boletim do leite 220
Boletim do leite 220Boletim do leite 220
Boletim do leite 220
 
Boletim do leite 219
Boletim do leite 219Boletim do leite 219
Boletim do leite 219
 
Boletim do leite 218
Boletim do leite 218Boletim do leite 218
Boletim do leite 218
 
Boletim do leite 217
Boletim do leite 217Boletim do leite 217
Boletim do leite 217
 
Inac boletin semanal 24082013
Inac boletin semanal 24082013Inac boletin semanal 24082013
Inac boletin semanal 24082013
 
Bcr boletin informativo 23082013
Bcr boletin informativo 23082013Bcr boletin informativo 23082013
Bcr boletin informativo 23082013
 
Bcr informativo semanal 19042013
Bcr informativo semanal 19042013Bcr informativo semanal 19042013
Bcr informativo semanal 19042013
 
Inac boletin semanal 13042013
Inac boletin semanal 13042013Inac boletin semanal 13042013
Inac boletin semanal 13042013
 
Daily livestock report apr 19 2013
Daily livestock report apr 19 2013Daily livestock report apr 19 2013
Daily livestock report apr 19 2013
 
Daily livestock report apr 18 2013
Daily livestock report apr 18 2013Daily livestock report apr 18 2013
Daily livestock report apr 18 2013
 
Daily livestock report apr 17 2013
Daily livestock report apr 17 2013Daily livestock report apr 17 2013
Daily livestock report apr 17 2013
 
Daily livestock report apr 16 2013
Daily livestock report apr 16 2013Daily livestock report apr 16 2013
Daily livestock report apr 16 2013
 
Daily livestock report apr 15 2013
Daily livestock report apr 15 2013Daily livestock report apr 15 2013
Daily livestock report apr 15 2013
 
Usda report april 2013
Usda report april 2013Usda report april 2013
Usda report april 2013
 
Daily livestock report apr 12 2013
Daily livestock report apr 12 2013Daily livestock report apr 12 2013
Daily livestock report apr 12 2013
 
Daily livestock report apr 11 2013
Daily livestock report apr 11 2013Daily livestock report apr 11 2013
Daily livestock report apr 11 2013
 
Daily livestock report apr 10 2013
Daily livestock report apr 10 2013Daily livestock report apr 10 2013
Daily livestock report apr 10 2013
 

December 2012 Corn Futures Rise Sharply

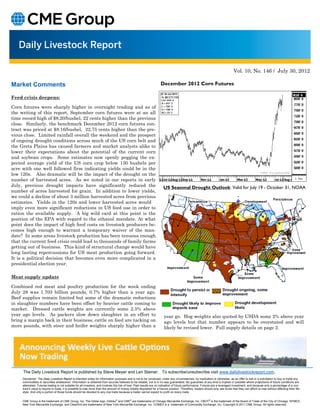
  • 1. Vol. 10, No. 146 / July 30, 2012 Market Comments December 2012 Corn Futures Feed crisis deepens: Corn futures were sharply higher in overnight trading and as of the writing of this report, September corn futures were at an all time record high of $8.20/bushel, 22 cents higher than the previous close. Similarly, the benchmark December 2012 corn futures con- tract was priced at $8.16/bushel, 22.75 cents higher than the pre- vious close. Limited rainfall overall the weekend and the prospect of ongoing drought conditions across much of the US corn belt and the Greta Plains has caused farmers and market analysts alike to lower their expectations about the potential of the current corn and soybean crops. Some estimates now openly pegging the ex- pected average yield of the US corn crop below 130 bushels per acre with one well followed firm indicating yields could be in the low 120s. Also dramatic will be the impact of the drought on the number of harvested acres. As we noted in our reports in early July, previous drought impacts have significantly reduced the US Seasonal Drought Outlook: Valid for July 19 - October 31, NOAA number of acres harvested for grain. In addition to lower yields, we could a decline of about 3 million harvested acres from previous estimates. Yields in the 120s and lower harvested acres would imply even more significant reductions in US feed use in order to ration the available supply. A big wild card at this point is the position of the EPA with regard to the ethanol mandate. At what point does the impact of high feed costs on livestock producers be- comes high enough to warrant a temporary waiver of the man- date? In some areas livestock production has been tenuous enough that the current feed crisis could lead to thousands of family farms getting out of business. This kind of structural change would have long lasting repercussions for US meat production going forward. It is a political decision that becomes even more complicated in a presidential election year. Meat supply update Combined red meat and poultry production for the week ending July 28 was 1.703 billion pounds, 0.7% higher than a year ago. Beef supplies remain limited but some of the dramatic reductions in slaughter numbers have been offset by heavier cattle coming to market. Dressed cattle weights are currently some 2.5% above year ago levels. As packers slow down slaughter in an effort to year go. Hog weights also quoted by USDA some 2% above year bring a margin back in their business, cattle on feed are tacking on ago levels but that number appears to be overstated and will more pounds, with steer and heifer weights sharply higher than a likely be revised lower. Full supply details on page 2. The Daily Livestock Report is published by Steve Meyer and Len Steiner. To subscribe/unsubscribe visit www.dailylivestockreport.com. Disclaimer: The Daily Livestock Report is intended solely for information purposes and is not to be construed, under any circumstances, by implication or otherwise, as an offer to sell or a solicitation to buy or trade any commodities or securities whatsoever. Information is obtained from sources believed to be reliable, but is in no way guaranteed. No guarantee of any kind is implied or possible where projections of future conditions are attempted. Futures trading is not suitable for all investors, and involves the risk of loss. Past results are no indication of future performance. Futures are a leveraged investment, and because only a percentage of a con- tract’s value is require to trade, it is possible to lose more than the amount of money initially deposited for a futures position. Therefore, traders should only use funds that they can afford to lose without affecting their life- style. And only a portion of those funds should be devoted to any one trade because a trader cannot expect to profit on every trade. CME Group is the trademark of CME Group, Inc. The Globe logo, Globex® and CME® are trademarks of Chicago Mercantile Exchange, Inc. CBOT® is the trademark of the Board of Trade of the City of Chicago. NYMEX, New York Mercantile Exchange, and ClearPort are trademarks of New York Mercantile Exchange. Inc. COMEX is a trademark of Commodity Exchange, Inc. Copyright © 2011 CME Group. All rights reserved.
  • 2. Page 2 Vol. 10, No. 146 / July 30, 2012 PRODUCTION & PRICE SUMMARY Week Ending 7/28/2012 Current Pct. Pct. Y/Y % Item Units Week Last Week Change Last Year Change YTD Change 28-Jul-12 21-Jul-12 30-Jul-11 Total Red Meat & Poultry mil lbs., cwe 1,703 1,671 1.90% 1,691 0.73% 49,506 10.5% FI Slaughter Thou. Head 637 654 -2.60% 665 -4.22% 18,589 -4.3% C FI Cow Slaughter ** Thou. Head 125 101 23.90% 130 -3.75% 3,313 -3.4% A Avg. Live Weight Lbs. 1297 1304 -0.54% 1268 2.29% 1,296 1.7% T Avg. Dressed Weight Lbs. 793 793 0.00% 774 2.45% 786 2.0% T Beef Production Million Lbs. 504.4 518.0 -2.63% 513.2 -1.71% 14,576 -2.2% L Live Fed Steer Price $ per cwt 113.93 112.90 0.91% 108.57 4.94% E Dressed Fed Steer Price $ per cwt 180.13 178.88 0.70% 174.48 3.24% OKC Feeder Steer, 600-700 $ per cwt N/A N/A N/A 139.17 N/A & Choice Beef Cutout $ per cwt 178.06 182.07 -2.20% 175.04 1.73% Hide/Offal $ per cwt, live wt 13.32 13.28 0.30% 13.67 -2.56% B Rib, Choice $ per cwt 263.64 270.42 -2.51% 244.93 7.64% E Round, Choice $ per cwt 158.05 158.27 -0.14% 150.88 4.75% E Chuck, Choice $ per cwt 139.94 141.72 -1.26% 140.37 -0.31% F Trimmings, 50% $ per cwt 45.85 47.80 -4.08% 77.73 -41.01% Trimmings, 90% $ per cwt 208.75 214.87 -2.85% 181.34 15.12% FI Slaughter Thou. Head 2,003 1,961 2.14% 1,989 0.68% 62,015 1.2% FI Sow Slaughter ** Thou. Head 57.7 43.2 33.42% 56.1 2.83% 1,551 -2.1% H Avg. Dressed Weight Lbs. 203.0 203.0 0.00% 199.0 2.01% 207 0.4% O Pork Production Million Lbs. 405.3 398.5 1.71% 396.4 2.25% 12,853 1.7% G Iowa-S. Minn. Direct Wtd. Avg. 94.45 94.40 0.05% 100.89 -6.38% S Natl. Base Carcass Price Wtd. Avg. 93.10 92.67 0.46% 95.49 -2.50% Natl. Net Carcass Price Wtd. Avg. 95.57 95.23 0.36% 98.62 -3.09% Pork Cutout 185 Lbs. 92.27 90.33 2.15% 102.55 -10.02% Hams $ per cwt 74.46 73.24 1.67% 81.60 -8.75% Loins $ per cwt 104.00 101.09 2.88% 122.07 -14.80% Bellies $ per cwt 139.54 134.90 3.44% 142.47 -2.06% C Young Chicken Slaughter * Million Head 158.7 156.3 1.51% 160.5 -1.15% 4,404 -4.9% H Avg. Weight (Live) Lbs. 5.67 5.56 1.98% 5.66 0.18% 5.72 -0.2% I Chicken Production (RTC) Million Lbs. 679.2 656.1 3.51% 676.8 0.36% 18,968 -4.0% C Eggs Set Million 195.2 195.8 -0.32% 195.1 0.02% 5,714 -3.8% K Chicks Placed Million Head 163.1 162.9 0.14% 162.8 0.17% 4,763 -3.2% E 12-City Broiler Price Composite 81.89 83.92 -2.42% 79.78 2.64% N Georgia Dock Broiler Price 2.5-3 Lbs. 93.88 93.92 -0.04% 86.02 9.14% Northeast Breast, B/S $/cwt 139.11 137.92 0.86% 116.95 18.95% Northeast Legs $/cwt 63.5 61.99 2.44% 63.21 0.46% T Young Turkey Slaughter * Million Head 4.735 4.253 11.33% 4.544 4.20% 126.654 -0.5% U Avg. Live Weight Lbs. 30.16 29.01 3.96% 28.71 5.05% 30.11 0.0% R Turkey Production (RTC) Million Lbs. 114.2 98.7 15.76% 104.3 9.46% 3,110 1.8% K Eastern Region Hen Price 8-16 Lbs. 107.50 106.50 0.94% 104.00 3.37% G Corn, Omaha $ per Bushel 7.78 8.12 -4.19% 7.24 7.46% R DDGs, Minnesota $ per Ton 287.50 272.50 5.50% 182.50 57.53% A Wheat, Kansas City $ per Bushel 8.78 9.13 -3.83% 7.47 17.54% I Soybeans, S. Iowa $ per Bushel 17.01 17.96 -5.29% 13.83 22.99% N Soybn Meal, 48% Decatur $ per Ton 553.30 551.00 0.42% 347.80 59.09% * Chicken & turkey slaughter & production are 1 week earlier than the date at the top of this sheet. ** Cow and sow slaughter reflect levels from two weeks ago due to reporting lag.