Download as PDF, PPTX

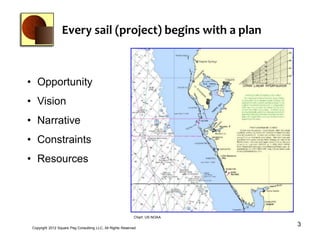
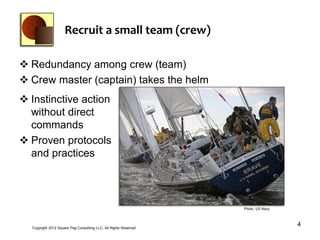
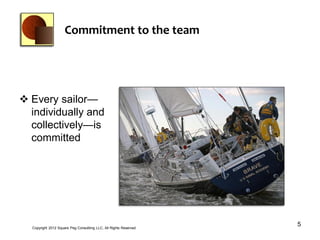
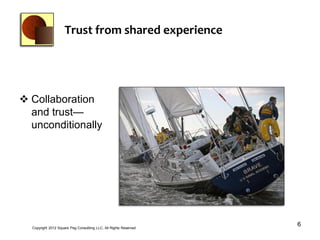
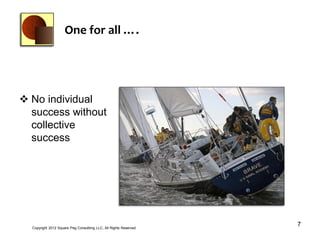
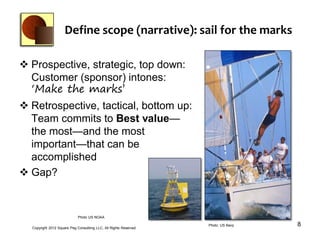
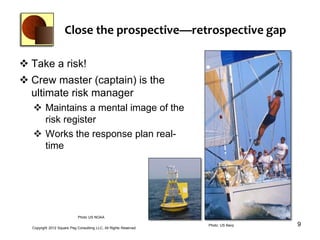
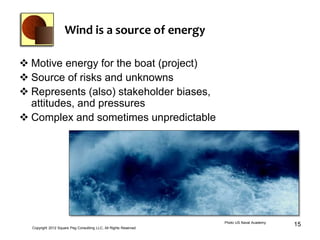
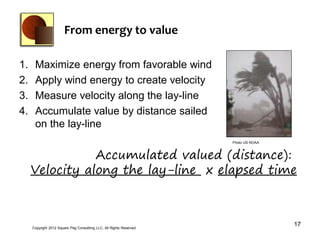
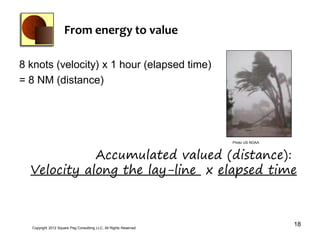
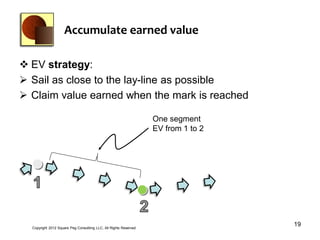
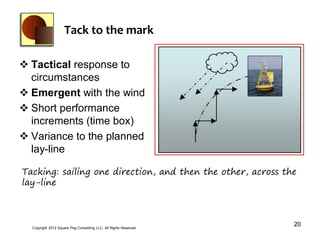
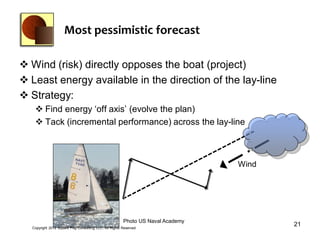
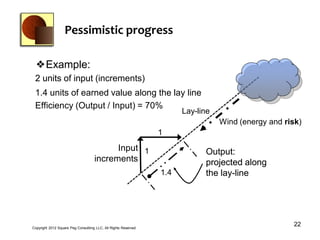
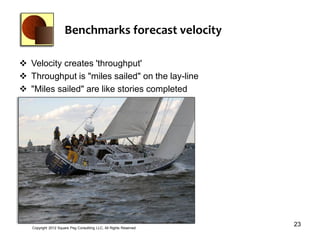
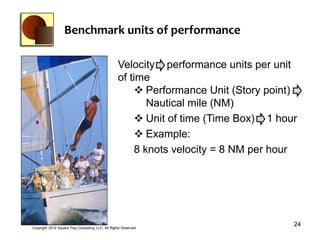
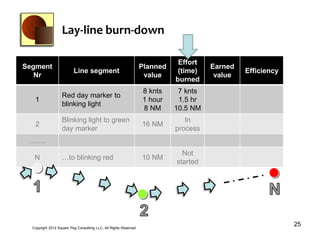


This document summarizes a presentation about using sailing principles as an analogy for Agile project management. It discusses how sailing requires a plan, small crew, trust, commitment to the team, embracing change, measuring progress toward navigation marks, adapting to wind as a source of risk and energy, and tacking across the layline to accumulate earned value toward reaching objectives. The overall environment is complex and adaptive like projects.


