Oz Metals 20150405
•
0 likes•376 views

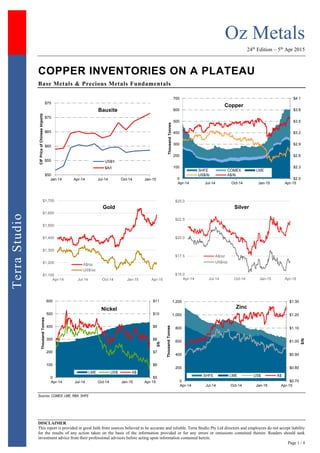
Copper exchange inventories have remained roughly constant for the last few weeks. Could it be just a pause for a market heading towards a surplus this year or another unexpected deficit like in previous years? Update on metals market and junior mining companies listed on the Australian Securities Exchange

Recommended
More Related Content
What's hot
What's hot (19)
Viewers also liked
Similar to Oz Metals 20150405
Similar to Oz Metals 20150405 (20)
Recently uploaded
Recently uploaded (20)
Oz Metals 20150405
- 1. Oz Metals 24th Edition – 5th Apr 2015 DISCLAIMER This report is provided in good faith from sources believed to be accurate and reliable. Terra Studio Pty Ltd directors and employees do not accept liability for the results of any action taken on the basis of the information provided or for any errors or omissions contained therein. Readers should seek investment advice from their professional advisors before acting upon information contained herein. Page 1 / 4 TerraStudio COPPER INVENTORIES ON A PLATEAU Base Metals & Precious Metals Fundamentals Sources: COMEX, LME, RBA, SHFE $50 $55 $60 $65 $70 $75 Jan-14 Apr-14 Jul-14 Oct-14 Jan-15 CIFPriceofChineseImports Bauxite US$/t $A/t $2.0 $2.3 $2.6 $2.9 $3.2 $3.5 $3.8 $4.1 0 100 200 300 400 500 600 700 Apr-14 Jul-14 Oct-14 Jan-15 Apr-15 ThousandTonnes Copper SHFE COMEX LME US$/lb A$/lb $1,100 $1,200 $1,300 $1,400 $1,500 $1,600 $1,700 Apr-14 Jul-14 Oct-14 Jan-15 Apr-15 Gold A$/oz US$/oz $15.0 $17.5 $20.0 $22.5 $25.0 Apr-14 Jul-14 Oct-14 Jan-15 Apr-15 Silver A$/oz US$/oz $5 $6 $7 $8 $9 $10 $11 0 100 200 300 400 500 600 Apr-14 Jul-14 Oct-14 Jan-15 Apr-15 $/lb ThousandTonnes Nickel LME US$ A$ $0.70 $0.80 $0.90 $1.00 $1.10 $1.20 $1.30 0 200 400 600 800 1,000 1,200 Apr-14 Jul-14 Oct-14 Jan-15 Apr-15 $/lb ThousandTonnes Zinc SHFE LME US$ A$
- 2. Oz Metals 24th Edition – 5th Apr 2015 DISCLAIMER This report is provided in good faith from sources believed to be accurate and reliable. Terra Studio Pty Ltd directors and employees do not accept liability for the results of any action taken on the basis of the information provided or for any errors or omissions contained therein. Readers should seek investment advice from their professional advisors before acting upon information contained herein. Page 2 / 4 TerraStudio Markets & Majors According to the latest CPM Gold Yearbook, mine supply in 2014 reached a record 90.5Moz; “there was a large amount of new mine capacity that came on-stream during 2013, which was being ramped up in 2014, helping to boost mine supply during the year. Additionally, there were new projects that were started during 2014, which also helped to boost mine production during the year and offset any loss in output from existing mines.” Several major producing countries also reached multi-year or all-time highs. Canada achieved record gold output in 2014 (160t, +29%) and jumped two positions up, from 7th to 5th place, surpassing South Africa for the first time. Australia’s annual gold production reached its highest level since 2003, rising to 284t (9.1Moz) for the full 2014 year, up 11t (353,000oz) or 4% y/y. Thomson Reuters - The volume of gold sold forward by mining companies rose by 103 tonnes last year, the biggest annual increase since 1999, an industry report showed on Friday. That far outstrips an estimate given late last year of 42-52 tonnes, after Mexican gold and silver miner Fresnillo said it was hedging 47 tonnes of output over five years. In their quarterly Global Hedge Book Analysis, Société Générale and GFMS analysts at Thomson Reuters said the bulk of the rise in the global gold hedge book last year was driven by Fresnillo and Russia's Polyus Gold, which announced a major hedging deal in July. "Of the growth in the book in 2014, the majority (85 tonnes) came from these two companies. Together they now account for half of the outstanding global hedging," the report said. Thomson Reuters - Chile's state-run Codelco produced 1.672 million tonnes of copper in 2014, a 3.1% rise from a year earlier. The company said the jump in output was mostly due to Codelco's newest mine, Ministro Hales, which produced 141,200 tonnes copper in 2014, up from just 33,600 tonnes in 2013 when it was in its initial ramp-up phase. The increase more than made up for production decreases that totaled 64,000 tonnes, at Radomiro Tomic, Gabriela Mistral and Andina. Codelco's two oldest mines, open-pit Chuquicamata and underground El Teniente, increased their copper output by a combined 7,000 tonnes last year. Codelco direct cash costs in 2014 were 7.8% lower than a year earlier at $1.50 per pound of copper. SNL - Barrick Gold Corp. decided to remove the US$6 billion Cerro Casale gold-copper project in Chile from its pipeline of priority projects after receiving results of a report conducted last year on the profitability of the operation. As a result, the company said its budget for the project this year has decreased significantly. Separately, Reuters reported that Barrick Gold lost its bid to dismiss a U.S. lawsuit accusing the gold major of hiding environmental issues at its troubled Pascua Lama gold-copper project straddling the Chilean-Argentinean border. Thomson Reuters - Proposals made to the Mongolian government by global mining giant Rio Tinto last November to restart the long-delayed Oyu Tolgoi copper mine were the firm's "best and final offer" and won't be changed, Rio's chief executive said. Rio submitted the proposals to resolve some outstanding issues, including a $127 million tax claim that has already been cut to $30 million as well as the approval of a $4 billion project finance package to pay for phase-two construction. Funding, Mergers & Acquisitions Industry sources expressed concern that some investors in X2 Resources may run out of patience, as the portfolio of the private equity fund led by former Xstrata CEO Mick Davis remains empty, Reuters wrote. X2 Resources, which has raised US$6 billion in capital, has approached Vale SA, Rio Tinto and BHP Billiton to acquire assets, according to banking and industry sources. The mining giants, however, supposedly did not want to sell in the hopes of seeing a rebound in prices. Dismissing recent reports, Teck Resources said March 30 that it is not in talks with Antofagasta regarding a potential merger between the companies. Bloomberg News had reported earlier, citing "people with knowledge of the matter," that both companies had held early stage talks about a possible merger deal that would create one of the world's largest copper producers. Antofagasta also separately confirmed that it is not in discussions about the merger. PanAust has received a letter from Guangdong Rising Assets Management (“GRAM”), announcing its intention to make an unconditional, off-market takeover offer to acquire all of the shares (not currently held by GRAM) of PanAust at a cash price of $1.71 per share, which values the ASX-listed copper producer at roughly A$1.09 billion. On Monday 30 March 2015, GRAM released its Bidders Statement on the ASX advising that it expected to dispatch the document to PanAust shareholders on or about 13 April 2015. GRAM is a significant shareholder in PanAust and, at the time of the approach, held approximately 22.5% of the Company. PanAust notes that the Takeover Offer is unsolicited and has been made at a time when both the PanAust share price and spot prices for copper and gold have been trading at near 5 year lows. PanAust also notes that GRAM made a non-binding and indicative takeover proposal in April 2014 at a higher price of A$2.30 per share, or about A$1.37 billion; however, no formal takeover proposal at that price was ever received by PanAust. PanAust notes the Takeover Offer is not yet open for acceptances. PanAust said its board will
- 3. Oz Metals 24th Edition – 5th Apr 2015 DISCLAIMER This report is provided in good faith from sources believed to be accurate and reliable. Terra Studio Pty Ltd directors and employees do not accept liability for the results of any action taken on the basis of the information provided or for any errors or omissions contained therein. Readers should seek investment advice from their professional advisors before acting upon information contained herein. Page 3 / 4 TerraStudio consider the offer and provide advice to shareholders in due course. Apollo Minerals has completed the acquisition of a 70% stake in the Orpheus base metals joint venture project in southeastern Western Australia, under a deal inked in February. Under the deal, Apollo acquired a 70% interest in four of Enterprise Metals’ six Fraser Range nickel project tenements in Western Australia. Corazon Mining said April 1 has completed the transaction to acquire the Victory nickel-copper project located at the Lynn Lake field in Manitoba from Victory Nickel Inc. Under the agreement, the company issued 40 million shares to Victory Nickel. Victory Nickel will retain a 1.5% net smelter royalty on production from the project area, 1% of which can be purchased by Corazon for A$1 million. Corazon is required to spend A$3.5 million on exploration and resource development within five years on execution of the agreement. The Victory nickel-copper project comprises 17 million tonnes at 0.66% nickel and 0.33% copper for 112,000 tonnes of nickel and 57,000 tonnes of copper. FMC Corp. completed the sale of its Alkali Chemicals business to Tronox Ltd. in a deal valued at US$1.64 billion. Galaxy Resources closed the sale of its troubled Jiangsu lithium carbonate plant in China to Sichuan Tianqi Lithium Industries, The West Australian reported. Under the amended terms, the value of the deal was reduced to US$173.2 million, from US$230 million originally. Poseidon Nickel has now taken ownership of the Black Swan nickel project from Norilsk Nickel with the completion of the transaction. The company's short-term focus remains on its Lake Johnston and Windarra projects. The Western Australian operation comprises the Black Swan nickel sulfide concentrator plant, the Black Swan sulfide ore open pit mine and the Silver Swan underground mine. The 2.15mtpa processing plant was extensively upgraded and expanded in 2006 and was put on care and maintenance in February 2009 during the global financial crisis. Poseidon updated the resource for the project in August 2014 to 30.7 million tonnes at 0.58% nickel for 178,700 tonnes of contained nickel in the indicated and inferred categories. Segue Resources Ltd and Port Exploration Pty Ltd are set to enter into a joint venture for Segue Resources' Pardoo nickel sulfide project in Western Australia. The two companies have signed a binding term sheet to enter into a joint venture agreement within 90 days, with Port Exploration paying an initial A$50,000 fee to the company and becoming a subsidiary or assigning its interest to an ASX-listed company within six months. Under the agreement, Port Exploration can earn an initial 51% interest in the property by spending A$250,000 on exploration within 12 months, and can then increase its interest to 80% by spending another A$250,000 on exploration within 12 months of earning the stage-one interest. If exercised, Segue Resources will then have the right to sell its remaining 20% interest to Port Exploration for shares in the company or any of its listed head companies, subject to various approvals. Mercantile Investment Co. Ltd has launched a roughly A$3.2 million cash takeover bid for ASX-listed Phosphate Australia Ltd. Mercantile, which already holds a 9% stake in Phosphate Australia, plans to buy shares between April 14 and May 14 unless it extends the offer period. Phosphate Australia has advised its shareholders not to act on the offer until the company can review it and make a recommendation. Bauxite Sector Source: Bloomberg, SNL Metals & Mining, Terra Studio Lithium-Tantalum Sector Source: SNL Metals & Mining, Terra Studio Tin Sector Source: SNL Metals & Mining Nickel Sector Source: SNL Metals & Mining Code Company Name Close Price Week Δ YTD Δ 52 Week Range Market Cap (A$m) Cash (A$m) TEV (A$m) ABX Australian Bauxite 0.35 ▼ (3%) 15% 44 5 40 BAU Bauxite Resources 0.088 ▲ 17% (10%) 20 25 (4) CAY Canyon Resources 0.045 ▼ (4%) (10%) 6 1 5 MLM Metallica Minerals 0.069 ▲ 35% 25% 12 1 11 MMI Metro Mining 0.067 ▲ 14% 148% 19 8 12 Code Company Name Close Price Week Δ YTD Δ 52 Week Range Market Cap (A$m) Cash (A$m) TEV (A$m) AJM Altura Mining 0.020 — 0% (69%) 9 3 9 GXY Galaxy Resources 0.033 ▲ 32% 32% 35 13 128 ORE Orocobre 2.23 ▼ (3%) (20%) 343 26 344 PLS Pilbara Minerals Ltd. 0.039 ▼ (3%) (7%) 24 2 21 RDR Reed Resources 0.040 ▲ 5% 5% 20 7 18 Code Company Name Close Price Week Δ YTD Δ 52 Week Range Market Cap (A$m) Cash (A$m) TEV (A$m) CSD Consolidated Tin Mines 0.042 ▼ (7%) 2% 12 0 11 ELT Elementos 0.008 ▲ 14% 0% 6 1 5 KAS Kasbah Resources 0.037 ▼ (3%) (31%) 17 4 11 MLX Metals X 1.27 ▲ 5% 61% 526 57 419 MOO Monto Minerals 0.001 — 0% (50%) 1 1 1 SRZ Stellar Resources 0.035 ▼ (10%) 21% 11 4 8 VMS Venture Minerals 0.026 ▲ 4% (16%) 7 7 4 Code Company Name Close Price Week Δ YTD Δ 52 Week Range Market Cap (A$m) Cash (A$m) TEV (A$m) TEV/ EBITDA IGO Independence Group 5.20 ▼ (7%) 17% 1,218 57 1,127 NA MBN Mirabella Nickel 0.120 — 0% 314% 112 18 223 0.4x MCR Mincor Resources 0.65 ▼ (5%) 11% 122 26 104 NA PAN Panoramic Resources 0.49 ▼ (16%) 17% 157 64 99 1.3x WSA Western Areas 3.37 ▼ (13%) (10%) 784 231 733 NA AVQ Axiom Mining 0.165 ▲ 1400% 1000% 40 2 37 NM CZI Cassini Resources 0.08 ▲ 4% (33%) 9 8 7 NA DKM Duketon Mining 0.17 ▲ 13% (35%) 13 7 6 NA LEG Legend Mining 0.008 ▲ 14% 14% 16 7 9 NM MAT Matsa Resources 0.175 ▲ 9% 3% 25 3 25 NA MLM Metallica Minerals 0.069 ▲ 35% 25% 12 1 11 NA PIO Pioneer Resources 0.018 — 0% 38% 12 1 10 NA POS Poseidon Nickel 0.12 ▼ (4%) (4%) 79 4 95 NA SEG Segue Resources 0.006 ▲ 20% 20% 12 1 11 NA SGQ St George Mining 0.076 ▲ 17% 21% 8 1 7 NA SIR Sirius Resources 2.60 ▼ (10%) 2% 888 59 643 NM TLM Talisman Mining 0.16 ▼ (6%) 3% 21 16 6 NA WIN Winward Resources 0.35 ▼ (14%) 116% 37 6 34 NA
- 4. Oz Metals 24th Edition – 5th Apr 2015 DISCLAIMER This report is provided in good faith from sources believed to be accurate and reliable. Terra Studio Pty Ltd directors and employees do not accept liability for the results of any action taken on the basis of the information provided or for any errors or omissions contained therein. Readers should seek investment advice from their professional advisors before acting upon information contained herein. Page 4 / 4 TerraStudio Copper Producers Source: SNL Metals & Mining Copper Developers & Explorers Source: SNL Metals & Mining, Terra Studio Zinc & Poly-metallic Sector Source: SNL Metals & Mining Gold Producers Source: SNL Metals & Mining Gold Developers & Explorers Source: SNL Metals & Mining, Terra Studio For further information, please contact: J-François Bertincourt m +61 406 998 779 jf@terrastudio.biz au.linkedin.com/in/jfbertincourt Code Company Name Close Price Week Δ YTD Δ 52 Week Range Market Cap (A$m) Cash (A$m) TEV (A$m) TEV/ EBITDA ABY Aditya Birla Minerals 0.19 — 0% (5%) 58 137 (46) NA HGO Hillgrove Resources 0.36 ▼ (4%) (21%) 52 9 63 1.3x KBL KBL Mining 0.021 — 0% (30%) 10 7 33 NA MWE Mawson West 0.040 ▼ (11%) (20%) 16 21 67 NM OZL OZ Minerals 3.84 ▼ (0%) 10% 1,165 219 947 2.7x PNA PanAust 1.74 ▲ 39% 23% 1,062 74 1,289 NM SFR Sandfire Resources 4.53 ▲ 6% (0%) 707 58 791 NA SRQ Straits Resources 0.004 — 0% (20%) 5 13 162 NA TGS Tiger Resources 0.053 ▼ (5%) (59%) 61 80 275 5.8x 985 CST Mining 0.048 — 0% 9% 1,301 136 207 0.5x 1208 MMG 2.62 ▲ 6% 9% 13,859 251 85,541 14.7x 3993 China Molybdenum 6.51 ▲ 31% 45% 76,447 9,326 78,009 20.3x Code Company Name Close Price Week Δ YTD Δ 52 Week Range Market Cap (A$m) Cash (A$m) TEV (A$m) AOH Altona Mining 0.110 ▲ 10% (54%) 59 129 (70) ARE Argonaut Resources 0.010 — 0% (38%) 4 1 3 AVB Avanco Resources 0.074 ▲ 4% (3%) 123 20 103 AVI Avalon Minerals 0.027 ▼ (10%) 35% 5 1 3 AZS Azure Minerals 0.014 ▲ 8% (42%) 14 1 0 CDU CuDeco (suspended) 1.41 — 0% (28%) 351 7 406 CVV Caravel Minerals 0.007 ▼ (13%) (13%) 5 1 5 ENR Encounter Resources 0.11 ▲ 10% (15%) 15 4 13 ERM Emmerson Resources 0.028 ▲ 4% (10%) 11 2 8 FND Finders Resources 0.16 ▲ 7% 3% 102 48 103 GCR Golden Cross Resources 0.061 ▲ 11% (13%) 6 2 5 GPR Geopacific Resources 0.036 ▼ (8%) (31%) 14 4 10 HAV Havilah Resources 0.25 ▲ 2% 79% 39 3 36 HCH Hot Chili 0.12 ▼ (4%) (28%) 40 6 46 HMX Hammer Metals 0.075 ▼ (6%) (9%) 8 1 7 IAU Intrepid Mines 0.11 ▲ 5% (19%) 41 74 (33) KDR Kidman Resources 0.040 ▼ (7%) (40%) 5 3 4 KGL KGL Resources 0.16 ▼ (3%) (31%) 22 9 13 MEP Minotaur Exploration 0.10 — 0% (31%) 18 5 12 MNC Metminco 0.005 — 0% (38%) 10 1 9 MTH Mithril Resources 0.005 ▼ (29%) (29%) 2 2 1 PEX Peel Mining 0.080 ▲ 19% 16% 11 3 9 RDM Red Metal 0.045 ▲ 5% (44%) 8 2 3 RER Regal Resources 0.045 — 0% (2%) 10 2 7 RTG RTG Mining 0.550 ▲ 4% (5%) 71 2 68 RXM Rex Minerals 0.085 ▼ (3%) (23%) 19 3 11 SMD Syndicated Metals 0.019 ▼ (5%) (41%) 5 2 4 SRI Sipa Resources 0.079 ▲ 4% 114% 49 4 48 SUH Southern Hemisphere 0.012 ▲ 20% (72%) 3 2 2 THX Thundelarra Resources 0.068 — 0% (38%) 22 7 14 XAM Xanadu Mines 0.100 ▲ 11% 0% 37 8 37 Code Company Name Close Price Week Δ YTD Δ 52 Week Range Market Cap (A$m) Cash (A$m) TEV (A$m) AQR Aeon Metals 0.070 ▼ (15%) (30%) 21 5 33 DGR DGR Global 0.044 — 0% 38% 18 0 20 HRR Heron Resources 0.12 ▼ (11%) (4%) 43 28 19 IBG Ironbark Zinc 0.083 ▼ (8%) 4% 37 3 34 IPT Impact Minerals 0.013 ▲ 8% (46%) 7 1 5 IVR Investigator Resources 0.012 ▲ 9% (25%) 6 3 1 MRP MacPhersons Resources 0.125 ▲ 9% 0% 39 5 35 PNX Phoenix Copper 0.017 — 0% (43%) 6 3 3 RDM Red Metal 0.045 ▲ 5% (44%) 8 8 (0) RVR Red River Resources 0.14 ▼ (10%) 27% 25 4 21 RXL Rox Resources 0.030 ▼ (3%) 7% 26 3 23 TZN Terramin Australia 0.130 ▲ 4% 18% 197 1 196 VXR Venturex Resources 0.004 — 0% (20%) 6 1 5 Code Company Name Close Price Week Δ YTD Δ 52 Week Range Market Cap (A$m) Cash (A$m) TEV (A$m) TEV/ EBITDA AGD Austral Gold 0.09 ▼ (25%) (31%) 43 NA 35 NA ALK Alkane Resources 0.31 ▲ 2% 39% 126 16 107 NA AMI Aurelia Metals 0.25 ▼ (4%) 4% 97 22 198 NA BDR Beadell Resources 0.26 ▼ (9%) 13% 204 13 308 4.8x BOK Black Oak Minerals 0.38 ▼ (3%) 41% 17 11 31 NA DRM Doray Minerals 0.46 ▼ (1%) (4%) 110 16 109 NA EVN Evolution Mining 0.88 ▲ 3% 36% 627 32 757 3.7x IGO Independence Group 5.20 ▼ (7%) 17% 1,218 57 1,127 NA KCN Kingsgate Consolidated 0.71 ▲ 4% 8% 159 54 242 NA KRM Kingsrose Mining 0.22 ▼ (7%) (16%) 77 7 88 NA LSA Lachlan Star 0.024 — 0% 20% 4 2 22 NA MIZ Minera Gold 0.002 ▲ 33% (33%) 6 0 11 NA MLX Metals X 1.27 ▲ 5% 61% 526 57 419 NA MML Medusa Mining 0.96 — 0% 48% 199 13 192 NA MOY Millennium Minerals 0.028 ▼ (13%) (24%) 6 2 42 NM NCM Newcrest Mining 13.78 ▲ 1% 27% 10,563 141 14,980 NA NGF Norton Gold Fields 0.20 — 0% 60% 186 19 314 4.8x NST Northern Star Resources 2.35 ▼ (3%) 58% 1,392 82 1,364 NA OGC OceanaGold Corp. 2.54 ▲ 0% 26% 771 NA 855 2.8x PGI PanTerra Gold 0.190 ▲ 36% 6% 16 3 80 NM PRU Perseus Mining 0.31 ▼ (3%) 17% 161 37 126 2.2x RMS Ramelius Resources 0.115 ▲ 5% 125% 54 12 37 NA RRL Regis Resources 1.29 ▼ (6%) (33%) 642 7 652 NA RSG Resolute Mining 0.29 ▼ (6%) 9% 186 19 217 NA SAR Saracen Mineral Holdings 0.44 ▼ (1%) 71% 345 36 325 NA SBM St Barbara 0.22 ▼ (2%) 110% 109 79 432 NA SLR Silver Lake Resources 0.19 ▼ (5%) (3%) 96 24 102 NA TBR Tribune Resources 3.35 ▲ 2% 26% 168 11 182 10.6x TRY Troy Resources 0.48 ▼ (8%) 4% 94 43 134 NA UML Unity Mining 0.010 ▲ 25% 43% 11 7 (1) NA Code Company Name Close Price Week Δ YTD Δ 52 Week Range Market Cap (A$m) Cash (A$m) TEV (A$m) AYC A1 Consolidated 0.035 ▲ 9% (13%) 10 0 9 ABU ABM Resources 0.23 — 0% (20%) 79 11 68 AWV Anova Metals 0.045 ▼ (2%) 67% 13 1 12 AZM Azumah Resources 0.020 ▼ (5%) 0% 8 4 7 BLK Blackham Resources 0.150 ▼ (3%) 194% 27 3 24 BSR Bassari Resources 0.011 ▼ (8%) (8%) 13 0 13 CHN Chalice Gold Mines 0.13 ▲ 4% 19% 35 43 (7) CHZ Chesser Resources 0.034 — 0% (6%) 8 1 3 DCN Dacian Gold 0.47 ▼ (4%) 68% 45 8 38 EXC Exterra Resources 0.012 ▼ (8%) (8%) 2 1 2 EXG Excelsior Gold 0.095 ▲ 2% 56% 44 2 44 FML Focus Minerals 0.006 ▼ (8%) (14%) 55 9 46 GCY Gascoyne Resources 0.091 ▲ 1% 28% 16 1 16 GMR Golden Rim Resources 0.010 ▲ 25% 100% 14 1 14 GOR Gold Road Resources 0.34 ▼ (7%) 39% 202 21 181 GRY Gryphon Minerals 0.067 ▲ 12% 5% 27 34 3 IDC Indochine Mining 0.006 — 0% (50%) 8 0 10 KGD Kula Gold 0.045 ▲ 7% 2% 12 3 9 MSR Manas Resources 0.017 ▲ 6% 21% 9 0 8 MUX Mungana Goldmines 0.120 ▼ (8%) (4%) 29 5 34 OGX Orinoco Gold 0.082 ▼ (2%) 39% 13 1 11 PNR Pacific Niugini 0.070 ▲ 6% 40% 27 1 26 PXG Phoenix Gold 0.090 ▼ (2%) (8%) 38 6 32 RED Red 5 0.105 ▼ (5%) 14% 80 38 62 RNI Resource & Investment 0.078 ▲ 7% 4% 39 5 56 RNS Renaissance Minerals 0.041 ▼ (9%) (37%) 16 4 12 SAU Southern Gold 0.013 ▲ 8% 63% 7 1 6 SIH Sihayo Gold 0.011 — 0% 38% 12 0 7 TAM Tanami Gold 0.027 ▼ (7%) 93% 32 1 42 WAF West African Resources 0.070 ▼ (7%) (30%) 19 3 19 WPG WPG Resources 0.037 ▲ 3% (3%) 10 3 7