C U L T U R E A S A M E D I A T O R O F H E A L T H D I S P A .docx
Research methods final project
1. Nour Abrahim, Ha Young Cho, Ezekiel Ahn
Team #5
Research Methods
Final Research Project
Introduction and Background
Poverty is the number one factor impacting our economic growth in America. According
to the census bureau, poverty rate is the percentage of individuals in total or as various subgroups
in United States who are living on income below the threshold amount” (GAO 4). When looking
at the factors that affect poverty in a certain area, we find that there could be factors that
influence the poverty rate in America more than others. Income and race are two of many
controversial concepts when it comes to affecting the incarceration rates, and the sustainability of
good health which all play a major role in influencing the poverty rate in America. According to
the 2012 GSS survey; incarceration, health, income and race are our main variables of focus in
trying to explain the big role they play in affecting poverty. The rise of imprisonment can affect
various dimensions of poverty, not just for the individuals being incarcerated, but also for their
families and communities. These rates are determined by the removal of poor people from the
calculated poverty rate by shifting them to a separate “institutional population” category, and
removing these individuals from previous low-income families that places constraints on their
employment and earnings before being incarcerated (DeFina, and Hannon 564). Therefore,
when they come out of prison, they are burdened with employment discrimination; including
lack of skills in job training. This is due to inadequate education received before prison and
during imprisonment, that is, in return fueling an ongoing cycle they face called: poverty. Race
plays another factor on poverty rates because racial and ethnic minorities such as African-
Americans, and Hispanics have significantly higher rates of poverty than whites. Health and
income are also aspects that affect poverty because lower-income individuals experience higher
2. rates of chronic illness, disease, and disabilities, and also die younger than those who have higher
incomes.
Hypothesis
As we studied how incarceration and race affect income and health and how they all play
a role in the level of poverty the United States faces.
We hypothesized that, “if a person has been incarcerated for a certain crime, they are
within category of ethnic minority. People of African-American or Hispanic minorities have one
of the highest percentages that sum up people living under poverty, due to the fact that they are
more likely to live in urban neighborhoods, and are afflicted with inadequate resources such as
lack of healthcare, scarce food, and lack of permanent shelter.
We also hypothesized that, “if a person has a crime record and poor health, their income
level will be lower than a person with no crime rate and better health.” It is evident that people
who commit deviant acts with poor health will most likely have a low income due to inadequate
education that will prevent them from maintaining good health. Those with low income cannot
afford insurance, or medicaid because they might not be qualified to receive it. Poor people
simply do not understand the levels and impacts of diseases, and health statuses due to their lack
of education in health and well-being. Therefore, adding another factor such as high levels of
death in ethnic minorities due to their negligence to protect their health status.
Finally, we hypothesized that, “If a person is of certain race and does not make much
income then they are more likely to be convicted.” This is due to the fact that the environment
they lived in had limited opportunities for a steady job or proper education, prior to being
incarcerated. Factors that affect recidivism rates plays a burden on employment discrimination;
including lack of skills in job training in prison, as well as proper rehabilitation for substance
3. abuse that releases prisoners cycling back to their old habits, which can hurt their functionalities
within their communities.
Literature Review
By taking a look at how health impacts poverty we can take a look at Fortin’s (2010)
longitudinal analysis in the connection between low income, weak labour force attachment and
poor health. By using 1994 to 2004 data from the National Population Health Survey, he was
able to display how working class Canadian individuals were more likely to be poor if they
suffered from bad health. “Results indicated that persistently poor or weakly employed
Canadians are in much more poorer health than other Canadians …[which] also increases the
probability of experiencing deterioration in health as much as being in poor health increases the
probability of being poor.” Dave Parks from Birmingham News, claimed the same idea in an
article on poverty and poor health in the spotlight stating that there is a troubling connection
between health and wealth that “has America lagging behind much of the developed world
(Parks 2008) It is important to improve the health of people living in dire poverty who are
subjugated by discrimination such as minimum access to proper healthcare which may continue
to affect health disparities among poverty stricken communities. Among health inequality, race
plays a huge factor in determining the health status of individual. Health disparities are
multifactorial which are associated with biology of disease, environmental factors, and health
care interventions. In a journal called Health Inequalities: Promoting Policy Changes in Utilizing
Transformation Development by Empowering African American Communities in Reducing
Health Disparities, presents facts on how race and class are almost always intertwined when
determining health status and mortality rates of individuals of lower income class. “Death rates
from heart disease are two or three times higher among lower income black and white compared
4. to middle income groups. And almost for both male and females at every income level, blacks
have the highest coronary disease rates than blacks” (Kennedy 156). The barriers determining
these disparities is due to limited access to health insurance, medicaid, medicare, and the quality
of care received for even lower income individuals is poor.
In his study, Reardon et al. (2015) also mention the significance between household race
and income as they are our independent variables. The study mentioned in this article shows
economic segregation among blacks and hispanics. However poverty rates still remain high and
linear among Blacks and Hispanics. Residential segregation leads to racial and socioeconomic
disparities in neighborhood conditions. Reardon (2015) and his colleagues investigated how
patterns of neighborhood context in the United States over the past two decades vary by
household race/ethnicity, income and metropolitan area. They found large and persistent racial
differences in neighborhood context, even among households with the same annual income.
They did this by using data from the decennial censuses and the American Community Survey.
To further explain our variables with findings Nkansah et al. (2013) also discussed the
controversy between problems of poverty, poor health and incarceration as they are “unevenly
distributed among racial and ethnic minorities in the United States-style neoliberalism -a
prevailing political and economic doctrine that shapes social policy, including public health and
anti-poverty intervention strategies.” The author explains neoliberalism as the gap between the
poor and rich, and why the poor is becoming poorer due to the fact that no governmental
interventions for the poor are being settled. The extent of poverty in America is measured by a
head count rate, which is the percentage of the total population represented by the poor.
However, researchers in this study opposes the view on the head count rate to measure
individuals falling under the poverty rate. The count simply does not measure poverty to its
5. extent, as well as the income distribution among low income families. This study needs further
implications analyzing total number of people living under poverty in order to create anti-
poverty intervention strategies.
Data and Methods
We used a secondary data analysis to test our hypotheses. The data being analyzed is
from the 2012 General Social Survey. The GSS conducts scientific research on the structure and
development of American Society using a data collection program that allows monitoring of
societal change in America, along with nations comparable to America (GSS, 1972). The 2012
GSS followed a biennial, double sample design, which means it was done every other year and
repeated. There was a cross-section (number of respondents) of 1,974 involved in the survey, all
of which were randomly selected. All the interviews were completed between January and June
2012, each interview being approximately 1.5 hours each. To be a part of the survey, you had to
be 18 years old and speak Spanish and/or English. The 2012 survey also had sub-sampled non-
respondents, which reduces non-response bias.
In the dataset, various core questions that have been the same since 1972 were asked.
New questions addressed high risk behaviors, work values, human values, workplace conflict,
religious identity, the environment, transition to adulthood, and racial identity. Our variables
were chosen due to having an association with our topic presented above.
The software we used for the statistical analysis of our variables was SPSS (Statistical
Package for the Social Sciences). After running frequencies, this is what we learned about our
data:
Table A: CONVICTED OF CRIME EVER (CONVICTD)
Unweighted Frequency Valid Percent
6. Valid Yes 210 12.0
No 1538 88.0
Total 1748 100.0
Missing IAP 220
DON'T KNOW 1
No answer 5
Total 226
Total 1974
When people were asked if whether they were convicted with a crime, almost all respondents at
88% said no, while 12% said yes. A small portion about the size of the “yes” audience yielded a
missing value.
Table B: RACE OF RESPONDENT (race)
Unweighted Frequency Valid Percent
Valid WHITE 1477 74.8
BLACK 301 15.2
OTHER 196 9.9
Total 1974 100.0
Missing Value: 0
This questionnaire simply asked for the race of the respondents, with caucasians making up most
of the population at about 75% and the rest making up African Americans and other races.
Table C: FAMILY INCOME IN 3 GROUPS (income_3group)
Unweighted Frequency Valid Percent
Valid under 30K 634 36.1
30K to 74999 612 34.8
75K and over 512 29.1
7. Total 1758 100.0
Missing System 216
Total 1974
Out of all the people that were surveyed, 36.1% made up annual incomes with under $30k, 34.8
had an income ranging from $30k to $74,999, and 29.1% made $75k and over, showing that
income ranges were somewhat evened out between all respondents.
Table D: CONDITION OF HEALTH (health)
Unweighted Frequency Valid Percent
Valid EXCELLENT 350 26.8
GOOD 598 45.8
FAIR 275 21.1
POOR 83 6.4
Total 1306 100.0
Missing IAP 666
DK 1
NA 1
Total 668
Total 1974
Lastly, 26.8% had excellent health, with 45.8% having good health and 21.1% having poor
health. A majority of respondents believed this question to be inapplicable in this survey.
Findings:
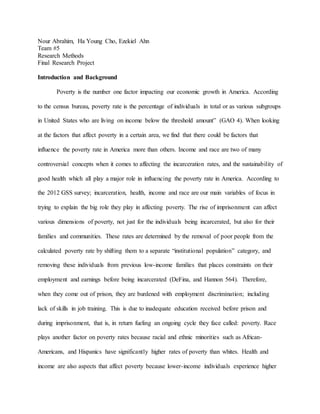
Table E: Relationship between conviction of crime and their family income
family income in 3 groups Total
8. under
30K
30K to
74999
75K and
over
CONVICTED OF
CRIME EVER
Yes 18.0% 12.0% 7.0% 12.0%
No 82.0% 88.0% 93.0% 88.0%
Total Count 512 564 494 1570
% 100.0% 100.0% 100.0% 100.0%
Note: Unweighted Pearson Chi-square, p-value is less than 0.01, with 2 degrees of freedom
Phi and Cramer’s V values = 0.140
Spearman Correlation = 0.140
Each percentage in every table has been rounded.
Source: GSS Survey 2012
The two variables being tested are if they were convicted for a crime and their respective family
incomes. We chose this crosstab as a chart over all the others because while most were not
convicted with a crime in the first place, it clearly indicates that more convicts came from
backgrounds with lower incomes, while less were from those with higher earnings. See chart
below:
9. This addresses our second hypothesis posed above, where ““if a person has a crime
record and poor health, their income level will be lower than a person with no crime rate and
better health.” As aforementioned, it is evident that people who commit deviant acts will most
likely have a low income due to inadequate education that will prevent them from maintaining
good health. While those convicted only made up 12.3% of the participants, it is in this
population where the results can be brought forth. Most of those who were convicted were from
backgrounds of income under $12k, with less making $30k to $74,999 and even less with well-
off incomes at $75k.The bar graph shown above does a good job at demonstrating the trend that
we observe in our second hypothesis. The value of Cramer’s V being .140, which is closer to 0
than it is to 1, shows that there is a weak association but that there is in fact some sort of an
association between the two variables. Having a p-value of less than 0.01 tells us that the
findings are in fact statistically significant and not due to random chance.
Table F: Relationship between conviction of a crime and their condition of health
CONDITION OF HEALTH
Total
EXCELLEN
T GOOD FAIR POOR
CONVICTE
D OF
CRIME
EVER
Ye
s
10.0% 12.0% 15.0% 18.0% 13.0%
No 90.0% 88.0% 85.0% 82.0% 87.0%
Total Coun
t
318 559 231 68 1176
% 100.0% 100.0
%
100.0
%
100.0
%
100.0
%
Note: Unweighted Pearson Chi-Square, p-value = 0.215
Phi and Cramer’s V values = 0.062
Spearman Correlation = -0.059
10. Each percentage in every table has been rounded.
Source: GSS Survey 2012
Table G: Relationship between race of respondent and their family income
family income in 3 groups
Total
under
30K
30K
to
74999
75K and
over
RACE OF
RESPONDE
NT
WHIT
E
68.0% 76.0% 82.0% 75.0%
BLAC
K
21.0% 14.0% 9.0% 15.0%
OTHE
R
11.0% 10.0% 9.0% 10.0%
Total Count 634 612 512 1758
% 100.0% 100.0
%
100.0% 100.0%
Note: Unweighted Pearson Chi-square, p-value is less than 0.01, with 2 degrees of freedom
Phi and Cramer’s V values = 0.152 and 0.108, respectively
Spearman Correlation = -0.128
Each percentage in every table has been rounded.
Source: GSS Survey 2012
Table H: Relationship between race of respondent and their condition of health
CONDITION OF HEALTH
Total
EXCELLE
NT
GOO
D FAIR
POO
R
RACE OF
RESPONDE
NT
WHIT
E
78.0% 74.0% 70.0% 81.0% 75.0%
BLAC
K
12.0% 16.0% 19.0% 11.0% 15.0%
OTHE
R
10.0% 10.0% 11.0% 8.0% 10.0%
11. Total Cou
nt
350 598 275 83 1306
% 100.0% 100.0
%
100.0
%
100.0
%
100.0
%
Note: Unweighted Pearson Chi-Square, p-value = 0.114
Phi and Cramer’s V values = 0.089 and 0.063, respectively
Spearman Correlation = 0.041
Each percentage in every table has been rounded.
Source: GSS Survey 2012
Discussion and Conclusion:
Poverty is still an ongoing issue that we face in America. Having access to healthcare,
and incarceration rates that are adding onto poverty rates is shown with our paper. The main
components that we focused on in our paper are the level of income and race that can affect
poverty. Social injustices in the United States always results in negative outcomes in determining
poverty such as race, subjugation within those convicted due to their criminal histories, and their
health outcomes that are caused by low income. In our report we focused on three different
hypothesis, which we sought that race and income to play as mediating factors affecting
incarceration rates that cycle into higher rates of poverty. Our findings in the data were not
completely comparable to our hypothesis when putting them with each other. However, our data
proves that people with low income who have been incarcerated come out of prison becoming
more impoverished. Race and Health outcomes were relatively skewed due to the fact that more
Whites were participating in the survey, and the respondents determined that health outcomes
were not applicable questions that should have been on the survey.
There were some confounding factors that can also affect poverty rates that were not
mentioned. Crime and mental health is one of the confounding factors affecting poverty due to
the fact that it relates to incarceration, and mediates poverty rates. Although, not explicitly
12. mentioned in our focus, it plays a big role in determining why people who suffer from mental
illnesses from being incarcerated for so long are more prone to living under poverty. One of the
biggest mental illness that strikes those who have been incarcerated is Post traumatic stress
disorder (PTSD) (Marans et al., 1995). As a result of this mental illness, those who are presently
living in urban environments, are at greater risk of developing other mental disorders and poor
health than those living in suburban and rural areas. Those who experience the highest risk of
mental disorders are disadvantaged populations within these urban communities. As a result of
the complex forces that come together amid concentrated urban poverty, there exists a
bidirectional, cyclic, and reinforcing relationship between poverty (Burt et al. 69).
Furthermore, If greater incarceration is being placed, crimes committed must be depleted
due to the fact that those committing crimes are being taken out of communities in poor
neighborhoods. A second confounding factor for levels of measurement in poverty is education.
Which shows why prisoners who were uneducated and are released from prisons are likely to
return to prison, therefore reinforcing poverty for the family they leave. Mentioned in the study
by Nally, et al. that shows that many offenders are unemployed because they do not have
sufficient education and professional skills to meet with job demands in a variety of industry
sectors (Nally, et al. 71). These convicts do not have the adequate knowledge to sustain in their
society because of lack of job skills that they are unable to obtain.
In conclusion, our three hypotheses mentioned were able to be implemented in our data
which reflected and supported our theory that incarceration, race, income and health play a big
role in influencing poverty levels. One race could be incarcerated more than the other,
incarceration affects health which means our data supports its statistical significance and health
does not always affect the rate of incarceration which means it is not necessarily statistically
13. significant. Overall, this research has taught us that there are many other sub points to consider
when it comes to the factors that contribute to increased poverty but that these factors do not rely
on bias but actual data that supports our research.
14. Works Cited
Astell-Burt, T., Feng, X., Kolt, G. S., & Jalaludin, B. (2015). Does rising crime lead to
increasing distress? Longitudinal analysis of a natural experiment with dynamic objective
neighbourhood measures. Social Science & Medicine,13868-73.
doi:10.1016/j.socscimed.2015.05.014
Parks, Dave., News staff, w. (2008, April 8). Poverty, poor health connection in spotlight; UAB
symposium looks at social ills as root of poor health. Birmingham News (AL).
Fortin, M. (2010). The Connection between Low Income, Weak Labour Force Attachment and
Poor Health. Canadian Studies In Population, 37(1-2), 25-52.
Ljungqvist, I. )., Topor, A. )., Forssell, H. )., Svensson, I. )., & Davidson, L. ). (2015). Money
and Mental Illness: A Study of the Relationship Between Poverty and
Serious Psychological Problems. Community Mental Health Journal, 9p.. doi:10.1007/s10597-
015-9950-9
Flouri, E., Midouhas, E., Joshi, H., & Sullivan, A. (n.d). Neighbourhood social fragmentation
and the mental health of children in poverty. Health & Place, 31138-145.
Nally J, Lockwood S, Knutson K, Taiping H. An Evaluation of the Effect of Correctional
Education Programs on Post-Release Recidivism and Employment: An Empirical Study in
Indiana. Journal Of Correctional Education [serial online]. April 2012;63(1):69-89. Available
from: Academic Search Premier, Ipswich, MA. Accessed December 14, 2015.
Nkansah-Amankra, S., Agbanu, S. K., & Miller, R. J. (2013). Disparities in Health, Poverty,
Incarceration, and Social Justice among Racial Groups in the United States: A Critical Review of
Evidence of Close Links with Neoliberalism.International Journal Of Health Services, 43(2),
217-240 24p. doi:10.2190/HS.43.2.c
Reardon, S. F., Fox, L., & Townsend, J. (2015). Neighborhood Income Composition by
Household Race and Income, 1990-2009. Annals Of The American Academy Of Political And
Social Science, 66078-97.