Use of Chemical and Isotopic Data to Improve Conceptualization of Groundwater Flow in the Middle Rio Grande Basin, NM (Plummer)
•Download as PPT, PDF•
1 like•347 views

Presentation given during the USGS/IAEA/IW:LEARN groundwater learning exchange in the US April 14-26, 2007. L. Niel Plummer U.S. Geological Survey, Reston, Virginia Ward Sanford, Laura Bexfield and Scott Anderholm

Recommended
Recommended
More Related Content
Viewers also liked
Viewers also liked (16)
Similar to Use of Chemical and Isotopic Data to Improve Conceptualization of Groundwater Flow in the Middle Rio Grande Basin, NM (Plummer)
Similar to Use of Chemical and Isotopic Data to Improve Conceptualization of Groundwater Flow in the Middle Rio Grande Basin, NM (Plummer) (20)
More from Iwl Pcu
More from Iwl Pcu (20)
Use of Chemical and Isotopic Data to Improve Conceptualization of Groundwater Flow in the Middle Rio Grande Basin, NM (Plummer)
- 1. U.S. Department of the Interior U.S. Geological Survey Use of Chemical and Isotopic Data to Improve Conceptualization of Groundwater Flow in the Middle Rio Grande Basin, NM L. Niel Plummer U.S. Geological Survey, Reston, Virginia Ward Sanford, Laura Bexfield and Scott Anderholm
- 2. Thanks USGS folks (Reston, Menlo Park, Albuquerque) for field assistance, laboratory analyses, data processing, drafting, manuscript preparation: Ed Busenberg, Jerry Casile, Mike Doughten, Julian Wayland, Peggy Widman, Andrew Stack, Anne Burton, Brian C. Norton, David Jones, Ami Mitchell, Daniel Webster, Tyler Coplen (and RSIL staff), Kinga Revesz, Robert L. Michel, Fred Gebhardt, R.K. DeWees, Jim Bartolino, Joe Sterling, Carolina Trevizo, and Lori Shue. Advice: Doug McAda, Mark Hudson, and Scott Minor of the USGS, Fred Phillips of New Mexico Institute of Mining and Technology, and John Hawley and Sean Connell of the New Mexico Bureau of Geology and Mineral Resources (NMBGMR). Colleague/Peer Review: Jim Bartolino, Don Thorstenson, Tom Reilly, Pierre Glynn, John Izbicki. Funding: Ground Water Resources Program and the National Research Program of the U.S. Geological Survey.
- 3. U.S. Department of the Interior U.S. Geological Survey Acknowledgments This study would not have been possible without the generous assistance of individuals from the following organizations: • Cochiti, Isleta, Jemez, Sandia, San Felipe, Santa Ana, Santo Domingo, and Zia Pueblos • The Southern Pueblos Agency • The Bureau of Indian Affairs • The U.S. Forest Service • The Bureau of Land Management • The U.S. Fish and Wildlife Service • Kirtland Air Force Base • Sandia National Laboratories • The New Mexico Office of the State Engineer • The New Mexico Environment Department • The University of New Mexico and New Mexico Tech, including the NMBGMR • The City of Albuquerque Environment Department and Water Utilities Division • The City of Belen and the Town of Los Lunas • Rio Rancho Utilities, Rio Grande Utilities, Sandia Peak Utility Company, National Utilities, New Mexico Utilities, DRESCO, Intel, AT&T, King Brothers Ranch, and the Huning Ltd. Partnership • Individual home owners. • The USGS, and any others I may have forgotten….
- 4. Middle Rio Grande Basin Study Middle Rio Grande Basin Study
- 5. •Covers over 7,800 km2 •Located within the Basin and Range physiographic province and the Rio Grande Rift •Defined by the extent of Cenozoic deposits Middle Rio Grande Basin
- 6. Features of the Middle Rio Grande Basin • Average elevation exceeds 1,500 m, with surrounding mountains approaching 3,300 m. • Semi-arid climate with variable precipitation resulting mostly from summer storms. • Rio Grande and associated irrigation system inset in a terraced valley. • Major tributaries are ephemeral streams and arroyos.
- 7. Precipitation at Albuquerque Rio Grande Discharge
- 8. Land Use Mullins and Hare, 1999 •Primarily rangeland •Irrigated agriculture dominates areas of inner valley that are not urban. •Albuquerque and Rio Rancho form the main urban areas. •Population increased almost 120% between 1970 and 2000, to about 690,000 people.
- 9. Sources of Recharge: 1. Along/near basin margins Mountain-front processes, arroyo infiltration, and subsurface ground-water inflow Photo by J.R. BartolinoPhoto by Niel Plummer
- 10. Sources of Recharge: 2. Rio Grande In central parts of the basin, recharge occurs along the Rio Grande, tributaries, and irrigation canals. Areal recharge is negligible. Rio Grande Canals Photos by J.R. Bartolino
- 11. Santa Fe Group Aquifer System Bartolino and Cole (2002) • Consists of generally unconsolidated to moderately consolidated basin-fill sediments up to 4,300 m thick. • Includes Santa Fe Group deposits of Oligocene to middle Pleistocene age, plus overlying Quaternary sediments. • Broadly divided into three units, of which the upper unit is the most productive. • Aquifer conditions are generally unconfined (semi- confined at depth).
- 19. Bexfield and Anderholm, 2002 2002 water-level contours and declines from predevelopment • Substantial pumping since about 1950 has altered predominantly north-south flow of ground water. • Ground water (until recently) supplied all drinking water. • During the 1990s, basin-wide pumping was about 200 million m3 annually; about ¾ of this was pumped by the City of Albuquerque. • Past 40 years, water-level declines of more than 40 m.
- 20. Multi-agency Middle Rio Grande Basin Study • Major participants: USGS (NRP, WRD, GD, NMD), UNM, NMIMT, New Mexico Bureau of Geology and Mineral Resources, New Mexico Office of the State Engineer, City of Albuquerque • Major investigations: – Detailed geologic mapping and high-resolution airborne geophysics to better characterize faults and hydrologic properties – Use of environmental tracers to quantify mountain-front recharge, characterize river-aquifer interaction, and improve knowledge of the flow system – Ground-water-flow modeling The U.S. Geological Survey (USGS) Middle Rio Grande Basin Study was a 6- year effort (1995-2001) by the USGS and other agencies to improve the understanding of the hydrology, geology, and land-surface characteristics of the Middle Rio Grande Basin in order to provide the scientific information needed for water-resources management. The Santa Fe Group aquifer system has historically been the main source of municipal water for the region, and the main purpose of the study was to improve the understanding of the water resources of the basin.
- 21. U.S. Department of the Interior U.S. Geological Survey • Sources of recharge • Ground-water flow paths • Ground-water travel times • Variability in characteristics with depth • Historical recharge rates Objectives of geochemical characterization Use chemical and isotopic data to better understand certain aspects of the ground-water flow system, including:
- 22. U.S. Department of the Interior U.S. Geological Survey Methods: Ground-water chemistry • Collected samples from nearly 300 wells and springs – Sampled wells of all types (domestic, municipal, monitoring, stock) – Wells ranged in depth from 7 to 615 meters • Analyzed ground-water samples for: – Concentration of 30 major, minor, and trace elements – Isotopic composition of water (2 H and 18 O) – Isotopic composition of dissolved inorganic carbon (13 C and 14 C) – Isotopic composition of dissolved sulfate (34 S) – Tritium content (3 H) and tritium/helium-3 ratio (3 H/3 He) – Concentration of dissolved atmospheric gases, including nitrogen, argon, helium, chlorofluorocarbons (CFC’s), and sulfur hexafluoride • Retrieved historical ground-water data from USGS and City of Albuquerque databases
- 23. U.S. Department of the Interior U.S. Geological Survey Methods: Surface-water chemistry • Sampled surface-water sites monthly for up to 2 years – Rio Grande and associated irrigation canals, ground-water drains – Larger tributaries: Jemez River and Rio Puerco – Arroyos: Tijeras, Abo, and Bear Canyon • Analyzed surface-water samples for: – Major, minor and trace elements (30) – 2 H and 18 O – CFC’s – Tritium content – 13 C and 14 C (once)
- 25. 1 9 9 7 1 9 9 8 1 9 9 9 Y E A R - 1 0 0 - 9 0 - 8 0 - 7 0 - 6 0 δ2 H,INPERMIL E X P L A N A T IO N R io G r a n d e R io G r a n d e d r a i n s , c a n a ls B e a r C a n y o n A r r o y o E m b u d o S p r in g T ije r a s A r r o y o -77 -84 -90 δ2 H o /oo
- 26. - 1 4 - 1 2 - 1 0 - 8 - 6 - 4 δ 1 8 O , IN P E R M IL - 1 0 0 - 8 0 - 6 0 - 4 0 δ2 H,INPERMIL E X P L A N A T IO N R io G r a n d e R io G r a n d e d r a in s , c a n a ls B e a r C a n y o n A r r o y o E m b u d o S p r in g T ije r a s A r r o y o J e m e z R iv e r J e m e z R . b e lo w J e m e z C a n y o n D a m R io P u e r c o GlobalM eteoric W aterLine δ 2 H = 8 .1 5 δ 1 8 O + 9 .0 ( le a s t s q u a r e s f it )
- 27. Pre-development water levels and implied directions of groundwater flow • Generally N to S • Groundwater trough • Relation to faults
- 28. Dissolved Oxygen, mg/L Specific Cond. uS/cm
- 29. Sodium, mg/L Alkalinity as HCO3, mg/L
- 30. - 1 6 - 1 2 - 8 -4 D e lt a O - 1 8 (p e r m il) - 1 2 0 - 1 0 0 - 8 0 - 6 0 - 4 0 - 2 0 DeltaD(permil) A ll S a m p le s , M R G B D = 7 .6 O - 1 8 + 2 .4 n = 3 3 5 Groundwater only
- 34. - 1 2 0 - 1 0 0 - 8 0 - 6 0 - 4 0 - 2 0 δ 2 H , IN P E R M IL 1 ,6 0 0 1 ,2 0 0 8 0 0 4 0 0 0 DEPTHBELOWWATERTABLE,INFEET E X P L A N A T I O N P IE Z O M E T E R N E S T S A , L in c o l n E , W e s t B lu f f F , 9 8 t h S t ., 1 9 9 8 G , Is le t a H , S ie r r a V i s t a I, N o r E s t e J , M a t h e s o n K , M e s a D e l S o l, 1 9 9 8 L , M o n t a ñ o 6 N , G a r f ie l d O , H u n t e r R id g e P , S i s t e r C it ie s Q , D e l S o l, 1 9 9 7 Q , D e l S o l, 1 9 9 8 R , M o n t e s a S , S a n d ia T , T o m e R io G r a n d e w in t e r /s p r in g 1 9 9 7 - 9 9 F K I J S A
- 35. Key Chemical and Isotopic Indicators of Water Source • Majors—Sp. Cond., Ca, Mg, Na, K, Cl, SO4, HCO3 • Minors—Silica, B, V, U, As, F, NO3 • Isotopes—D, 18 O, 13 C, 14 C, 34 S, 3 H • Gases—N2, Ar, He, CFCs, SF6
- 37. - 1 6 - 1 4 - 1 2 - 1 0 - 8 - 6 δ 1 8 O , IN P E R M IL - 1 2 0 - 1 0 0 - 8 0 - 6 0 - 4 0 δ2 H,INPERMIL G lo b a l M e t e o r ic W a t e r L in e δ 2 H = 7 .6 2 δ 1 8 O + 2 .4 8 δ 2 H = 8 δ 1 8 O + 1 0 N o r t h w e s t e r n z o n e W e s t - C e n t r a l z o n e W e s t e r n B o u n d a r y z o n e N o r t h e r n M o u n t a in F r o n t z o n e A b o A r r o y o z o n e E a s t e r n M o u n t a in F r o n t z o n e T ije r a s F a u lt Z o n e z o n e T ije r a s A r r o y o z o n e R io P u e r c o z o n e S o u t h w e s t e r n M o u n t a in F r o n t z o n e N o r t h e a s t e r n z o n e C e n t r a l z o n e D is c h a r g e z o n e
- 40. Tritium A r r o y o Calabacillas T i j e r a s Grande Rio
- 41. SF6
- 42. CFC-12 A r r o y oCalabacillas T i j e r a s Grande Rio
- 43. W a t e r T a b le 0 2 0 4 0 6 0 8 0 1 0 0 C F C - 1 2 C o n c e n t r a t io n in p g /k g 1 6 0 0 1 2 0 0 8 0 0 4 0 0 0FeetBelowWaterTable W e ll N e s t M o n t a n o 6 D e l S o l '9 7 G a r f ie ld H u n t e r s R id g e W e s t B lu f f 9 8 t h S t . '9 8 D e l S o l '9 8 I s l e t a L in c o l n M a t h e s o n M e s a D e l S o l '9 8 M o n t e s a S is t e r C i t ie s S a n d i a S ie r r a V is t a N o r E s t e T o m e ( D e e p ) M a t h e s o n 9 8 t h S t r e e t S a n d ia T o m e I s le t a
- 44. 0 1 0 2 0 3 0 T R IT IU M C O N C E N T R A T IO N , IN T R IT IU M U N IT S 0 4 0 8 0 1 2 0 1 6 0 2 0 6 0 1 0 0 1 4 0 14CACTIVITY, INPERCENTMODERNCARBON E X P L A N A T IO N H Y D R O C H E M IC A L Z O N E N o r t h e r n M o u n t a in F r o n t N o r t h w e s t e r n W e s t - C e n t r a l E a s t e r n M o u n t a in F r o n t C e n t r a l 0 .1 1 1 0 1 0 0 1 ,0 0 0 1 0 ,0 0 0 1 0 0 ,0 0 0 C F C - 1 2 C O N C E N T R A T I O N , IN P IC O G R A M S P E R K IL O G R A M 0 4 0 8 0 1 2 0 1 6 0 2 0 6 0 1 0 0 1 4 0 14 CACTIVITY, INPERCENTMODERNCARBON 1 0 2 p m C 9 5 p m C A . M o d e r n C F C - 1 2 Pre-Bomb Ao for Radiocarbon Dating is near 100 pmc
- 45. 0 1 0 0 2 0 0 3 0 0 C F C - 1 2 C O N C E N T R A T I O N , I N P I C O G R A M S P E R K I L O G R A M 0 4 0 8 0 1 2 0 1 6 0 2 0 0 14 CACTIVITY, INPERCENTMODERNCARBON 1 0 0 p m C 1 9 5 9 1 9 6 4 1 9 6 9 1 9 7 4 1 9 7 9 1 9 8 5 1 9 9 7
- 46. Determination of 14 C ages in the MRGB • Ao determined to be 100 pmC • 13 C, a stable isotope affected by phase changes and chemical reactions, indicated that reactions involving carbon were minor • Redox reactions associated with oxidation of organic matter were not important • Processes that were modeled included evaporation, mixing, cation exchange, and phase changes involving calcite, plagioclase feldspar, silica, kaolinite, gypsum, and CO2 R a d io c a r b o n D a t in g i n N E T P A T H B A n d A o b s ( C a lc )A ( M o d e le d o r M e a s u r e d )o A ∆ t ( y e a r s ) 5 ,5 6 8 ln 2 ln= A A n d o b s R e a c t io n M o d e l A + R e a c ta n t s B + P r o d u c ts A o A n d U.S. Department of the Interior U.S. Geological Survey
- 47. 0 2 0 4 0 U n a d ju s te d R a d io c a r b o n A g e (k a ) 0 1 0 2 0 3 0 NumberofSamples A ll S a m p le s M id d le R io G r a n d e B a s in
- 49. D F C B A J KG PE R O H I M Q L N Lower gradients west of RG Higher gradients east of RG Ages at water table increase with distance of flow into basin.
- 51. 0 5 1 0 1 5 2 0 2 5 R A D I O C A R B O N A G E , I N T H O U S A N D S O F Y E A R S 3 0 0 2 0 0 1 0 0 0 MID-DEPTHBELOWWATERTABLE,INMETERS E a s t e r n M o u n t a i n F r o n t A lb u q u e r q u e v ic in it y S o u t h o f T ije r a s A r r o y o N o r t h o f A lb u q u e r q u e
- 52. 0 1 0 ,0 0 0 2 0 ,0 0 0 3 0 ,0 0 0 R A D IO C A R B O N A G E , IN Y E A R S - 1 0 8 - 1 0 4 - 1 0 0 - 9 6 - 9 2 - 8 8 δ2H,INPERMIL P a le o R io G r a n d e W a t e r C e n t r a l Z o n e
- 53. 0 1 0 ,0 0 0 2 0 ,0 0 0 R A D IO C A R B O N A G E , IN Y E A R S - 1 1 0 - 1 0 0 - 9 0 - 8 0 - 7 0 - 6 0 δ2H,INPERMIL E X P L A N A T IO N C e n t r a l z o n e E a s t e r n M o u n t a in F r o n t z o n e
- 54. 0 5 0 0 0 1 0 0 0 0 1 5 0 0 0 2 0 0 0 0 2 5 0 0 0 C a le n d a r Y e a r s ( B P ) 0 5 0 0 0 1 0 0 0 0 1 5 0 0 0 2 0 0 0 0 2 5 0 0 0 RadiocarbonYears
- 55. 0 1 0 2 0 3 0 4 0 5 0 R A D IO C A R B O N A G E , IN T H O U S A N D S O F Y E A R S - 2 0 2 4 6 CORRECTIONTOCALENDARYEARS, INTHOUSANDSOFYEARS z o n e s 3 - 4 z o n e s 1 0 , 1 2 z o n e s 1 , 2 , 5 - 9 , 1 1
- 56. Model calibration included: Radiocarbon ages and location of some hydro- chemical zone boundaries.
- 57. Some changes to conceptualization of groundwater flow based on chemical and isotopic data • Basin-wide recharge rate 170x106 m3 /yr. • Water flowed from mts to R.G. at Albuq. • GW Trough is a zone of high transmissivity. • Time-scale of gw system unknown. • Recharge rate is only about 22x106 m3 /yr. • Water beneath Albuq. is from R.G. to the N. • GW Trough due to a transient in RC rate. • GW sampled on the 0-40 ka time-scale. Before After
- 58. Some changes to conceptualization of groundwater flow based on chemical and isotopic data (cont.) • Some sources of water recognized. • Zone boundaries poorly known. • Nothing known about depth variations. • Paleo-recharge not investigated. • 12 sources and one discharge mapped. • Zone boundaries used to calib. model. • Chem., isotopic and age gradients meas. • Many aspects of paleo-recharge characterized. Before After
- 59. Long-term reliability and sustainability Protection of valued resource Project viability Ability to support quality of life Financial feasibility Initiated in 1997
- 60. Curtailment Strategy The Albuquerque Bernalillo County Water Utility Authority has made a commitment to shut down the system involving the dam when flows are less than 130 cubic feet per second. This is consistent with the Authority’s strategy to utilize the aquifer as a drought reserve during times of very low surface water supply. Under normal circumstances, there will be a one-to-three inch difference in the water level upstream and downstream of the dam, hardly noticeable in a 600-foot-wide river. Curtailing or completely shutting diversions is also the Authority’s commitment to protect fish and wildlife and the Bosque during low flows. During droughts we will stop releasing San Juan-Chama water from Abiquiu and will utilize ground water. When flows return to normal the following winter, the stored San Juan-Chama water will be treated and placed back into the aquifer (Aquifer Storage Recovery) to assist in balancing the amount removed during the drought.
- 62. How will this research be used? • Improved understanding of extent of non-renewable resource. • Improved understanding of the severity of the water- availability need in the region. • Improved understanding of modern recharge rate (lowered estimate of renewable groundwater). • Improved hydrogeologic data for future refinement of a regional ground-water model to help manage the resource (not yet done).
- 63. List of publications from Middle Rio Grande Basin geochemical study Plummer, L.N., Bexfield, L.M., Anderholm, S.K., Sanford, W.E., and Busenberg, E., 2001, Geochemical characterization of ground-water flow in parts of the Santa Fe Group aquifer system, Middle Rio Grande Basin, New Mexico, in Cole, J.C., ed., U.S. Geological Survey Middle Rio Grande Basin Study -- Proceedings of the Fourth Annual Workshop, Albuquerque, New Mexico, February 15-16, 2000: U.S. Geological Survey Open-File Report 00-488, p. 7-10. Sanford, W.E., Plummer, L.N., McAda, D.P., Bexfield, L.M., and Anderholm, S.K., 2001, Estimation of hydrologic parameters for the ground-water model of the Middle Rio Grande Basin Using carbon-14 and water-level data, in Cole, J.C., ed., U.S. Geological Survey Middle Rio Grande Basin Study -- Proceedings of the Fourth Annual Workshop, Albuquerque, New Mexico, February 15-16, 2000: U.S. Geological Survey Open-File Report 00-488, p. 4-6. Bexfield, L. M., and Plummer, L. N., 2003, Occurrence of arsenic in ground water of the Middle Rio Grande Basin, central New Mexico, in Welch, A. H., and Stollenwerk, K. G., eds., Arsenic in Ground Water: Geochemistry and Occurrence, Kluwer Academic Publishers, Chapter 11, p. 295-327. Plummer, L. Niel, Bexfield, Laura M., Anderholm, Scott K., Sanford, Ward E., and Busenberg, Eurybiades, 2004, Geochemical characterization of ground-water flow in the Santa Fe Group aquifer system, Middle Rio Grande Basin, New Mexico. U.S. Geological Survey Water-Resources Investigations Report 03-4131 395p. Sanford, W.E., Plummer, L.N., McAda, D.P., Bexfield, L.M., and Anderholm, S.K., 2004, Use of environmental tracers to estimate parameters for a predevelopment-ground-water-flow model of the Middle Rio Grande Basin, New Mexico: U. S. Geological Survey Water- Resources Investigations Report 03-4286, 102 p. Plummer, L. Niel, Bexfield, Laura, M., Anderholm, Scott K., Sanford, Ward E., and Busenberg, Eurybiades, 2003, Hydrochemical tracers in the Middle Rio Grande Basin, USA: 1. Conceptualization of groundwater flow. Hydrogeology Journal, v. 12, p. 359-388. Sanford Ward E., Plummer L. Niel, McAda, Douglas P., Bexfield, Laura M., Anderholm, Scott K., 2004, Hydrochemical tracers in the Middle Rio Grande Basin, USA: 2. Calibration of a groundwater model. Hydrogeology Journal, v. 12, p. 389-407. Plummer, L.N., W.E. Sanford, L.M. Bexfield, S.K. Anderholm, and E. Busenberg, 2004, Using geochemical data and aquifer simulation to characterize recharge and groundwater flow in the Middle Rio Grande Basin, New Mexico, in Groundwater Recharge in a Desert Environment: The Southwestern United States, edited by J.F. Hogan, F.M. Phillips, and B.R. Scanlon, Water Science and Applications Series, vol. 9, American Geophysical Union, Washington, D.C., 185-216. Plummer, L. Niel, Bohlke, John Karl, and Doughten, Michael W., 2006, Perchlorate in Pleistocene and Holocene groundwater in North- Central New Mexico. Environ. Sci. & Technol., v. 40, No. 6, 1757-1763. http://water.usgs.gov/lab/chlorofluorocarbons/research/MRGB/
Editor's Notes
- In arid regions where recharge rates can be low, chemical and isotopic data may record gw flow info on the 1000’s to 10’s of thousand year timescale. This is a time scale that averages out transients in the predevelopment water table, transients in recharge rate, climatic changes. This talk is about how we used chemical and isotopic data to characterize sources and flow in the MRGB. Isotopic data mainly 2H, 18O, 14C, some 13C, 34S. To show how these data changed some of the prevailing ideas about flow in the basin and improved conceptualization of flow. With some general comments about aspects of the hydrochemistry that were useful in refining the flow model (Sanford’s work): Specifically radiocarbon ages (with comments on use of radiocarbon calibration), and location of hydrochemical zone boundaries used in conjunction with particle tracking.
- The Middle Rio Grande Basin, as defined for the study, is the area within the Rio Grande Valley extending from about Cochiti Lake downstream to about San Acacia. It covers approximately 3,060 square miles in central New Mexico, encompassing parts of Santa Fe, Sandoval, Bernalillo, Valencia, Socorro, Torrance, and Cibola Counties, and includes a ground-water basin composed of the Santa Fe Group aquifer system. (It is equivalent to the Albuquerque Basin referred to by other authors.) The climate over most of the basin is semiarid. In 2000, the population of the Middle Rio Grande Basin was about 690,000 or about 38 percent of the population of New Mexico. Currently (2002), water for municipal and domestic supply is almost exclusively from ground water.
- Essentially no areal recharge from precipitation
- SFG units in figure probably represent around 10,000 ft of thickness. Most production wells completed in upper and/or middle SFG, although wells on the west side (including ones we sampled) tap the lower SFG.
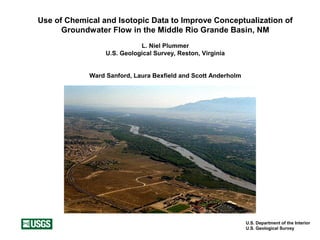
- View looking west from Sandia Mountain across Albuquerque metropolitan area. Mount Taylor, approximately 30 miles west of the western boundary of the basin, appears on the horizon. The Rio Grande and the distinctive bosque on the inner valley are visible across the middle part of the image.
- Southern end of the basin
- Flood prevention from summer thunderstorms carry water to the Rio Grande
- Greening of a desert
- Estimated water level decline, 1960 to 2002.
- Groundwater trough observed by Frank Titus in the early 1960s. A geologic origin (eg coarse sediment, fault, etc was assumed). Later found to be transient in recharge.
- Like the water chemistry, the aquifer can be mapped in stable isotope composition. Map represents isotopic comp of mainly the top 200 feet of aquifer, but from the piezometer nests, it probably extends to maybe 1200 feet below the water table. Note that the RG begins to recharge the aquifer about San Felipe in the N part of the basin. Main features: Mountain Front -80s Central zone -90 to -92 or so West central zone is paleo water, depleted <-100 Elevated isotopic composition in southwest and southeast Notice “finger” of elevated stable isotope comp extending from northern margin to about Albuquerque
- 19 locations; 3-6 depths per location. A few more were installed after our work was completed and were not sampled. Only the deep hole at Tome was completed at the time of sampling. In fact, we were under the drilling rig sampling Tome while the mid depth was being drilled.
- Paleo Rio Grande water was a little more depleted than the average value we got from 1997-99 in winter/spring flow. Most are in the Central zone are represent Rio Grande-sourced water. F and K have west-central zone, depleted water at their mid-depths. J is eastern mountain front. A is the finger of elevated water extending down from the northern basin margin. I and S have eastern Mountain front water at their mid depths.
- Notice that zone 3 extends east beneath parts of zone 12 and is beneath zones 1 and 2 in the northern part of the basin.
- This shows location of some of the piezometer nests (yellow) nearest the City of Alb.. The gray circles and dots locate City of Albuquerque production wells. The red lines delineate the boundaries between sources of water. In zone 12, the ground water is derived from the Rio Grande. Zone 8 from the eastern mountain front. Zone 10 is seepage from Tijeras Arroyo and zone 3 is old western paleo water that is mostly from the last glacial period. Zone 3 occurs under the western part of zone 12 at depth.
- Here is a map of recharge temperatures calculated for waters at the top of the aquifer. Large areas of the basin have waters with recharge temperatures warmer than the modern mean annual temperature of 13.6 oC, indicating warming during infiltration through deep unsaturated zones. Notice especially the warm RTs in shallow ground water in the northern part of the basin.
- On this map, the blue area shows waters thought to have recharged along the flanks of the Jemez mountains north of the basin, at an average altitude of 8,000 feet, during the last glacial period. Both warm and cold RTs are found in this hydrochemical zone. Paleowaters with cold recharge temperatures in the northern part of the basin underlie more recent mountain-front waters with warm recharge temperatures shown on the previous slide. The cold RTs represent either focused recharge of cold waters or high altitude recharge. Further south, paleowaters have RTs as warm as 22 oC. The warm RTs represent waters recharged through deep unsaturated zones.
- Most of the water samples originating along the eastern mountain front are shown here to have infiltrated though unsaturated zones of as much as 150 m. A few samples retain their high-altitude signature. [Variations in land surface altitude are accounted for by shifting line C up along the atmospheric lapse, to adjust calculated RTs for deviations in land surface altitude above 1500 m.] (The samples shown here were all recharged within the past 12 ka.)
- Points with pale yellow color are well locations where tritium was not measured. These were sites where we could measure CFCs which were used instead of tritium.
- CFC-12 is used here to identify wells that, when drilled with mud-rotary drilling, were not completely developed on completion, as they still contain CFC-12. These are Matheson, Sandia, Tome, Isleta, and 98th street. It is not too surprising to find the CFCs in the shallow depths (top of the aquifer may contain CFCs from anthropogenic sources; probably more difficult to develop shallow piezometers– not much head difference to remove the water (used air hose at shallow depth).
- Points above 100 pmc are bomb pulse. Others are mixtures.
- The maximum 14C activity in samples with low or zero CFC-12 is about 100 pmc. Samples with more than 100 pmc are on mixing lines for old water and post-bomb water. Indication that the pre-bomb 14C is near 100 pmc.
- Age gradients from piezometer nests in feet of water below the water table per ka. Note gradients are higher on the east side of the Rio Grande than the west side. More silt and clay on the west side of the Rio Grande. Gradients of about 0.1 yr/cm, 30% porosity gives about 3 cm/yr
- Indicates high recharge rate at Albuquerque and lower both N and S of Albuquerque. At Albuquerque, at the eastern Mountain Front and beneath the Rio Grande recharge rates are, historically, about 3 cm/yr. Here the flow is nearly vertical. Elsewhere, need a model to interpret recharge rate.
- The minimum at 5ka is the mid Holocene which was warm and dry. Thus higher proportion of snowmelt in Rio Grande at that time. At 15 ka, there must have been both intra-basin recharge and snowmelt. The trend from mid-Holocene to modern suggest times wetter than in the mid-Holocene.
- Over the past 5 ka along the eastern mountain front, if the stable isotope shift can be attributed to temperature change only, it indicates a cooling of 1.4 oC. The shict in the central zone waters may indicate wetter times from mid-Holocene to modern.
- Calibration criteria include water levels, calendar years from 14C, and location of hydrochemical zone boundaries, which are the 10s of ka timescale.
- Basin-wide recharge rate is 7 to 8-fold less than previously thought. Flow from the mountain-front at Albuquerque does not travel all the way west to the Rio Grande, but turns and flows south. Most of the water under Albuquerque is from the Rio Grande and enters the aquifer system north of the city. The groundwater trough in the West-Central zone probably represents a transient in recharge rate. The chemistry defines the long-term flow directions on the 10ka time scale. Water pumped from the aquifer in the inner Valley of the Rio Grande is replaced by river water. Outside of the Inner Valley, withdrawals just leave holes in the aquifer.
- Twelve sources of water identified and mapped throughout the basin. Several hydrochemical zones boundaries were used in conjunction with water levels and radiocarbon ages to calibrate the flow model.
- Did we do anything to help the water situation? Well, we provided a lot more understanding of the severity of water availability in the Albuquerque vicinity. But Albuquerque has bought themselves some time. About the time we started this study, the City initiated the San Juan-Chama Drinking water project. The Albuquerque Bernalillo County Water Utility Authority’s San Juan-Chama drinking water project is expected to supply 70% of the metropolitan areas future water. Under the Upper Colorado River Compact, New Mexico annually receives water from the Upper Colorado River basin for consumptive use. To bring this water into the State, a series of diversions, conveyance channels, pipelines and tunnels and Heron Dam have been constructed. NM has rights to 48,200 acre-feet annually. The Albuquerque Bernalillo County Water Utility Authority is now implementing a long-range water resources strategy that will end their sole reliance on groundwater. Use only the amount of aquifer water that can be replenished- sustainable yield; drawing from the aquifer during periods of drought. The San Juan –Chama portion of water from the Rio Grande will be diverted to public use. Long-term reliability and sustainability; protection of valued environmental resources; project viability; ability to support quality of life; financial feasibility. The annual discharge of the Rio Grande at Albuquerque is about 1,100,000 acre-feet/yr. So the San Juan water amounts to about 5% of the annual discharge. The city uses about 150,000 acre-feet of water per year. They will actually withdraw annually about 94,000 acre-feet and return 47,000 acre-feet as treated water. Today we are already "borrowing" about 60,000 acre-feet/year from the river in the stretch that runs past Albuquerque. We do this by pumping 110,000 acre-feet of water from the aquifer, half of which is being replenished by river water. We don't notice the reduction in flow because it is not happening at a single point, but occurs gradually over several miles. We return about 55,000 acre-feet of water to the river in the form of reclaimed (cleaned) wastewater. For now, the 5,000 acre-foot deficit is made up for by the 23,000 acre-feet of Rio Grande water rights the City owns. When we add our San Juan-Chama water AND reduce pumping to a sustainable amount less water will leave the river to recharge the aquifer. Thus, the net change is minor. Even without the compensating reduction in river-to-aquifer water, the additional 47,000 acre-feet of water that the Water Utility "borrows" in this stretch of the river, is less than 5 percent of the river's flow 1.1 million acre-feet of flow past Albuquerque. For example, in October, when flow is traditionally lowest, this would amount to about ONE TO TWO INCHES of river depth. When flows are very low, the Utility will reduce or eliminate withdrawals altogether and rely on ground water supplies alone until flow is higher. If we protect and preserve the aquifer, we will be able to stop withdrawals from the river during drought periods and revert to use of ground water alone until the drought ends. This is why maintaining a drought reserve is so critical: Even if we held more water rights to river water, it will not be available during the severe droughts that our area periodically has. The Strategy also calls for using a technology called aquifer storage/recovery once the water purification plant is in service. This would enable the Water Utility to take more water from the river when flow is high, purify it, and store it underground until it is needed to meet peaks in demand or during a drought.
- Rio Grande in forefront; Sandia Mountain in background. Sandia is the Spanish name for watermellow; traces back to the mid-1500’s when Spain first entered the area.