You are the chief data scientist of the marketing company �VisualZ.�.pdf
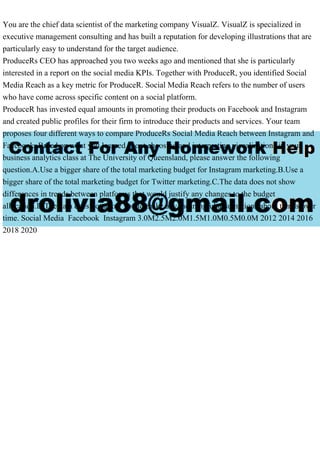
You are the chief data scientist of the marketing company VisualZ. VisualZ is specialized in executive management consulting and has built a reputation for developing illustrations that are particularly easy to understand for the target audience. ProduceRs CEO has approached you two weeks ago and mentioned that she is particularly interested in a report on the social media KPIs. Together with ProduceR, you identified Social Media Reach as a key metric for ProduceR. Social Media Reach refers to the number of users who have come across specific content on a social platform. ProduceR has invested equal amounts in promoting their products on Facebook and Instagram and created public profiles for their firm to introduce their products and services. Your team proposes four different ways to compare ProduceRs Social Media Reach between Instagram and Facebook. Based on what you learned about choosing and interpreting visualizations in your business analytics class at The University of Queensland, please answer the following question.A.Use a bigger share of the total marketing budget for Instagram marketing.B.Use a bigger share of the total marketing budget for Twitter marketing.C.The data does not show differences in trends between platforms that would justify any changes to the budget allocation.D.The data does not allow you to make any meaningful assumptions about trends over time. Social Media Facebook Instagram 3.0M2.5M2.0M1.5M1.0M0.5M0.0M 2012 2014 2016 2018 2020.
Recommended
Recommended
More Related Content
Similar to You are the chief data scientist of the marketing company �VisualZ.�.pdf
Similar to You are the chief data scientist of the marketing company �VisualZ.�.pdf (20)

More from info335653
More from info335653 (12)
Recently uploaded
Recently uploaded (20)
You are the chief data scientist of the marketing company �VisualZ.�.pdf
- 1. You are the chief data scientist of the marketing company VisualZ. VisualZ is specialized in executive management consulting and has built a reputation for developing illustrations that are particularly easy to understand for the target audience. ProduceRs CEO has approached you two weeks ago and mentioned that she is particularly interested in a report on the social media KPIs. Together with ProduceR, you identified Social Media Reach as a key metric for ProduceR. Social Media Reach refers to the number of users who have come across specific content on a social platform. ProduceR has invested equal amounts in promoting their products on Facebook and Instagram and created public profiles for their firm to introduce their products and services. Your team proposes four different ways to compare ProduceRs Social Media Reach between Instagram and Facebook. Based on what you learned about choosing and interpreting visualizations in your business analytics class at The University of Queensland, please answer the following question.A.Use a bigger share of the total marketing budget for Instagram marketing.B.Use a bigger share of the total marketing budget for Twitter marketing.C.The data does not show differences in trends between platforms that would justify any changes to the budget allocation.D.The data does not allow you to make any meaningful assumptions about trends over time. Social Media Facebook Instagram 3.0M2.5M2.0M1.5M1.0M0.5M0.0M 2012 2014 2016 2018 2020