
Recommended
Recommended
More Related Content
Similar to Management, Operations, and Motivation Introduction Functions .docx
Similar to Management, Operations, and Motivation Introduction Functions .docx (20)
More from infantsuk
More from infantsuk (20)
Recently uploaded
Recently uploaded (20)
Management, Operations, and Motivation Introduction Functions .docx
- 1. Management, Operations, and Motivation Introduction | Functions of Management | Mining Group Gold | Leadership Styles | Manufacturing | Facility Layouts | Production | Operations Management | Quality | Motivation Introduction Back to Top Once a business has discovered what customers demand, the goal of the business is to deliver quality products and services. This requires careful planning, organization, leadership, and control to ensure success. These are the functions of management. Delivering quality products and services is not something businesses take lightly. It begins with obtaining raw materials in just the right quantities to be available for the production of finished goods that customers demand. Operations management describes the transformation of raw materials into finished goods. Operations management explains the supply chain and those organizations that work within that domain providing services and products to the next level. It also addresses the physical production process, the manufacturing plant, the storage and distribution facility, and the transportation to the ultimate customer location. Making all of this happen depends on the hard work and dedication of employees. Encouraging employees to carry out the goals of a company and meet the needs of customers is the essence of motivation. Management, operations management, and motivation together help businesses accomplish their goals of meeting and exceeding customer needs and demands with world-class products and services. Functions of Management Back to Top
- 2. After a business is defined, the owner articulates his or her vision for the company, decide the mission or purpose, and establish the values of the company. The owner drives the company toward the future. This, in turn, leads to the development of goals and objectives. Goals are broad initiatives that a company wants to accomplish. Objectives are shorter termed articulations written in support of the goals. They describe how to achieve the goals. Management includes the steps plan, organize, lead, and control. It is a process used to accomplish the goals and objectives of the firm. The body of decision makers who develop a company’s mission, values, and purpose and who set goals and objectives is also referred to as management. Implicit to the functions of management in addition to planning, organizing, leading, and controlling is decision making. Individuals responsible for these functions, including supervision of employees, are managers. Click on image to enlarge Click here for the Text version Planning looks for trends in the business environment. It determines the most appropriate strategy and tactics to attain the desired outcomes of the firm. Managers come together to develop corporate, business level, functional, and operational strategies. These strategies come from strategic, tactical, operational, and contingency planning. Strategic planning is setting broad, long-term goals. Tactical planning sets specific short time-based objectives. Operational planning sets out schedules as well as standards. Contingency planning creates a backup plan. Planning teams are often assembled for purposes of identifying new business opportunities or potential challenges. A common planning tool that a company uses to analyze its strengths, weaknesses, opportunities, and threats is a SWOT analysis. It measures where a company is compared to where it would like to be. Organizing works to carry out a company’s goals and objectives by designing a structure and developing policies and procedures
- 3. for how work will be accomplished. Organizing includes developing systems and conditions for work so that everyone understands how to work together. Leading includes creating and communicating a vision. Components of leading include the development and training of employees as well as helping others to accomplish the strategic tasks on schedule. Controlling is the task of determining where the organization is with respect to accomplishing the strategic initiatives. Controlling includes establishing standards against which to measure performance, as well as deciding the appropriate rewards for success and consequences, along with corrective action for not meeting goals. Managers achieve success for organizations by using their technical skills, human relations skills, and conceptual skills. Mining Group Gold Back to Top Today, more than ever, organizations are built around people working collaboratively with one another in teams. The continued impetus is for the establishment of synergies between team members that can accomplish tasks that are in keeping with an organization’s strategic initiatives and vision. How are talented people working in groups (some, for the very first time with a new group of people) formed into high-performance teams? Along with this question is the issue of the ad-hoc work groups that are placed together to accomplish very specific tasks in a short amount of time. Additionally, there are the required departmental level meetings that are called on some regular basis, either weekly, every two- weeks, or monthly. The expectation is that such meetings are necessary and therefore required. And yet, some people consider such teams to be a waste of time, money, and resources. The Mining Group Gold process is a team process and meeting management process whose sole purpose is to leverage the combined wisdom, experience, and ideas of everyone on the
- 4. team in order to cash in on this wisdom to improve the overall meeting process and to improve the decisions of the organizational unit. Kayser (1995) developed and perfected a method for teams or groups of individuals to maximize and capitalize on their collective effort in a decision meeting venue. Kayser’s steps to Mining Group Gold are to (a) establish a purpose for the meeting; (b) set the outcomes that the group wishes to achieve from the meeting; (c) assign the roles of facilitator, scribe, and timekeeper; (d) set an agenda for the meeting; and (e) perform periodic time checks during the session to keep the group on track and on task. The connection between the Bikhchandani et al. model of observational learning and Kayser’s Mining Group Gold process is that significant behavioral observation and reflection are taking place. The focus is more on the process dynamics that a group uses to reach a consensus rather than on the outcomes directly (Kayser, 1995). Brandt (2001) reported that teamwork assists with understanding in an organizational unit. The author suggests that by fostering an environment of collaboration, managers will be able to positively impact the outcomes of the groups. The appreciation, or understanding, of conflict in a group setting can be made to work for the process rather than against it. Brandt further states that teamwork is imperative with regards to enhancing decision-making and improving communication (Brandt, 2001, p. 32). Brandt additionally posits that it is important to examine the behaviors of the members of the team. The author suggests breaking down the process into the elements of antecedent conditions, perceived conflicts, felt conflict, and manifest behavior (Brandt, 2001, p. 34). Kayser (1995) suggests in Mining Group Gold a methodology for dealing with feelings in a group setting. Brandt states that effective problem solving is only possible when feelings are kept under control. Brandt concludes her article by suggesting five ways to handle conflict in a group setting. They are collaboration, accommodation, avoidance, competition, and
- 5. compromise (Brandt, 2001, p. 35). The following summarizes the key points of the Mining Group Gold meeting process. Mining Group Gold The five basic steps for Mining Group Gold 1. Determine the purpose of the session or meeting. 2. Determine the desired outcomes of the session or meeting. 3. Assign the roles of facilitator, scribe, and timekeeper. 4. Set the agenda. 5. Establish the time allocation for each item on the agenda. *Remember: Mining Group Gold is a process. It is effective for all types of sessions or meetings. Other ideas and concepts to consider: 1. The roles of primary and secondary facilitator 2. The idea of switching hats when you are the facilitator 3. The agenda check *To create an open and collaborative climate or environment, team leaders or facilitators should be objective. Everyone should practice safe-guarding and gate-opening. *When dealing with emotions, use the sub-process of “feelings- facts-solutions.” It is also suggested that all members of the group take a moment of silence to relax. During this time, everyone writes down their feelings in order to express them later. Then, the primary facilitator asks everyone in the group to read what they wrote. From this information, additional and pertinent information is mined, and then a path forward to solve the problem can be determined and implemented. Leadership Styles Back to Top Managers provide a great deal of influence on the success of a company. In addition to developing and communicating their vision for the organization, managers nurture the culture of an organization. This culture is commonly called the organizational or corporateculture and is defined as a
- 6. company’s shared values and sense of unity about achieving corporate goals. Good leaders create a positive environment, one that motivates employees and encourages self-motivation. It is possible to be an effective manager and not be a good leader. The best leaders, however, practice a style that fits a situation at hand. Situational management utilizes the following leadership styles. Autocratic leadership – making managerial decisions without consulting othersParticipative leadership – involving employees with managers in the decision making processFree-rein leadership – setting objectives for which employees are free to do whatever is appropriate to accomplish those objectives Contemporary management practices seek to allow employees to make their own decisions independently. The result is decision making that is timely and closest to the ultimate customer. This practice is called empowerment. Empowerment changes the role of the manager, making it less of a director and more of a coach. For empowerment to be successful, managers need to enable employees with training and education to be able to make the right decisions. Manufacturing Back to Top Satisfying customer needs depends on making products as a result of manual labor or from machines. Often, the scope of what is being produced is large, and machines are used to automate the assembly process. To make or process products, especially by a large-scale industrial operation, is called manufacturing. Throughout history, manufacturing accounted for a majority of the gross domestic product of this country. The economy of the U.S. shifted from being manufacturing based to a service economy, with the service sector accounting for approximately 70% of the U.S. GDP. Manufacturing has evolved into designing machines that can essentially multitask in order to turn out a variety of products.
- 7. This is called flexiblemanufacturing. Leanmanufacturing is an effort to produce more with fewer resources—less human resources, fewer materials, less tools and equipment, and less space. Masscustomization is an effort to make products that satisfy individual customer needs. Facility Layouts Back to Top In a manufacturing business, companies have to organize how they assemble their products. Remember Henry Ford (well, I don’t know him personally either), but he created the assembly line with Ford Motor Company. The purpose was to create a method of mass production that was efficient so he could offer his product to consumer at a lower cost. Today, Mr. Ford’s work continues and with technological advancements many different layouts have been developed to meet today’s manufacturing demands. Some of the layouts companies consider are: process layouts, product layouts (modular layout), fixed-position layouts, and combination layouts. Process Layouts Ever been to the DMV? I know, it was a blast…but the DMV uses a process layout. This type of layout is where a group of processes are put together. For example, you want your driver’s license renewed, there are three windows grouped together for that function. Taking your DMV test, again, the section is created where testing takes place. Layouts like this are also good for customized manufacturing, where you need to group functions together. Product (or Modular) Layouts This layout pays homage to good old Henry Ford. This is an assembly-line type of layout, sometimes called a modular layout, where you need to produce high-volume, continuous flow of products. My father owned a company that produced hair dryers, as such, they assembled the hair dryers in a line, one line was working on the motor and electronics, the other
- 8. line was working on the plastic casing then it was put together at the end. Another example is developing and customizing computers. Dell utilizes modular layout to build custom laptops and personal computers. Fixed-Position Layouts Ok, we have covered small types of layouts, but what happens when you have LARGE products that are too heavy or big to move? You use a fixed-position layout. Remember the Apollo Saturn V rockets? They were massive, and in order to build them, you needed to move around the rocket. Airplanes and large ships are the same way…you need to move around them to build them. You bring the technicians to the area that you are working on and you leave the product in the same place. On the service side, think of a hospital, do they move the patient, or bring the doctors and nurses to their room? Combination Layouts This type of layout is just as it sounds. It can be a combination of the many layouts listed above. You would set up the layout based on product and function and the shop would utilize the appropriate layout as necessary. Production Back to Top Previously, manufacturing accounted for a majority of the United States’ gross domestic product. In that case, production and manufacturing were used interchangeably. Knowledge, labor, land, entrepreneurship, and capital are used to create finished goods and services. Professional managers that assist with such activities are practicing production management. The production process takes the factors of production (or inputs) and creates goods, services, and ideas (or outputs). The production process adds value through the production control function. Steps in the production control function Planning -> Routing -> Scheduling -> Dispatching -> Follow-up
- 9. Manufacturers use different production processes to produce goods. Process manufacturing is a production process that actually changes the nature of the material. The assembly process conjoins components in such a fashion that a product is built. Production processes are either intermittent or continuous. Continuous production processes turn out finished goods over time. Intermittent production processes use short runs of production to meet specific customer needs and are used to make a variety of different products. Modern production techniques include using computers in the design and manufacturing of products. Computer- aided design (CAD) allows designs to be drafted in three dimensions. This removes some of the manual process in the traditional design. Using computers directly in the manufacturing process is computer-aided manufacturing (CAM). Software that merges CAD and CAM is called computer- integrated manufacturing (CIM). Operations Management Back to Top Operations management is a special area within management. It includes such activities as scheduling, quality assurance, and a control function. Operations management planning seeks to solve the problems of manufacturing and the service sector through these activities. It also works on issues of facility planning like the facility location and layout. Ideal facility location conditions favor proximity to production natural resources, transportation, and customers. Operations management uses automation and computers to gain productivity. Materials requirement planning, or MRP, forecasts in the process of planning inventory amounts and replenishment times for component parts that feed the production process. A form of inventory management that attempts to limit the need to carry inventory, ordering a limited amount of component parts for a production process, is just-in-time inventory control.
- 10. Enterprise resource planning, or ERP, is an improvement of MRP that automates all processes of the company, such as accounting or finance and human resources. Quality Back to Top Delivering products and services that meet and often exceed the requirements of customers is quality management. Quality in a production process means producing products and services that meet the standards with each and every production lot. Past procedures to manage quality focused on inspecting the final product. Experience has demonstrated that managing the production process results in greater quality outcomes. Six sigma is a quality control process that seeks to reduce errors to no more than 3.4 defects per one million instances. Statisticalqualitycontrol monitors all aspects of the production process. Statisticalprocesscontrol tests statistical samples of a product at various waypoints during the production process. The International Organization for Standardization (ISO) is a conglomerate of national standards that companies work to uphold through an annual certification process. ISO certification requires developing a quality process and meeting the standards set forth by it. ISO9000 addresses assurance standards and quality management. ISO14000 is used for assessing and improving a company’s environmental impact. Companies that implement quality management practices model the criteria set for the Malcolm Baldrige National Quality Award. This award recognizes organizations that demonstrate quality in business results, human resources, leadership, customer focus, strategic planning, and process management, to name a few. Operations management strives to deliver products on time, according to specifications, and on budget. A couple of programs used to maintain control of the production process are the program evaluation and review technique, known as PERT
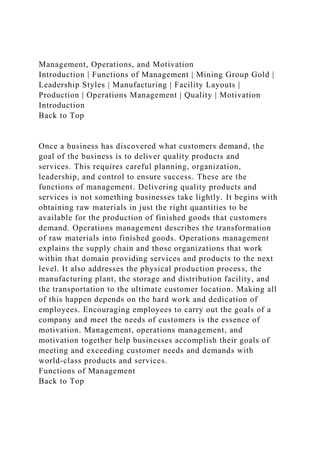
- 11. and the Gantt chart. PERT analyzes tasks and their sequencing as well as the time for each task to identify the critical path or the longest time to complete the sequence of tasks. A critical path is important to measure where delays in a production process can cause a project to become behind schedule. Gantt charts are bar charts that display which projects are in production and what stages they are in at any given time. The following are examples of a Gantt and a PERT chart. Click on image to enlarge Click here for Description Gantt Chart for a Doll Manufacturer Description The Gantt shows a hypothetical process for a doll manufacturer. In this example, there are six main tasks to be completed. They include molding the doll heads, molding the bodies, cutting the fabric, sewing the doll clothes, assembling the doll, and painting the doll. Each task requires a period of time to complete and is depicted with a bar graph depicting the time to complete each task. This example shows that the entire process takes 7 weeks to complete. Press the ESC key to close the image description and return to lecture. Click on image to enlarge Click here for Description PERT Chart for a Video Description The PERT chart example depicts all tasks to be completed for creating a music video. The most important tasks are on the critical path. If any of these tasks is delayed, then project completion will be delayed. The critical path is 15 weeks long and includes the tasks of choosing a star and song, designing the set, purchasing the set materials, constructing the set, rehearsing the dance, and filming the video. There are other important tasks as well. These other tasks are not on the critical path and thus minor delays will not impact the total project
- 12. completion time. However, if there is a significant delay, then the critical path can be impacted. Press the ESC key to close the image description and return to lecture. Motivation Back to Top Management, operations, and the delivery of quality products depend on people. Recognizing the value of employee contributions is the sign of an excellent organization. Feeling valued and appreciated can be very motivating, and motivated employees are inspired to perform. Motivation is a call to action or an inducement to act. It comes either from within, which is intrinsic motivation, or as a result of external stimulus, which is extrinsic motivation. Understanding motivation can be very powerful for successful management of an organization. A simple thank you can inspire a sense of value and appreciation in an employee. Open communication can also be very inspiring to employees. More formal strategies to inspire motivation are job enrichment, wherein the characteristics of a job, or the work itself, are emphasized. Job enlargement combines tasks to make work more interesting. Job rotation is the process of rotating employees between various jobs. Motivational theory originated from Frederick Taylor. Taylor is considered to be the father of scientific management. Scientificmanagement focused on gaining efficiency by evaluating the tasks associated with completing work and trying to improve technique. Behavioral management theorists, beginning with Elton Mayo, who learned from the Hawthorne studies that a Hawthorne effect could result when employees feel part of something or a sense of purpose, eventually overshadowed scientific management. Behavioralmanagement theory takes into consideration the human relations aspect of accomplishing work and motivation. Popular behavior management theories include Abraham Maslow’s hierarchy of needs, which states that people are motivated to satisfy unfulfilled needs. These needs range from physiological needs
- 13. to safety, social, esteem, and self-actualization needs. Frederick Herzberg presented a two-factor theory that includes motivators that lead to satisfaction and hygiene factors that relate to the job environment. They do not necessarily motivate employees but can cause dissatisfaction if missing. Douglas McGregor presented TheoryX and TheoryY, which have opposing views regarding how people view work. Theory X is built on the premise that people dislike work, which gives rise to an autocratic management style. Theory Y suggests that people like work, which lends itself to a democratic management style and empowerment. William Ouchi blends Theory X and Theory Y by adding lifetime employment and consensual decision making to the ideals of Theory X and Theory Y with his Japanese approach, Theory Z. Additional theories of motivation that shape the modern practice of empowerment were derived from the expectation that good performance is rewarded, or effort results in an outcome which describes the expectancytheory. The equity theory involves maintaining fairness, or a balance of inputs and outputs. The goal setting theory establishes aggressive goals that are attainable to motivate employees. Management by objectives seeks to discuss goals with employees and to evaluate progress toward established goals. Finally, reinforcement theory sends positive and negative reinforcement to motivate good performance and discourage poor performance. References Bikhchandani, S., Hirshleifer, D., & Welch, I. (1998). Learning from the behavior of others: Conformity, fads, and informational cascades. Journal of Economic Perspectives, 12(3), 151-170. Brandt, M. A. (2001). How to make conflict work for you. Nursing Management, 32(11), 32-35. Kayser, T. A. (1995). Mining group gold: How to cash in on the collaborative brain power of a group (2nd ed.). New York: McGraw-Hill. Sarvis, R. J. (2004). The impact of the decision theatre method
- 14. of learning on orientation courses for freshmen students attending Our Lady of the Lake University (Doctoral dissertation). Retrieved from ProQuest Dissertations and Theses database. (AAT 3131370) Summer 2014 A Mixed Methods CUMULATIVE ACTIVITY: Grant Writing and Program Evaluation For this assignment you are going to bring together some of the work that we have done in both quantitative and qualitative research, to set up a mixed methods study. Specifically, you are going to plan how you would write a grant proposal for a new program in a hypothetical school district. You will include ideas about how you would assess the proposed program’s effectiveness (e.g., on students’ learning, teachers’ satisfaction, parents’ involvement or other). To make it somewhat easier you will focus on a plan to write a grant proposal to study cooperative learning in a medium-sized, ethnically-diverse school district. In the real world, the following process could take weeks, even months of meetings—you have a few hours. Here is the information you will need and the ground rules: The Lots of Bucks Corporation has invited us at CSUDH in the COE to submit a proposal for a $500,000 Effective Teaching grant. To qualify for the grant we must involve at least 50 teachers in a two-year staff development program to train them to effectively use cooperative learning instructional strategies. Assume that this district has a traditional nine-month academic calendar.
- 15. Description of District. The Unified School District (USD) has 53 schools (40 elementary, 8 middle and 5 high schools). The district is 30% Black, 30% Hispanic, 30% Non Hispanic White and 10% Asian. The district is lower middle class and has a history of tension between ethnic groups. Test scores are lower than other districts in the state, even when socioeconomic factors are controlled. Following are two sample quantitative goals with objectives. Your job for part one of this proposal is to write two of your own quantitative goals that have two objectives each, and to write two qualitative research questions. SAMPLE QUANTITATIVE GOALS AND OBJECTIVES Sample Goal 1. The percentage of total class time devoted to cooperative learning and the skill with which teachers implement it will increase during the two years of the grant. Sample Objective 1. A. From Month 1 to Month 18, Experimental Teachers (n=50) will increase the percentage of class time spent in cooperative-learning activities by at least 15% (based on observations of in-class instruction and lesson plans). Sample Objective 1. B. From Month 1 to Month 18, Experimental Teachers (n=50) will increase the skill with which they model the critical features of cooperative learning by at least 75% (based on observations of in-class instruction). Sample Goal 2. Appreciation of diversity will increase during the course of the grant. Objective 2. A. From Month 1 to Month 18 the number of cross- ethnic positive interactions in the Experimental Schools will increase by 10% (based on observation checklists concerning seating proximity during lunch and assemblies, playmate
- 16. interactions during recess, etc). Objective 2. B. From Month 1 to Month 18 the number of ethnically-motivated incidents reported to personnel at the eight Experimental Schools will decline by at least 20%. SAMPLE QUALITATIVE RESEARCH QUESTIONS 1. How will teachers feel about their working/teaching environment after implementation of Cooperative Learning? 2. How will students view the change in their learning environment? REVIEW: Go back and reread the sample goals and objectives. What is the independent variable for each? What is the dependent variable for each? IMPORTANT NOTE: YOU MAY NOT WRITE GOALS, OBJECTIVES, OR QUALITATIVE RESEARCH QUESTIONS MEASURING THE SAME DEPENDENT VARIABLES THAT I USED FOR THE EXAMPLES. Be VERY careful; using what I have given as examples has been a common error of students in the past. YOU MAY NOT HAVE 9 MONTH OBJECTIVES—ALL MUST BE 18 MONTHS. OK— TIME TO GET STARTED! Begin by spending about 5-10 minutes working quietly, ALONE. Use the chart on the next page and come up with some ideas about things that might happen if the quality of instruction increased dramatically. You many then share your ideas with your teammates if you choose to run your ideas by them. It is
- 17. not required that you do so—you may begin on your own. Next, settle on a total of two quantitative and two qualitative outcomes that will be specific to your plan. At least one of your qualitative outcomes must be in the affective (attitude) domain. OUTCOMES LIST TEACHERSSTUDENTSOTHERS After choosing your outcomes, you will have to: 1) construct specific objectives to assess if the goals are achieved, and 2) write two qualitative research questions. The forms to fill in with your goals, objectives and qualitative research questions begin on the next page. Keep in mind that goals are general and objectives are specific. Objectives must specify WHO, WHAT, WHEN AND HOW MUCH. See the Check Sheet for Cumulative Activity Part 1 for a preview of how you will be “checking” your objectives. You must use the following form sheets to complete this activity. Do not turn this into a paper. It is an activity—not a research paper. However, do use complete sentences and be careful to reread your writing for clarity and grammar. Form Sheets for Cumulative Activity Part 1 Lots of Bucks Corporation Teaching Effectiveness Grant Plan The following goals, objectives and research questions would be the focus for the two-year duration of the proposed cooperative learning staff development program. GOAL 1 OBJECTIVE 1-A OBJECTIVE 1-B GOAL 2 OBJECTIVE 2-A OBJECTIVE 2-B QUALITATIVE RESEARCH QUESTION #1
- 18. QUALITATIVE RESEARCH QUESTION #2 Check Sheets for Form Sheets for Cumulative Activity Part 1 Use the following form to “check” your objectives. You may consult with your teammates for this checking activity. This is not a critiquing exercise, it is an editing exercise, so please do not ask questions or talk to the other person who is checking your ideas during this exercise. I want you to read the other person’s objectives without any clarification, in order to help him/her find strengths and weaknesses before they are handed in to me for points. Remember, objectives must be very specific and give the following information: 1) who will be affected—experimental ELL students, all teachers in the district, etc.; 2) what is going to change—SAT scores, monthly attendance, etc.; 3) how much change is going to take place—10%, 20 students, etc.; 4) when—by the end of the grant, from month 1 to month 18, etc. and; 5) how the change (or gain) is to be measured—based on school attendance records, monthly classroom observations by the research team, etc. Check Sheet for Cumulative Activity Part 1—self check form OBJECTIVE 1A WHO: _____________________________________________________ _________ WHAT: _____________________________________________________ _________ HOW MUCH: _____________________________________________________ ____
- 19. HOW MEASURED: _____________________________________________________ WHEN _________________________________________ OBJECTIVE 1B WHO: _____________________________________________________ _________ WHAT: _____________________________________________________ _________ HOW MUCH: _____________________________________________________ ____ HOW MEASURED: _____________________________________________________ WHEN _________________________________________ OBJECTIVE 2A WHO: _____________________________________________________ _________ WHAT: _____________________________________________________ _________ HOW MUCH: _____________________________________________________ ____
- 20. HOW MEASURED: _____________________________________________________ WHEN _________________________________________ OBJECTIVE 2B WHO: _____________________________________________________ _________ WHAT: _____________________________________________________ _________ HOW MUCH: _____________________________________________________ ____ HOW MEASURED: _____________________________________________________ WHEN _________________________________________ Check Sheet —teammate OBJECTIVE 1A WHO: _____________________________________________________ _________ WHAT: _____________________________________________________ _________ HOW MUCH: _____________________________________________________ ____
- 21. HOW MEASURED: ____________________________________________________ WHEN _________________________________________ OBJECTIVE 1B WHO: _____________________________________________________ _________ WHAT: _____________________________________________________ _________ HOW MUCH: _____________________________________________________ ____ HOW MEASURED: ____________________________________________________ WHEN _________________________________________ OBJECTIVE 2A WHO: _____________________________________________________ _________ WHAT: _____________________________________________________ _________ HOW MUCH: _____________________________________________________ ____
- 22. HOW MEASURED: _____________________________________________________ WHEN _________________________________________ OBJECTIVE 2B WHO: _____________________________________________________ _________ WHAT: _____________________________________________________ _________ HOW MUCH: _____________________________________________________ ____ HOW MEASURED: _____________________________________________________ WHEN _________________________________________ Cumulative Activity Part 2: Evaluation Planning Now that you have constructed Quantitative Goals with Objectives and Qualitative Research Questions for your $500,000 grant proposal plan, you need to tell the granting agency exactly how you would evaluate your quantitative objectives and answer your qualitative research questions. Specifically, you need to tell the granting agency how you will pick the schools, the 50 teachers and the students (as appropriate to your proposal). In other words, who will participate in the program? Will it be volunteer schools? Low- achieving schools? Randomly-selected schools? How will you
- 23. pick the teachers within each of the schools? If the objectives are written as a gain score from the start of the program to the end (Month 1 to Month 18) a One-group Pretest Posttest Design is suggested. However, you might consider a stronger design—but you will need to make sure you reread your goals and objectives since they “drive” the design. The quantitative group designs must be the strongest designs possible, bearing in mind the real-world difficulty of doing action research in public education. If you have an objective that calls for 50 teachers who will receive cooperative-learning training to be compared with 50 comparison teachers, in some way, you may use one of the designs that have Control or Comparison Groups, such as the Nonequivalent Control Group Design. AGAIN, check your goals and objectives—you may need to rewrite/modify them at this point. When you finish this activity you will have constructed evaluation designs for those objectives. You will probably use the same evaluation design for both objectives, such as the One- group Pretest Posttest and that is ok, as long as it is correct. (-: Next, reread your two Qualitative Research Questions. How will you carry out the needed research to answer that one question? Who will be involved, the teachers, the students, the parents, others? How many participants will be involved? Which qualitative sampling method(s) will you use? How will you analyze the data? How will you know if the intervention (Cooperative Learning) was successful? The answers to these questions will be the basis for the evaluation of the qualitative portion of your proposal. Evaluation Design INSTRUCTIONS For all objectives you will explain the following, using the form sheets that follow. How will you select the schools, teachers, and students?
- 24. If you select 10 schools based on low test scores, then get volunteer teachers from each of the 10 schools by offering $2000 stipends for participating in staff development, you have purposive cluster sampling of the schools and convenience sampling of 5 teachers from each of the schools.) Name the Group Research Design to be used and explain exactly how you will implement the design. (e.g., if you used the sampling method described above you would use a One-group Pretest Posttest Design if you compared the amount of time the teachers chosen for the study used cooperative learning in their classes at the beginning of the study to the time they used cooperative learning at the end of the study.) By the way, you cannot use time spent using cooperative learning as an outcome because I used it as an example. Name and explain two possible threats to internal or external validity in the design described above. You need to tell why these two threats are most likely to occur and how you could control them. Next, address the two qualitative research questions you wrote. Name the qualitative sampling method(s) you would use. Explain why that method is the best to use for this study. Describe the participants who will be involved (teachers, students, parents, others). Explain approximately how many, and why they will be chosen to participate. Describe the type(s) of qualitative data you will collect. Describe how you would analyze the qualitative findings. Evaluation Design Form Sheet for Cumulative Activity Part 2 1. Goal 1 Objective A
- 25. A. Sampling: How will you select the schools, teachers students? B. Group Research Design to be used and explanation of exactly how it would be implemented. C. Possible threats to internal or external validity, named and explained. 2. Goal 1 Objective B A. Sampling. B. Group Research Design & Implementation C. Name and explain threats to validity. 1. Goal 2 Objective A A. Sampling: How will you select the schools, teachers students? B. Group Research Design to be used and explanation of exactly how it would be implemented. C. Possible threats to internal or external validity, named and explained. 2. Goal 2 Objective B A. Sampling. B. Group Research Design & Implementation C. Name and explain threats to validity. 3. Qualitative Research Questions A. Name the qualitative sampling method(s) you will use. Explain why that method is the best to use for this study.
- 26. B. Describe the participants who will be involved (teachers, students, parents, others). Explain how many, and why they will be chosen to participate. C. Describe the type(s) of qualitative data you will collect. D. Describe how you will analyze the qualitative findings. 2