2. M. Hassan et al. / Precambrian Research 241 (2014) 104–128 105
N
Zaghra
formation
El-Rayan formation
2km
28º 39´
(b)
34º 04´
El-Fringa
metagabbro
Agramyia formation
Syn- and post-
tectonic granitoids
39º
24º
28º
Red
Sea
Hafafit
Meatiq
Sibai
Kid
Taba
Sa'al
Feiran-Solaf
Qazaz
Hamadat
Wajiyah
Marsa
Alam
Hurghada
Quseir
Jiddah
Arabian-NubianShield
(a)
36º33º
Gneiss complex
Strike-slip
East-African
volcanic system
N
Arabian-NubianShield
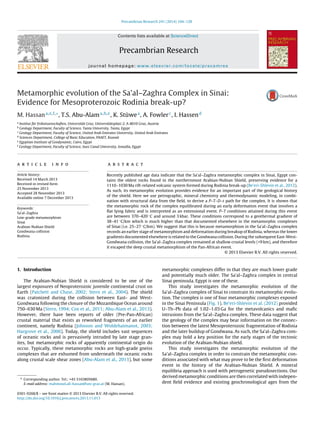
Fig. 1. (a) Geometry of the Arabian-Nubian Shield showing the volcanic-arc system, the amphibolite facies gneiss complexes, Najd Fault system and sutures of the shield
(modified after Abu-Alam and Stüwe, 2009). Sinai is shown in white indicating it may not have been exclusively part of the Arabian-Nubian Shield during the formation. (b)
Simplified geological map of the Sa’al–Zaghra complex (modified after Shimron et al., 1993; Fowler, unpublished data).
Sa’al–Zaghra complex and other complexes elsewhere in the shield.
The results are discussed in the context of the tectonic evolution of
the Arabian-Nubian Shield.
2. Geological setting and lithologies
The Arabian-Nubian Shield is mostly composed of low-grade
volcano-sedimentary associations referred to as arc-assemblage
that contain some metamorphic complexes in between this arc-
assemblage (e.g. Meatiq and Migif-Hafafit; Fritz et al., 1996, 2000,
2002) (Fig. 1). In Sinai four such complexes are known: Kid,
Taba, Feiran–Solaf and Sa’al–Zaghra with the former three being
of amphibolite and granulite facies metamorphic grade and the
Sa’al–Zaghra being much lower grade. The arc-assemblage is char-
acterized by brittle-ductile deformation (Noweir et al., 2006; Abd
El-Wahed and Kamh, 2010; Johnson et al., 2011) that meta-
morphosed at lower greenschist facies metamorphic conditions
(Noweir et al., 2006; Abu-Alam et al., unpublished data).
The evolution of the Arabian-Nubian Shield probably involved
at least four main deformation events (Sultan, 2003; Hegazi
et al., 2004; Fowler and Hassen, 2008; Fowler et al., 2010a,b;
Moghazi et al., 2012). D1 deformation phase is synchronous with
the prograde metamorphism in both Kid and Taba metamorphic
complexes and D2 occurs during peak metamorphism in both
Taba and Kid complexes (Abu El-Enen et al., 2003a,b; Abu El-
Enen et al., 2004; Eliwa et al., 2004; Abu El-Enen, 2008). For
the Feiran–Solaf metamorphic complex, the deformation events
(D2–D4) have been correlated with other parts of the shield (Abu-
Alam and Stüwe, 2009; Abu-Alam et al., 2010), but the first
deformation event D1 and its relevance for the shield are not well
understood.
The Sa’al–Zaghra complex of southern Sinai (Fig. 1) includes
mainly low-grade metamorphosed volcano-sedimentary associa-
tions referred to as the “Sa’al Group” that are surrounded by large
volumes of syn- and post-tectonic granites. The Sa’al Group is
divided into three formations (Shimron et al., 1993) (Fig. 2). (a)
El-Rayan Formation occupies a rugged terrain extending ENE-WSW
in the northern part of the complex. The El-Rayan Formation in
the west consists of a thickly layered sequence of basaltic andesite
and andesite at its base, followed by layered felsic tuffs, rhyolite
lava flows, rhyolite crystal tuffs and ash tuffs. In the eastern part
of Wadi Sa’al, it is represented by layered felsic tuffs. In the cen-
tral upper part of the complex, around the junction of Wadi Sa’al
and Wadi El-Rayan, there were wide exposure of phyllite extending
northward (Fig. 3a).
(b) Agramyia Formation occupies the central part of the belt and
is dominated by volcano-sedimentary rocks (Fig. 2). It is composed
of a ∼2300 m thick interbedded sequence of tuffs and lapili tuffs
(Fig. 3b) succeeded by rhyolitic ignimbrite (Fig. 3c) intercalated
with fine tuffs, other pyroclastics and sedimentary beds of silt-
stone, sandstone, and conglomerates with some sheets and layers
of andesitic lava (Shimron et al., 1993). (c) Finally, Zaghra Forma-
tion in the south of the belt is composed of conglomerates (Fig. 3d),
sandstones, slates with minor calc-silicates bands, metamorphosed
volcanogenic litharenite and arkoses. There is a localized zone of
concordant, foliated red granite sheets intruded along the sand-
stone and slate bands of Zaghra Formation (Fig. 3e). These three
formations are separated by two steep ENE-WSW trending thrusts.
The Sa’al–Zaghra area has been intruded by intrusive rocks
ranging in the composition from gabbro, diorites, granodiorite
to alkali-granites that cross-cut the foliation. A NW–SE striking
gabbro-diorite complex “El-Fringa metagabbro” intruded the phyl-
lite and metavolcanics of El-Rayan Formation in the NW part of the
mapped area (Fig. 2). Minor gabbroic intrusions are also found else-
where in the complex. Quartz-diorites crop out at the eastern side of
the study area have crystallization age of 819 ± 4 Ma (Be’eri-Shlevin
et al., 2012). These rocks are rich in amphiboles, coarse-grained,
dark gray in color and enclose xenoliths (metasediments, metavol-
canics and metagabbro) up to 1 m long. Granodiorite which crops
out in the central and southwestern sectors of the area is light gray,
coarse-grained and has plagioclase with amphiboles and quartz and
encloses abundant ovoid enclaves and elongated xenoliths of older
rock types (Fig. 3f). Similar granodiorite to the east of Feiran–Solaf
complex gives a U–Pb zircon age of 782 ± 7 Ma (Stern and Manton,
1987). Alkali-granite is exposed in the central and the western
part of the map area and has a Pan-African age (635–580 Ma; Eyal
et al., 2010). Biotite granite intrudes and shares sharp contacts with
the quartz-diorite and the granodiorites. Weak deformation can be
3. 106 M. Hassan et al. / Precambrian Research 241 (2014) 104–128
Fig. 2. Geological map of the Sa’al–Zaghra complex. Thick lines are faults and thrust planes. Samples locations are shown as circles, while dated samples of Be’eri-Shlevin
et al. (2012) are shown as stars. Dashed line outlines the region where higher grade metamorphic rocks were found.
observed in these intrusive only at their contact with the metavol-
canics and metasediments of the Sa’al–Zaghra complex.
Post-tectonic dykes and sills form local swarms of various
composition, grain-size, thickness, and trends. They dissect the
volcano-sedimentary succession and the intrusive rocks of the
Sa’al–Zaghra complex (Fig. 3g). Similar dykes in the Feiran–Solaf
complex yield Rb–Sr age of 591 ± 9 Ma (Stern and Manton, 1987)
and are affected by later NNE trending faults. Phanerozoic sed-
iments cover the metavolcanics and the phyllitic rocks in the
northern part of the Sa’al–Zaghra Complex.
3. Structural evolution
Structurally, the Sa’al–Zaghra complex shows evidence for three
phases of deformation (Fowler et al., unpublished data). The ear-
liest structures are locally well-developed foliations (S1) that lie
parallel to layering. The S1 foliation (well seen in Fig. 3e) is best
developed in El-Rayan Formation phyllites and schists but are also
evident in the volcanics of Agramiya Formation and the conglomer-
ates of Zaghra Formation. The foliation is accompanied by a NW–SE
oriented stretching lineation defined by stretched objects (lithic
particles and porphyroblasts) in the S1 foliation planes. The foli-
ation is overprinted by all later folding especially as kink folds
that pass directly into more rounded D2 and D3 mesoscopic folds.
The S1 foliations are clearly the earliest tectonic structures in the
Sa’al–Zaghra complex.
Measurements of strain using folded quartz veins on the meso-
scopic and microscopic scale show shortenings normal to S1 of
at least −50% in El-Rayan phyllites (Figs. 3h and 4a). This is also
reflected in the boudinage of quartz veins and dykes along the
S1 foliations. Even higher strains are associated with metamor-
phosed pyroclastics at Wadi Mughafa (see Fig. 2) where deformed
lapilli particles give RXZ values up to 15, which correspond to −75%
shortening normal to S1 and 285% extension in a NW–SE direc-
tion, assuming no dilatation. The fact that the S1 foliation is parallel
to bedding is interpreted that S1 formed while the beds were
originally horizontal. This means that the maximum shortening
strain was vertical and (together with the stretching lineation) the
maximum extension was NW–SE. Vertical shortening and horizon-
tal extension are consistent with D1 extensional tectonic setting.
These foliations clearly predated any significant folding in the
area.
4. M. Hassan et al. / Precambrian Research 241 (2014) 104–128 107
Fig. 3. Representative field photographs of the Sa’al–Zaghra complex. (a) Biotite phenocrysts in wide phyllite exposure at junction of Wadi Sa’al and Wadi El-Rayan. (b)
Pumicious agglomerate in thick interbedded sequence of tuffs and lapili tuffs. (c) Large extended rhyolitic ignimbrite sequence in Agramyia Formation. (d) Metaconglomerates
as representative beds of Zaghra Formation. (e) Primary bedding parallel to foliation invaded by thin sheets of red granites. (f) Metasedimentary enclaves of the Sa’al–Zaghra
complex in later intruded granodiorite. (g) Post-tectonic dykes swarms dissect intrusive rocks of the Sa’al–Zaghra complex. (h) Abundant folded quartz veins with the foliation
as axial plane as a result of vertical shortening.
5. 108 M. Hassan et al. / Precambrian Research 241 (2014) 104–128
The existence of an earliest extensional deformation pre-dating
folding of beds is similar to that described by Fowler and Hassen
(2008) for the Feiran–Solaf metamorphic complex. In both cases
the bulk strain consisted of vertical shortening, with extension in
the plane of the foliation, principally in the NW–SE direction. In
the Feiran–Solaf metamorphic complex, Fowler and Hassen (2008)
argued for a continental rift setting for the Feiran gneisses, and
against other extensional tectonic settings, such as gravitational
collapse, core complex or mantled gneiss dome.
The second deformation event D2 is mainly represented by
ENE–WSW trending folds associates with thrusting. Discordances
between thrust planes and bedding planes are common. In El-
Rayan Formation, D2 is mainly recorded in folds with localized
SSE-ward thrusting contemporaneous with intrusion of the El-
Firinga metagabbro along the thrust planes. The D2 event is a
result of NW–SE shortening which was partitioned between folding
and thrusting. El-Rayan Formation phyllites show open ENE–WSW
trending F2 folds that pass into more common F2 kink fold geom-
etry. The thick volcanic units in the center of the Sa’al–Zaghra
complex (Agramiya Formation) show minimal D2 folding, whereas
the thinner layered units in the SE of the complex (Zaghra Forma-
tion) show common mesoscopic F2 folds. There are generally no
axial planar foliation associated with F2 folds.
The third deformation event D3 is represented mainly by N–S to
NW–SE trending steeply plunging open folds as a result of NE–SW
shortening. The F2 folds are overprinted by this phase, and have
their axial planes and hinges deformed by the D3 deformation. F3
kink folds are found in El-Rayan Formation phyllites. These kink
folds overprint the earlier F2 kink folds.
4. Petrography
The Sa’al metamorphic complex is generally known for being
largely composed of low-grade (greenschist facies) metavol-
canic and metasedimentary rocks. However, some rocks of
amphibolite facies are also present. Low-grade metamorphic
assemblages are found in both main types of metavolcanic rocks
(mafic-intermediate and felsic) and also in the majority of the
metasedimentary rocks. In contrast, rocks of amphibolite facies
grade are only found in felsic metapyroclastic rocks in a limited
area near Wadi Muqafa (Fig. 2).
The low-grade mafic-intermediate metavolcanics are character-
ized by uniform primary texture of interlocking plagioclase laths or
euhedral (0.8 mm in length) plagioclase phenocrysts (Figs. 4b and
5a). The groundmass is made up of fine-grained plagioclase, acti-
nolite needles, chlorite, biotite, opaques and/or sphene (Figs. 4c
and 5b). Clinozoisite granules concentrate at the plagioclase mar-
gins. There are amygdales filled by polycrystalline quartz. Quartz
and epidote veinlets may be found. The foliation, where present,
is defined by the preferred orientation of chlorite, biotite and in
places actinolite.
The felsic metavolcanics are represented as thinly banded low-
grade meta-tuffs or flow banded lava composed mainly of quartz
and plagioclase phenocrysts (up to 3 mm) with a groundmass
of finer quartz, fine lamellar-twinned plagioclase and K-feldspar.
Micas define a weak foliation in addition to specks of chlorite and
sericite. Granules of clinozoisite and small secondary plagioclase
grains are common. Ignimbrites have well preserved plagioclase
phenocrysts that are overgrown by microcline. There are also fine-
grained lithic particles rich in opaques.
Low-grade metasedimentary rocks are commonly metapsam-
mites that contain ellipsoidal, rather angular quartz grains with
variable grain size (less than 1 mm in diameter) and detrital
sericitized plagioclase and microcline grains in addition to mica
(Fig. 5c). Foliation is defined by substantial amounts of fine-grained
(less than 0.3 mm) biotite, white mica, clinozoisite, chlorite and
amphiboles (Fig. 4d). Important is the occurrence of up to 1 mm
sized aggregates of fine-grained mica are interpreted as alteration
products replacing former cordierite porphyroblasts (Fig. 5d).
Opaque granules are found as porphyroclasts or tiny grains along
grain boundaries. In some places, the metasedimentary rocks
contain minor impure carbonate interlayers within the metap-
sammites. In these metacarbonates, a calcsilicate assemblage of
epidote, garnet and diopside occurs (Fig. 5e).
Amphibolite facies assemblages were found only in some rocks
of Zaghra Formation, in particular near Wadi Muqafa (dashed line
in Fig. 2). In this area, rocks of pelitic bulk composition have a por-
phyroblastic texture with andalusite or garnet porphyroblasts. In
sample 215b (Figs. 4e and 5f), garnet porphyroblasts (up to 2 mm)
lie randomly within a foliated groundmass made of muscovite,
chlorite, albite, K-feldspar and quartz (0.1 mm). The porphyroblasts
contain inclusions of quartz and muscovite. These inclusions are
oriented parallel to the external foliation indicating post-tectonic
origin of the porphyroblasts. In sample 273a (Fig. 5g), anhedral
andalusite porphyroblasts (less than 1 mm) have grown over a foli-
ated matrix of biotite, muscovite, plagioclase, K-feldspar and quartz
(up to 0.2 mm) also indicating a post-tectonic origin for the porphy-
roblasts. It is worth mentioning that small euhedral to subhedral
sillimanite crystals (0.2 mm in length) grow obliquely to the foli-
ation and surrounding the andalusite porphyroblasts (Figs. 4f and
5h). A rim of muscovite surrounds the alumino silicates and sepa-
rates them from the biotite in the groundmass. K-feldspar grains in
contact with the muscovite and andalusite porphyroblasts are finer
than the feldspar and quartz grains of the groundmass. Muscovite
and quartz inclusions can be found in the porphyroblasts.
In summary, we conclude that there is low-grade equilibrium
assemblage of actinolite, chlorite, feldspar, clinozoisite, opaques
and quartz for the metavolcanic rocks, in addition to mica in the
metasedimentary rocks. Thin section studies show that the S1 foli-
ation is defined by metamorphic layer silicates chlorite, muscovite
and biotite. Pressure shadows adjacent to resistant lithic particles
and phenocrysts are also filled with these metamorphic phases.
Brittly segmented grains are healed by fibrous growths of these
metamorphic phases. The S1 foliation thus formed during the main
metamorphic event in the area that we term M1.
The apparently higher grade assemblages found in selected
locations inside Zaghra Formation are made up of either (a)
biotite, muscovite, feldspar and quartz forming a foliated (S1)
matrix around andalusite-sillimanite porphyroblasts or (b) mus-
covite, chlorite, feldspar and quartz foliated groundmass enclosing
garnet porphyroblasts. These porphyroblasts are not perceptibly
deformed and overgrow S1. The spatial association of these higher
temperature assemblages with S1 foliation-concordant red gran-
ite sheets that also show a tectonic gneissosity parallel to S1 is
interpreted to indicate a role of contact metamorphism in the for-
mation of the higher grade phase assemblage. This higher grade
metamorphism occurs either late in D1 or between D1 and D2.
5. Mineral chemistry
Mineral analyses were carried out for 27 rock samples
(total 866 spot analysis) at the Institute of Earth Science, Karl-
Franzens-Universität Graz, Austria, using a JEOL JSM-6310 scanning
electron microscope following standard procedures, operating in
EDS/WDS mode at 5 nA beam current, accelerating voltage of
15 kV and counting time of 100 s. Mineral formula were cal-
culated using AX program (http://www.esc.cam.ac.uk/research/
research-groups/holland/ax) and based on 8 oxygen atoms for the
feldspar, 12 oxygen atoms for the garnet, 11 oxygen atoms and
ignoring H2O for mica, 23 oxygen atoms and ignoring H2O for
amphiboles and 14 oxygen atoms and ignoring H2O for chlorite. The
6. M. Hassan et al. / Precambrian Research 241 (2014) 104–128 109
Fig. 4. Photomicrographs of petrographic features in metavolcanic and metasedimentary rocks of the Sa’al–Zaghra complex. (a) Folded quartz veins as a result of vertical
shortening. (b) Subhedral plagioclase phenocryst surrounded by fine-grained groundmass contains plagioclase, chlorite, opaques. (c) Weak foliation in the low-grade mafic-
intermediate metavolcanics, defined by the preferred orientation of chlorite. The plagioclase phenocryst is slightly altered to epidote. (d) Micas define a weak foliation in
metasedimentary rocks. Note micas grow in the strain shadow of opaque porphyroclasts. (e) Garnet porphyroblast cutting the metamorphic foliation and contains inclusions
of quartz oriented parallel to the external foliation indicating post-tectonic origin. (f) Small euhedral to subhedral sillimanite crystals grow obliquely to the foliation.
mineral abbreviations, which will be used in the following sections,
are from Holland and Powell (1998).
Plagioclase is mostly andesine in the mafic-intermediate
metavolcanic showing a small range in composition with lim-
ited zonation and has Xan [Ca/(Ca + Na)] = 0.30–0.40 (Table 1).
Oligoclase is the dominant plagioclase in the felsic metavolcanic
showing a small range in composition and has Xan = 0.10–0.22.
In metasedimentary rocks, plagioclase composition is variable
and chemical compositions of albite, oligoclase and andesine
were analyzed (Tables 2–5). Potassium feldspar is absent in the
mafic metavolcanics, abundant in the intermediate and the felsic
metavolcanics, and is the dominant feldspar in the metasedimen-
tary rocks. Intrusive granitic rocks have andesine plagioclase with
a small range in composition Xan = 0.26–0.44.
7. 110 M. Hassan et al. / Precambrian Research 241 (2014) 104–128
Fig. 5. Back-scattered electron images of petrographic features in metavolcanic and metasedimentary rocks of the Sa’al–Zaghra complex. (a) Uniform texture of plagioclase
phenocrysts with partially transformed amphibole to chlorite (intermediate metavolcanic). (b) Intermediate metavolcanic with plagioclase, actinolite needles, and chlorite,
in addition to opaques and clinoziosite as accessory minerals (intermediate metavolcanic). (c) Substantial amount of fine-grained biotite, white mica, and clinozoisite in
plagioclase and quartz (meta-sandstone). (d) Cordierite porphyroblasts (bounded with dashed line) that are completely altered to micas surrounded by epidote in quartz rich
groundmass (micaschist). (e) Calcsilicate assemblage of epidote, diopside and garnet (metacarbonate-sedimentary rocks). (f) Garnet porphyroblasts overprinting foliation
of chlorite, muscovite, albite, K-feldspar and quartz (garnet bearing metasedimentary rocks, sample 215b). (g) Muscovite rim separating andalusite porphyroblast from
surrounding biotite in quartz-rich groundmass (alumino silicates-bearing metasedimentary rocks, sample 273a). (h) Euhedral to subhedral sillimanite crystals grown up
oblique to the muscovite foliation surrounding the andalusite porphyroblasts (alumino silicates-bearing metasedimentary rocks, sample 273a).
17. 120 M. Hassan et al. / Precambrian Research 241 (2014) 104–128
Fig. 6. Mineral chemistry. (a) Si versus Mg/(Mg + Fe2+
) for the studied amphiboles. Classification is after Leake et al. (1997). (b) Chlorite chemistry of metavolcanics and
metasediments showing its distribution with respect to end members and XFe content. (c) Chlorite chemistry of metavolcanics and metasediments showing differences in
MnO, MgO and FeO contents. (d) Garnet chemistry of metasedimentary rocks and metacarbonates in terms of Mn, Ca and Fe2+
end members. (e) Profile illustrating the change
of garnet chemistry across a garnet crystal in metasedimentary rock. (f) Pressure–temperature plot with Si isopleths for white mica, Si content per formula unit. The gray
area represents the composition of the studied white micas.
The amphiboles of the studied samples are calcic amphiboles
with a homogenous composition of magnesio hornblende (Fig. 6a).
Amphiboles in all studied rocks have a total number of cations of
Na + K less than 0.50 and low Ti content (0.01–0.13). Total alu-
minum contents Alt of the amphiboles of metavolcanic rocks are
normally higher than those in metasedimentary rocks (Tables 1 and
2). There is no significant differences in Alt content of the amphibole
of the intrusive granitoids.
Chlorite is common to all rock types except the alumino
silicates-bearing metasedimentary rocks. The chlorite in the
metavolcanics has XFe = 0.31–0.54, while in the metasedimentary
rocks (Table 3), it has a wide range of XFe = 0.18–0.62 (Fig. 6b).
Large difference in composition of chlorite in the same sample is
distinguishable in some of the metasedimentary rocks. Mn-rich
chlorite is characteristic of the garnet-bearing metasedimentary
rocks (Fig. 6c).
18. M. Hassan et al. / Precambrian Research 241 (2014) 104–128 121
Fig. 7. Estimated pressure and temperature conditions of the low-grade metavolcanic and metasedimentary rocks based on the reactions between the mineral end-members.
Calculation done using THERMOCALC (Powell and Holland, 1988).
Garnet is observed just in two lithologies as grossular garnet
in metacarbonate sediments with end-members activity of Alm0.30
Grs0.70 (Fig. 6d) and as spessartine in the metapelitic rocks with
end-member activity of Sps0.67 Alm0.20 Grs0.12 Prp0.01 (Table 4). The
garnet of the metapelitic rocks exhibits chemical zonation as a Ca-
rich rim (Fig. 6e) with XCa = [Ca/(Fe + Mg + Mn + Ca)] in the range of
0.14–0.16. The XFe = [Fe/(Fe + Mg + Mn)] of the garnet is 0.12, 0.21
and 0.29 for the core, intermediate and rim zones, respectively
(Fig. 6e).
Biotite is absent in the mafic metavolcanics, abundant in
the intermediate and the felsic metavolcanics, while it is dom-
inant in the metasedimentary rocks. Biotite has low Ti content
19. 122 M. Hassan et al. / Precambrian Research 241 (2014) 104–128
in all samples with 0.01–0.17 cations per formula unit. The
composition of biotite is relatively similar in all samples with
XFe = [Fe/(Fe + Mg)] = 0.27–0.51 with an average of 0.4 (Table 3).
Silica cations in the biotite of alumino silicates-bearing metasedi-
mentary rocks have a range of 2.80–2.85 atoms of Si per formula
unit.
Muscovite is compositionally variable. It has a XNa [Na/(Na + Ka)]
up to 0.16 and XFe [Fe/(Fe + Mg)] = 0.16–0.86. All muscovites have
low Fe and Mg content. In the alumino silicates-bearing rock, mus-
covite of the groundmass has silica cations in the range of 3.14–3.17,
while silica cations of the muscovite inclusions in the andalusite
porphyroblasts range between 3.06 and 3.08 (Table 5). The mus-
covite inclusions in the garnet porphyroblasts have Fe contents in
the range of XFe = 0.06–0.07, while a higher range (0.18–0.26 atom
of Fe per formula unit) was calculated from the muscovite of the
groundmass.
6. Pressure and temperature estimates
In order to estimate the metamorphic conditions, THERMOCALC
(Powell and Holland, 1988) was used to calculate independent sets
of reactions between the mineral end-members of the metavol-
canics and the metasediments using the internally consistent
dataset of Holland and Powell (1998). THERMOCALC was also used
to calculate P–T pseudosections for the garnet- and the alumino
silicates-bearing metasedimentary rocks. Al-in-amphibole was
used to calculate the pressure conditions of the granitic intrusions
based on the calibration of Schmidt (1992), while amphibole-
plagioclase exchange thermometer with the calibration of Holland
and Blundy (1994) was used to estimate the intrusion temperature.
For the low-grade metavolcanic and metasedimentary rocks inde-
pendent sets of reactions between the mineral end-members
were carried out on three metamorphic mineral assemblages.
The first mineral assemblage (actinolite + chlorite + plagioclase + K-
feldspar + clinozoisite + magnetite + quartz ± mica) indicates that
the metavolcanics and metasediments were metamorphosed
regionally in a greenschist facies conditions. For a quantitative
determination, three metavolcanic and one metasedimentary rock
were analyzed. Fig. 7 shows the calculated independent reactions
and the average pressures and temperatures derived from them. All
four samples give comparable metamorphic conditions that range
between 370 ◦C and 420 ◦C and around 3 kbar (Fig. 7).
For the apparently higher grade assemblage similar calculations
were done. Calculations of independent end member reactions
showed that the assemblage and + bi + mu + plag + ksp + q equil-
ibrated at conditions around 3.0–3.5 kbar and 610–630 ◦C. The
same pressure range (3.0–3.5 kbar) was calculated for the garnet-
bearing rock (sample 215b) with the assemblage garnet, muscovite,
chlorite, plagioclase, K-feldspar and quartz. Curiously, the garnet-
bearing sample gave a lower temperature range (450–470 ◦C)
than that of the alumino silicate-bearing rock (sample 273a),
and this can be related to the distance from the locally intruded
sheets of red granite as a heat source for the contact meta-
morphism. The garnet-muscovite and garnet-chlorite exchange
thermometers confirm that the garnet-bearing sample record peak
metamorphism temperature condition around 470 ± 30 ◦C (Hynes
and Forest, 1988; Grambling, 1990). However, in general it may be
said that the temperatures derived for the andalusite and garnet
bearing assemblages is higher than that for the low-grade rocks,
but that the pressure of equilibration is comparable for all rocks.
This was confirmed by applying the muscovite thermobarometer of
Massonne and Schreyer (1987), which gave a pressure range around
3–4.5 kbar (Fig. 6f).
In order to test out hypothesis that contact metamorphism is
responsible for the higher grade assemblage, we also derived the
Fig. 8. Estimated pressure and temperature conditions of the undeformed gran-
ites samples by amphibole-plagioclase exchange thermometer (Holland and Blundy,
1994) and Al content in amphibole barometer (Schmidt, 1992). Calculation done by
PET 1.1 (Dachs, 2004). Numbers are sample numbers and refer to: 51 = late intruded
granodiorite; 82 and 89 = syntectonic diorite and quartz-diorite.
depth of intrusion for the granites. Three granitic samples were
investigated for estimation of pressure and temperature condi-
tions during magmatic crystallization. The amphibole-plagioclase
exchange thermometer confirms that the granitic samples record
the crystallization temperature around 650–730 ◦C (Fig. 8). These
depth estimates are largely consistent with those discussed above.
Sample 51 is a later intruded granodiorite records lower pres-
sure conditions (range 1.2–2.1 kbar) than other earlier intruded
diorite and quartz-diorite (samples 82 and 89) which record a pres-
sure range of (2–3.4 kbar, Fig. 8). It is worth mentioning that the
differences in pressure estimates may therefore reflect different
intrusion cycles at different crustal levels.
7. Pseudosection modeling
Pseudosections were constructed for several bulk compositions
to constrain the metamorphic evolution. For this purpose, we have
selected two samples from the high-grade rocks because they are
(1) reasonably well equilibrated thus justifying the use of pseudo-
sections and (2) they are characterized by a high-grade assemblage
interpreted to have formed from a lower grade assemblage which is
in turn partly retrogressed so that an entire PT path may be derived
from them. Sample 215b represents garnet-bearing metasediments
and was collected around 500 m away from the granitic intrusions
(28◦40 12 N and 34◦08 53 E). Sample 273a is an alumino silicates-
bearing metasedimentary rock which was collected around 100 m
away from the granitic intrusions (28◦40 06 N and 34◦09 50 E)
(Fig. 2).
For bulk rock chemical analysis a Bruker Pioneer S4 X-ray flu-
orescence spectrometer was used at the Institute of Earth Science,
Karl-Franzens-Universität, Graz, Austria. Samples were prepared as
fused pellets using Li2B4O7 flux (Table 6). The pseudosections were
constructed using PerPleX (Connolly and Kerrick, 1987; Connolly,
1990, 2005) and the internally consistent dataset of Holland and
Powell (1998). The following activity composition models were
used: muscovite (Holland and Powell, 1998); biotite (Tajcmanová
et al., 2009); chlorite (Holland et al., 1998); melt (Holland and
Powell, 2001; White et al., 2001); garnet (White et al., 2000); chlo-
ritoid (White et al., 2000); staurolite (Holland and Powell, 1998);
20. M. Hassan et al. / Precambrian Research 241 (2014) 104–128 123
Table 6
Bulk rock chemical analysis of studied garnet- or alumino silicates-bearing
metasedimentary rocks of Sa’al–Zaghra metamorphic complex (major oxides are
represented in wt.% and trace elements in ppm; LOI, loss of ignition; BDL, below
detection limit).
Sample 215b 273a 142 123c
SiO2 (wt%) 54.20 69.99 72.77 77.65
TiO2 1.41 0.17 0.30 0.14
Al2O3 17.81 14.73 14.54 11.43
Fe2O3 11.37 3.15 2.20 1.84
MnO 2.32 0.04 0.04 0.04
MgO 2.16 0.26 0.86 0.25
CaO 1.09 0.40 0.52 0.99
Na2O 0.19 3.04 3.26 3.37
K2O 5.60 5.97 3.12 2.75
P2O3 0.45 0.01 0.03 0.02
LOI 3.35 0.56 1.46 0.54
Totals 99.95 98.62 99.48 99.33
Ba (ppm) 416 104 802 326
Ce 41 133 66 102
Co 43 159 177 209
Cr 75 BDL BDL BDL
Cs BDL BDL BDL BDL
Cu 843 62 132 56
Ga 39 25 20 16
La 96 72 43 52
Nb 25 27 15 21
Nd 107 53 37 49
Ni BDL BDL BDL BDL
Pb 48 BDL BDL BDL
Pr BDL BDL BDL BDL
Rb 277 174 77 86
Sc 20 BDL BDL BDL
Sr 39 29 118 70
Th BDL 20 BDL BDL
U BDL BDL BDL BDL
V 158 BDL BDL BDL
Y 103 37 28 46
Zn 1794 41 83 50
Zr 204 664 271 169
plagioclase (Newton et al., 1980); and K-feldspar (Thompson and
Hovis, 1979). For cordierite we assumed ideal mixing. In addi-
tion, the following phases were used without solution models:
andalusite, kyanite, sillimanite, kaolinite, pyrophyllite, diaspora,
pumpellyite, lawsonite, prehnite, wairakite, analcite, laumontite,
quartz and H2O.
7.1. Garnet-bearing sample
The P–T pseudosection for this sample was calculated in the sys-
tem MnNCKFMASH since these components represent 98.12% of
the XRF-derived bulk composition of sample 215b (Table 6). Quartz
and H2O are assumed to be in excess. The P–T pseudosection of
sample 215b is characterized by a series of mineral assemblage
fields with steep boundaries (Fig. 9). Garnet is a stable phase over a
wide P–T range. The garnet-in reactions occur as isothermal bound-
aries in a temperature range of 250–270 ◦C. Chlorite is stable below
460 ◦C.
The stable minerals of sample 215b are chlorite, muscovite, gar-
net, albite, K-feldspar and quartz. This mineral assemblage appears
in Fig. 9 in a quadrivariant field in the region (280–355 ◦C and pres-
sure is <3.2 kbar). However the garnet chemistry and that of the
muscovite inclusions in garnet show that part of the rock equil-
ibrated at higher temperatures. The muscovite inclusions in the
garnet crystals have XFe in the range of 0.06–0.07 (pfu) and most of
the garnet has an XFe between 0.12 and 0.19. The Fe isopleths of the
muscovite intersect the XFe contours for the garnet roughly in the
same PT range in Fig. 9 as derived from the average PT calculations,
i.e. roughly around 450 ◦C and 3 kbar. This indicates that plagioclase
was a stable mineral during garnet nucleation process. The garnet
crystals have Ca-rich rims (i.e. XCa is in the range of 0.14–0.16).
These rims are in equilibrium with the muscovite of the external
foliation thus intersections between the XCa isopleths and the Fe
content (0.18–0.26 pfu) of the muscovite may be used to constrain
a point along the retrograde path of this sample, consistent with an
isobaric cooling path.
In summary, the easiest interpretation of the compositional
variations is to suggest that the rock equilibrated at about 300 ◦C
and 3 kbar with a limited excursion (and partial re-equilibration) to
450–480 ◦C and similar pressure, followed by cooling to 300–350 ◦C
at the same crustal level. This interpretation is consistent with both
the thermobarometric calculations and the pseudosection in Fig. 9
and suggests contact metamorphic heating and subsequent cooling
to a low-grade regional metamorphic event.
7.2. Alumino silicates-bearing sample
In contrast to sample 215b, the MnO content of sample
273a is only 0.038 wt.% (Table 6). Therefore the thermo-
dynamic system was reduced to be NCKFMASH (Fig. 10).
The P–T pseudosection is characterized by a relative sim-
ple topology at temperature conditions 660 ◦C. Four
sillimanite-bearing assemblages (sill + bi + pl + ksp + q + H2O;
sill + bi + pl + ksp + q + H2O + liq; sill + cd + bi + pl + ksp + q + H2O + liq;
sill + bi + pl + ksp + H2O + liq) and four andalusite-
bearing assemblages (and + cd + bi + pl + ksp + q + H2O;
and + bi + mu + pl + ksp + q + H2O; and + bi + pl + ksp + q + H2O;
and + cd + bi + pl + ksp + q + H2O + liq) are stable below
3.9 kbar and in a temperature range of 560–660 ◦C.
Three univariant reactions appear in the pseudosection,
two of them (bi + mu + chl + ab + ksp + lmt + pre + q + H2O;
bi + mu + chl + ab + ksp + wrk + pre + q + H2O) at low tempera-
ture (290–340 ◦C), while an alumino silicate-bearing univariant
reaction appears at higher temperature (650–655 ◦C). Clinozoisite
is stable over a wide range of pressure (1.3–6 kbar) but in a narrow
temperature window (345–460 ◦C).
The inferred equilibrium mineral assemblage of sample 273a
is alumino silicate–biotite–plagioclase–K-feldspar and quartz with
both andalusite and sillimanite occurring as alumino silicates
phases and pervasive late muscovite replacing most of it (see
petrography section). This assemblage is stable between 2.9 and
3.5 kbar and in a temperature range of 630–650 ◦C (Fig. 10). The
post-peak conditions can be identified using the Si content of the
mica in the groundmass surrounding the porphyroblasts. The Si
isopleths of biotite and muscovite intersect in a temperature range
of 425–500 ◦C and in a pressure range of 2.3–4.4 kbar. Muscovite
thermobarometer (Fig. 6f) indicates that the post-peak micas are
stable in a P–T range of 3–4.5 kbar and 440–510 ◦C (P and T range
bars of Fig. 10). Muscovite inclusions may be used to get some infor-
mation about the pre-peak conditions. The two black bold lines of
Fig. 10 show the limiting content of the Si in the chemical formula
of the muscovite inclusions. The Si contents indicate that the pre-
peak assemblage can be at any condition between 450 and 630 ◦C
and in a pressure range below 4 kbar. All of this evidence confirms
the interpretation of the garnet-bearing sample discussed in Fig. 9.
It shows that the rock equilibrated between 400 and 450 ◦C and
around 3 kbar and that it also partially equilibrated at higher tem-
peratures and comparable pressures. As for sample 215b, both is
consistent with an interpretation of low-grade regional metamor-
phism overprinted by a contact metamorphic event.
8. Discussion
The majority of the metavolcanic-metasedimentary associa-
tions of the Sa’al–Zaghra Complex show good preservation of
21. 124 M. Hassan et al. / Precambrian Research 241 (2014) 104–128
Fig. 9. P–T pseudosection for the garnet-bearing sample number 215b. The two white dashed lines represent the garnet composition of the intermediate zone. The red
polygons indicate conditions constrained by mineral isopleths. (For interpretation of the reference to color in this figure legend, the reader is referred to the web version of
the article.)
primary volcanic and sedimentary microstructures (e.g. porphyritic
texture; Fig. 4b) and have been affected by only low-strain typically
involving a weakly developed foliation parallel to layering and bed-
ding planes. The P–T history of the Sa’al–Zaghra Complex shows
that most of the rocks equilibrated at similar temperature condi-
tions around 370–420 ◦C and pressures around 2.5–3.2 kbar. This is
equivalent to a crustal depth variation of 9–11.5 km (for an overbur-
den density 2850 kg m−3 and assuming lithostatic conditions). The
Sa’al–Zaghra area was later intruded by granitoids, which cut across
the foliations. The pressure conditions for the granodiorite and
the diorite intrusions (earlier) are 2.5–3.4 kbar, whereas the later
granitic intrusions have pressures of 1.4–2 kbar attending mag-
matic crystallization. These differences in the pressure conditions
may reflect distinct crustal levels of intrusion relating to differ-
ent intrusion phases. The early syntectonic intrusions (in particular
the red gneissic granite sheets, Fig. 3g) caused local contact meta-
morphism, resulting in partial equilibration of the assemblages at
630–650 ◦C.
For the Sa’al–Zaghra complex we suggest that the flat lying
D1 fabric in association with the metamorphic conditions around
400 ◦C and 3 kbar indicate metamorphism during a crustal thin-
ning event that occurred during an extension regime. The peak
metamorphism of the M1 in the study area occurred at a depth of
9–11.5 km corresponding to a geothermal gradient of 38–41 ◦C/km.
This is much higher than the geothermal gradients for the subse-
quent event as derived for the Feiran–Solaf region (25–27 ◦C/km
for the Pan-African event at ca. 632 Ma; Abu-Alam and Stüwe,
2009) or the Gabal Samra metapelites from the same general region
(27 ◦C/km; Abu El-Enen, 2011). Although the local remarked higher
geothermal gradient in Sinai (43–50 ◦C/Km) which is related to
heat flow transferred from nearby granite intrusions (Eliwa et al.,
2008; Abu El-Enen, 2011), we suggest that the higher geother-
mal gradients during the earlier M1 event in the Sa’al–Zaghra
complex may be interpreted as additional evidence for an exten-
sional setting and crustal thinning during D1. In the remainder of
this paper an attempt is made to derive a metamorphic evolution
for the Sa’al–Zaghra complex and compare this with metamor-
phic histories of other complexes of Sinai. The implications of
these discussions for the tectonic evolution of the Arabia-Nubian
Shield at the stage between Rodinia rifting and East- and West-
Gondwanaland collision will then be considered.
8.1. Age and origin of the Sa’al–Zaghra complex
Recently published zircon U–Pb analyses of volcanic ash-flow
yielded concordia ages of 1030 ± 5 Ma interpreted to represent
crystallization ages of their magma chambers, while calc-alkaline
volcanic and intrusive rocks of Wadi Sa’al area yielded ages of ca.
1030–1020 Ma (Be’eri-Shlevin et al., 2012). Nevertheless, timing
of volcanic activity, sedimentation, deformation and metamor-
phism of the metavolcanics and metasedimentary associations in
the Sa’al–Zaghra complex are unclear. Abu Anbar et al. (2009)
22. M. Hassan et al. / Precambrian Research 241 (2014) 104–128 125
Fig. 10. P–T pseudosection for the alumino silicates-bearing sample for the phases that cited in the text.
concluded that the age of the rhyolitic-dacitic parents that later
became deformed and metamorphosed to form the schists of Sa’al
area was 873 ± 16 Ma, while the metavolcanics unconformably
above the schists were dated at 736 ± 22 Ma. Bielski (1982) gave
an average Rb–Sr age of 734 ± 17 Ma for the metavolcanic rocks.
Abu Anbar et al. (2009) noted that schists were associated only
with the metasediments, but the schists found to be associated also
with the metavolcanics, and no evidence of unconformity between
the schists (El-Rayan phyllites) and the metavolcanics (Agramiya
Fm). This casts some doubt on the idea that the schistosity and
metamorphism formed before the metavolcanics, and therefore the
significant age difference between schists (873 Ma) and metavol-
canics (736 Ma) may reflect isotopic disturbance rather than real
age differences.
Sa’al Conglomerate pebble ages by Priem et al. (1984) apparently
placed a maximum age of 757 ± 28 Ma on conglomerate deposition,
and may be revised to 672 Ma according to recent data (Andresen,
pers. commun.). A zircon population dated by Stern et al. (2010) at
606 ± 10 Ma was also found to accompany a second zircon pop-
ulation dated at 931 ± 14 Ma in diorite boulders from the Wadi
Zaghra conglomerates. Stern et al. (2010) offered two possible
explanations for the ∼605 Ma zircons. The first was that they dated
the diorite magma, and that the older population (∼930 Ma) was
xenocrysts in the diorite magma. The second explanation was that
both populations define a discordia giving a magmatic age for the
diorite of 1045 ± 55 Ma (upper intercept) and a Pb-loss event affect-
ing the zircons at about 569 ± 55 Ma. These data do not conclusively
show either an old (∼1 Ga) or young (∼600 Ma) age for the Wadi
Zaghra conglomerates.
El-Gaby et al. (2002) concluded that the Sa’al–Zaghra complex
is a relatively undeformed, unmetamorphosed succession related
to the younger Dokhan volcanics and can also be correlated to
Hammamat molasse sediments of the Eastern Desert of Egypt. In
contrast to this, detrital zircon from the Sa’al andalusite-bearing
schist gave concordant ages of 1029 ± 7 Ma and 1110 ± 8 Ma (Be’eri-
Shlevin et al., 2012). In addition, El-Rayan pelitic sedimentary
rocks yielded a bimodal age pattern of 1003 and 1110 Ma (Be’eri-
Shlevin et al., 2009). Moreover, whole-rock εNd (t = 1.0 Ga) value
of +2 is significantly lower than found for juvenile Neoprotero-
zoic rocks in the Arabian-Nubian Shield which led Be’eri-Shlevin
et al. (2009) to interpret the Sa’al schist to represent Kibaran
(Grenville) age crust incorporated into the northernmost part of
the Arabian-Nubian Shield. The volcanic activity that formed most
of the Sa’al–Zaghra complex appears to have occurred in the time
interval of 1110–1030 Ma (Stern et al., 2010; Be’eri-Shlevin et al.,
2012).
The single dynamothermal metamorphic event (M1) in the
study area began during the development of layering-parallel
23. 126 M. Hassan et al. / Precambrian Research 241 (2014) 104–128
Fig. 11. The relation of metamorphism and deformation in the study area in the content of the evolution of the Arabian Nubian Shield.
foliation (D1) and may have reached peak temperatures in the
last stages of this foliation-forming event. This event is believed
to have involved horizontal NW–SE tectonic extension. The exten-
sion event was followed by two compressional deformations. The
NW–SE compressive D2 event may overlap with the intrusion of
the El-Fringa metagabbro. The foliation of the complex is cut by
gabbro with an intrusion age of 1017 ± 5 Ma (Be’eri-Shlevin et al.,
2009), consequently the metamorphism and the crustal exten-
sional in the Sa’al–Zaghra area practicably occurred in the interval
1030–1017 Ma. These observations are consistent with the vol-
canic rocks of the complex being formed and metamorphosed in
an extensional setting older than 1017 ± 5 Ma, and therefore pos-
sibly occurring during the early stages of breakup of the Rodinia
supercontinent.
Based on sediment composition and volcanic rock geochem-
istry, Shimron et al. (1993) and El-Gaby et al. (2002) interpreted the
Sa’al–Zaghra rocks as a volcano-sedimentary succession of island
arc to active continental margin affinities, though heterogene-
ity and magma mixing may have occurred, according to Soliman
(1986), Mehanna (2000) and Abu Anbar et al. (2009). However,
our preferred interpretation is that the Sa’al–Zaghra complex was
a rift-related volcano-sedimentary assemblage that formed dur-
ing the early stages of the break-up of Rodinia, according to the
lithological characteristics of the volcanic-sedimentary assemblage
of the complex. The amount of felsic volcanism in the complex is
not compatible with island arc volcanism. Also, volcanic rocks of
the Agramiya Formation are bimodal, typical of rift volcanism. The
conglomerates of Zaghra Formation could have been deposited on
alluvium fans close to the border faults of the rifted margins.
8.2. Sa’al–Zaghra complex in the context of Sinai tectonism
Abu-Alam and Stüwe (2009) found remnants of an earlier fab-
ric as inclusion trails in garnet porphyroblasts of the Feiran–Solaf
metamorphic complex (west of the Sa’al–Zaghra area). They
concluded that these early fabric represented an early metamor-
phic phase (M1) of the Feiran–Solaf area. Fowler and Hassen
(2008) showed that the principal shortening strain during the M1
metamorphic event in the Feiran–Solaf area was a vertical flatten-
ing with stretching had occurred in the NW–SE direction and, to
a lesser degree, the NE–SW direction. This early extensional event
reflected a larger-scale extension related to the breakup of Rodinia
(Fowler and Hassen, 2008) and that may correlate with the first
deformation phase in the Sa’al–Zaghra metamorphic complex.
Ali et al. (2009) concluded that the presence of inherited zir-
cons with ages of ∼1790 Ma in syenogranite from Sinai indicates
that older material is present within the basement. Rock fragments
of age ca. 900–1100 Ma were found in the volcano-sedimentary
succession at Wadi Rutig, Sinai (Samuel et al., 2011). In addition
to these late mesoproterozoic fragments, other rock fragments
with a Pan-African age 629–615 Ma can be found. Abu El-Enen
and Whitehouse (2013) found that the metapsammitic gneiss in
Solaf area of the Feiran–Solaf complex has a Mesoproterozoic
age (1.0 Ga). These age data can be interpreted in the context of
Be’eri-Shlevin et al.’s (2012) data from the Sa’al–Zaghra complex
(1110–1030 Ma) to indicate a possibility of that the Sa’al–Zaghra
and the Solaf complexes together represent the oldest rocks in the
northernmost segment of the Arabian-Nubian Shield in having a
Mesoproterozoic age. If so, the Pan-African Rb/Sr whole rock age of
c. 610 Ma reported by Stern and Manton (1987) for the Feiran–Solaf
complex may have been a result of isotopic disturbances during the
Pan-African metamorphism (610–615 Ma); or during the exhuma-
tion (594 Ma; Eliwa et al., 2008).
The existence of a single metamorphic event (M1) in the
Sa’al–Zaghra complex in time interval 1030–1017 Ma demon-
strates that the complex escaped later metamorphism during the
East- and West-Gondwana collision (Pan-African age), but not the
deformation associated with this event, which is represented by
the D3 deformation as open folding with axial planes trending
NW–SE (Fig. 11). This phase of deformation also correlates with
the NE–SW tectonic shortening event in the Feiran–Solaf complex
which is characterized by NW–SE close folding. These facts are con-
sistent with the Sa’al–Zaghra complex having been at a shallow
crustal level (<9 km) during the East- and West-Gondwana colli-
sion, and thus the complex was not affected by the deep crustal
level Pan-African metamorphism.