![International Journal of Trend in Scientific Research and Development (IJTSRD) @ www.ijtsrd.com eISSN: 2456-6470
@ IJTSRD | Unique Paper ID – IJTSRD41310 | Volume – 5 | Issue – 4 | May-June 2021 Page 1744
The 2 and + were calculated from these formular
(Innocent et al., 2015).
2 =23.45 sin !360
. 56
,
- (3)
+ 781 9−; 0∅; 02< (4)
The maximum possible sunshine duration ̅ was
calculated using the following equation ( )
̅
,
+ (5)
The regression constants a and b were determined using a
statistical software programme, IBM SPSS 21.
STATISTICALTEST INDICATOR METHODS
In literature, quite a lot of statistical test methods had
been used to determine the performance of the models of
solar radiation estimation. These comprise Root Mean
Square Error (RMSE), Mean Bias Error (MBE), Mean
Percentage Error (MPE), Correlation Coefficient (R), and
Coefficient of Determination (= ).
Root Mean Square Error (RMSE), the RMSE is the
frequency used measure of the different between the
values of the predicted by a model and the values actually
measured. It is always positive and low. RMSE may be
calculated from the following equation, (Akpabio and Etuk,
2013):
=> ? !∑A BCDEF − BGEH I /0-`` (6)
Mean Bias Error (MBE), MBE provides information on the
long term performance of the models. The ideal value of
the MBE is zero. A positive and a negative value of MBE
indicate the average amount of over estimation and under
estimation. It was recommended that a zero value for MBE
is ideal,(Iqbal,1983). The MBE is given by
>K? L∑A BCDEF − BGEH IM/0 (7)
Mean Percentage Error (MPE), the MPE test provides
information on long term performance of the examined
regression equations. A positive and a negative value of
MPE indicate the average amount of over estimation and
under estimation in the predicted values respectively. A
low MPE is desirable (Okonkwo and Nwokoye, 2014).
The MPE may be computed from the following equation:
>N?
O∑
PQRSTUVPQWXSY
PQRSTU
Z
6
100 (8)
where BCDEF and BGEH are the ith predicted and
measured values respectively of solar radiation, n is the
total number of observations.
Coefficient of determination(= ), this is the ratio of
explained variation,( CDEF − G) , to the total variation
( − ) , G is the mean of the observed H values. The
ratio lies between zero and one. A high value of (= ) is
desirable (Falayi and Rabiu, 2012).
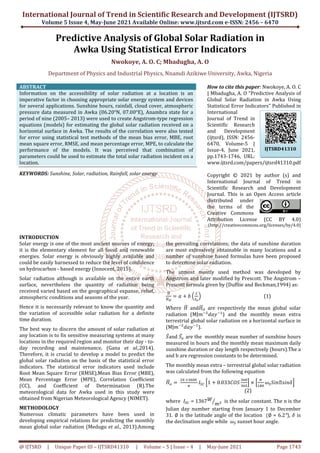
RESULTS AND DISCUSSION
It is known from table 1 that the correlation coefficient, R
is within the range of 0.599 to 0.948 which specifies that a
good fit exists between the measured global solar
radiation, Hm and the predicted global solar radiation, Hp
for some of the models excluding models 7, 10, 15, 16, 17
and 18.
Based on the correlation coefficient, R and coefficient of
determination, R2, models 11 and 13 produce the highest
value thereby ranked first in terms of R and R2 and model
17 the least.
For Mean Bias Error (MBE), models 3, 14, 15, and 18
indicate slightly underestimation in their predicted values
and models 10, 17 and specify overestimation in their
predicted values..
Considering the Mean Percentage Error (MPE), nearly all
the models specified underestimation excluding models
14, 15, 16 and 18 that indicated overestimation in their
predicted values.
Explanations of the models showed that model 13 when
compared to the other models, displayed the lowest RMSE,
with low MBE and MPE. This makes it most appropriate
for estimating global solar radiation for Awka. These
statistical errors were summarized in figures 1-3 below;
Table 1: Statistical Error Indicators of the Models.
Model MBE RMSE MPE R R2
]^
]_
= a + b (n/N) 0.0801 2.2936 -0.6343 0.7740 0.5990
]^
]_
= a + b (n/N)-1 0.0450 2.3377 -0.3328 0.8120 0.6593
]^
]_
= a + b 4(n/N) - c (n/N)2 -1.4696 2.3312 -0.5507 0.8160 0.6659
]^
]_
= a + b (n/N) -c (n/N)2 +d (n/N)3 0.0769 2.2813 -0.5245 0.8170 0.6675
]^
]_
= a (n/N) b 0.04431 2.2875 0.3625 0.8040 0.6464
]^
]_
= a + b (RF) 0.0439 2.5700 -0.4250 0.8500 0.7230
]^
]_
= a + blog (RF) 1.0648 4.4301 -6.5980 0.7240 0.5240
]^
]_
= a + b (RF) - c (RF)2 -0.0409 2.2575 0.2167 0.8960 0.8030
]^
]_
= a + b (c/C) + c (RF) -0.1899 2.3248 0.9216 0.9300 0.8640
]^
]_
= a + b (n/N) + c (RF) 1.6480 5.9520 -9.6857 0.9350 0.8740
]^
]_
= a + b (RF) + c (W) + d (A) 0.1270 2.0872 -0.8169 0.9480 0.8890](data:image/gif;base64,R0lGODlhAQABAIAAAAAAAP///yH5BAEAAAAALAAAAAABAAEAAAIBRAA7)
Recommended
More Related Content
What's hot
What's hot (20)
Similar to Predictive Analysis of Global Solar Radiation in Awka Using Statistical Error Indicators
Similar to Predictive Analysis of Global Solar Radiation in Awka Using Statistical Error Indicators (20)
More from ijtsrd
More from ijtsrd (20)
Recently uploaded
Recently uploaded (20)
Predictive Analysis of Global Solar Radiation in Awka Using Statistical Error Indicators
- 1. International Journal of Trend in Scientific Research and Development Volume 5 Issue 4, May-June @ IJTSRD | Unique Paper ID – IJTSRD41310 Predictive Analysis of Awka Using Statistical Error Indicators Nwokoye, A. Department of Physics and ABSTRACT Information on the accessibility of solar radiation at a location is an imperative factor in choosing appropriate solar energy system and devices for several applications. Sunshine hours, rainfall, cloud cover, atmospheric pressure data measured in Awka (06.20°N, 07.00°E), Anambra state for period of nine (2005– 2013) were used to create Angstrom equations (models) for estimating the global solar radiation received on a horizontal surface in Awka. The results of the correlation were also tested for error using statistical test methods of the mean bias error, MBE, root mean square error, RMSE, and mean percentage error, MPE, to calculate the performance of the models. It was perceived that combination of parameters could be used to estimate the total solar radiation incident location. KEYWORDS: Sunshine, Solar, radiation, Rainfall, solar energy INTRODUCTION Solar energy is one of the most ancient sources of energy; it is the elementary element for all fossil and renewable energies. Solar energy is obviously highly available and could be easily harnessed to reduce the level of confidence on hydrocarbon - based energy (Innocent, 2015). Solar radiation although is available on the entire earth surface, nevertheless the quantity of radiation being received varied based on the geographical expanse, relief, atmospheric conditions and seasons of the year. Hence it is necessarily relevant to know the quantity and the variation of accessible solar radiation for a definite time duration. The best way to discern the amount of solar radiation at any location is to fix sensitive measuring systems at many locations in the required region and monitor t day recording and maintenance, (Gana Therefore, it is crucial to develop a model to predict the global solar radiation on the basis of the statistical error indicators. The statistical error indicators used include Root Mean Square Error (RMSE),Mean Bias Error (MBE), Mean Percentage Error (MPE), Correlation Coefficient (CC), and Coefficient of Determination (R).The meteorological data for Awka used in this study were obtained from Nigerian Meteorological Agency (NIMET). METHODOLOGY Numerous climatic parameters have been used in developing empirical relations for predicting the monthly mean global solar radiation (Medugu et al Trend in Scientific Research and Development 2021 Available Online: www.ijtsrd.com e-ISSN: 2456 41310 | Volume – 5 | Issue – 4 | May-June 2021 Predictive Analysis of Global Solar Radiation in Awka Using Statistical Error Indicators Nwokoye, A. O. C; Mbadugha, A. O Department of Physics and Industrial Physics, Nnamdi Azikiwe University, solar radiation at a location is an imperative factor in choosing appropriate solar energy system and devices for several applications. Sunshine hours, rainfall, cloud cover, atmospheric pressure data measured in Awka (06.20°N, 07.00°E), Anambra state for a 2013) were used to create Angstrom-type regression equations (models) for estimating the global solar radiation received on a horizontal surface in Awka. The results of the correlation were also tested est methods of the mean bias error, MBE, root mean square error, RMSE, and mean percentage error, MPE, to calculate the performance of the models. It was perceived that combination of parameters could be used to estimate the total solar radiation incident on a Sunshine, Solar, radiation, Rainfall, solar energy How to cite | Mbadugha, A. O "Predictive Analysis of Global Solar Radiation in Awka Using Statistical Error Indicators" Published in International Journal of Trend in Scientific Research and Development (ijtsrd), ISSN: 2456 6470, Volume Issue-4, June 2021, pp.1743-1746, URL: www.ijtsrd.com/papers/ijtsrd41310.pdf Copyright International Scientific Journal. This distributed the terms Creative Commons Attribution (http://creativecommons.org/licenses/by/4.0 most ancient sources of energy; it is the elementary element for all fossil and renewable energies. Solar energy is obviously highly available and could be easily harnessed to reduce the level of confidence based energy (Innocent, 2015). olar radiation although is available on the entire earth surface, nevertheless the quantity of radiation being received varied based on the geographical expanse, relief, atmospheric conditions and seasons of the year. ow the quantity and the variation of accessible solar radiation for a definite The best way to discern the amount of solar radiation at any location is to fix sensitive measuring systems at many locations in the required region and monitor their day - to- day recording and maintenance, (Gana et al.,2014). to develop a model to predict the global solar radiation on the basis of the statistical error The statistical error indicators used include Square Error (RMSE),Mean Bias Error (MBE), Mean Percentage Error (MPE), Correlation Coefficient and Coefficient of Determination (R).The meteorological data for Awka used in this study were obtained from Nigerian Meteorological Agency (NIMET). Numerous climatic parameters have been used in developing empirical relations for predicting the monthly et al., 2013).Among the prevailing correlations; the data of sunshine duration are most extensively obtaina number of sunshine based formulas have been proposed to determine solar radiation. The utmost mostly used method was developed by Angstrom and later modified Prescott formula given by (Duffiie and Bec ̅ ̅ Where and are respectively the mean global solar radiation (MJ ) and the monthly mean extra terrestrial global solar radiation on a horizontal surface in (MJ ). ̅and ̅ are the monthly mean number of sunshine hours measured in hours and the monthly mean maximum daily sunshine duration or day length respectively (hours).The a and b are regression constants to be determined. The monthly mean extra – terrestrial global sol was calculated from the following equation !1 0.033&' where = 1367() is the solar constant. The n is the Julian day number starting from January 1 to December 31. ∅ is the latitude angle of the location the declination angle while + Trend in Scientific Research and Development (IJTSRD) ISSN: 2456 – 6470 June 2021 Page 1743 Radiation in Awka Using Statistical Error Indicators , Nnamdi Azikiwe University, Awka, Nigeria cite this paper: Nwokoye, A. O. C | Mbadugha, A. O "Predictive Analysis of Global Solar Radiation in Awka Using Statistical Error Indicators" Published in International Journal of Trend in Scientific Research and Development (ijtsrd), ISSN: 2456- 6470, Volume-5 | une 2021, 1746, URL: www.ijtsrd.com/papers/ijtsrd41310.pdf © 2021 by author (s) and International Journal of Trend in Research and Development This is an Open Access article distributed under terms of the Commons Attribution License (CC BY 4.0) //creativecommons.org/licenses/by/4.0) the prevailing correlations; the data of sunshine duration obtainable in many locations and a number of sunshine based formulas have been proposed mostly used method was developed by Angstrom and later modified by Prescott. The Angstrom – Duffiie and Beckman,1994) as: (1) are respectively the mean global solar ) and the monthly mean extra terrestrial global solar radiation on a horizontal surface in are the monthly mean number of sunshine hours measured in hours and the monthly mean maximum daily sunshine duration or day length respectively (hours).The a and b are regression constants to be determined. terrestrial global solar radiation was calculated from the following equation &' , - ! . + /0 1/02- (2) is the solar constant. The n is the Julian day number starting from January 1 to December is the latitude angle of the location (∅ = 6.2°), 2 is + sunset hour angle. IJTSRD41310
- 2. International Journal of Trend in Scientific Research and Development (IJTSRD) @ www.ijtsrd.com eISSN: 2456-6470 @ IJTSRD | Unique Paper ID – IJTSRD41310 | Volume – 5 | Issue – 4 | May-June 2021 Page 1744 The 2 and + were calculated from these formular (Innocent et al., 2015). 2 =23.45 sin !360 . 56 , - (3) + 781 9−; 0∅; 02< (4) The maximum possible sunshine duration ̅ was calculated using the following equation ( ) ̅ , + (5) The regression constants a and b were determined using a statistical software programme, IBM SPSS 21. STATISTICALTEST INDICATOR METHODS In literature, quite a lot of statistical test methods had been used to determine the performance of the models of solar radiation estimation. These comprise Root Mean Square Error (RMSE), Mean Bias Error (MBE), Mean Percentage Error (MPE), Correlation Coefficient (R), and Coefficient of Determination (= ). Root Mean Square Error (RMSE), the RMSE is the frequency used measure of the different between the values of the predicted by a model and the values actually measured. It is always positive and low. RMSE may be calculated from the following equation, (Akpabio and Etuk, 2013): => ? !∑A BCDEF − BGEH I /0-`` (6) Mean Bias Error (MBE), MBE provides information on the long term performance of the models. The ideal value of the MBE is zero. A positive and a negative value of MBE indicate the average amount of over estimation and under estimation. It was recommended that a zero value for MBE is ideal,(Iqbal,1983). The MBE is given by >K? L∑A BCDEF − BGEH IM/0 (7) Mean Percentage Error (MPE), the MPE test provides information on long term performance of the examined regression equations. A positive and a negative value of MPE indicate the average amount of over estimation and under estimation in the predicted values respectively. A low MPE is desirable (Okonkwo and Nwokoye, 2014). The MPE may be computed from the following equation: >N? O∑ PQRSTUVPQWXSY PQRSTU Z 6 100 (8) where BCDEF and BGEH are the ith predicted and measured values respectively of solar radiation, n is the total number of observations. Coefficient of determination(= ), this is the ratio of explained variation,( CDEF − G) , to the total variation ( − ) , G is the mean of the observed H values. The ratio lies between zero and one. A high value of (= ) is desirable (Falayi and Rabiu, 2012). RESULTS AND DISCUSSION It is known from table 1 that the correlation coefficient, R is within the range of 0.599 to 0.948 which specifies that a good fit exists between the measured global solar radiation, Hm and the predicted global solar radiation, Hp for some of the models excluding models 7, 10, 15, 16, 17 and 18. Based on the correlation coefficient, R and coefficient of determination, R2, models 11 and 13 produce the highest value thereby ranked first in terms of R and R2 and model 17 the least. For Mean Bias Error (MBE), models 3, 14, 15, and 18 indicate slightly underestimation in their predicted values and models 10, 17 and specify overestimation in their predicted values.. Considering the Mean Percentage Error (MPE), nearly all the models specified underestimation excluding models 14, 15, 16 and 18 that indicated overestimation in their predicted values. Explanations of the models showed that model 13 when compared to the other models, displayed the lowest RMSE, with low MBE and MPE. This makes it most appropriate for estimating global solar radiation for Awka. These statistical errors were summarized in figures 1-3 below; Table 1: Statistical Error Indicators of the Models. Model MBE RMSE MPE R R2 ]^ ]_ = a + b (n/N) 0.0801 2.2936 -0.6343 0.7740 0.5990 ]^ ]_ = a + b (n/N)-1 0.0450 2.3377 -0.3328 0.8120 0.6593 ]^ ]_ = a + b 4(n/N) - c (n/N)2 -1.4696 2.3312 -0.5507 0.8160 0.6659 ]^ ]_ = a + b (n/N) -c (n/N)2 +d (n/N)3 0.0769 2.2813 -0.5245 0.8170 0.6675 ]^ ]_ = a (n/N) b 0.04431 2.2875 0.3625 0.8040 0.6464 ]^ ]_ = a + b (RF) 0.0439 2.5700 -0.4250 0.8500 0.7230 ]^ ]_ = a + blog (RF) 1.0648 4.4301 -6.5980 0.7240 0.5240 ]^ ]_ = a + b (RF) - c (RF)2 -0.0409 2.2575 0.2167 0.8960 0.8030 ]^ ]_ = a + b (c/C) + c (RF) -0.1899 2.3248 0.9216 0.9300 0.8640 ]^ ]_ = a + b (n/N) + c (RF) 1.6480 5.9520 -9.6857 0.9350 0.8740 ]^ ]_ = a + b (RF) + c (W) + d (A) 0.1270 2.0872 -0.8169 0.9480 0.8890
- 3. International Journal of Trend in Scientific Research and Development @ IJTSRD | Unique Paper ID – IJTSRD41310 ]^ ]_ = a + b (n/N) + c (W) ]^ ]_ = a + b (n/N) +c (RF) +d( ]^ ]_ = a + b (n/N) + c (c/C) ]^ ]_ =a +b (n/N) +c (c/C) +d ]^ ]_ = a + b(n/N) +c (A) +d ( ]^ ]_ = a +b(n/N) +c (c/C) +( ]^ ]_ = a + b n/N) +c (A) -2.0000 0.0000 2.0000 4.0000 6.0000 8.0000 H1 Mean bias error -40.0000 -30.0000 -20.0000 -10.0000 0.0000 10.0000 H1 Mean percntage error 0 5 10 15 20 25 Root mean square error Trend in Scientific Research and Development (IJTSRD) @ www.ijtsrd.com 41310 | Volume – 5 | Issue – 4 | May-June 2021 0.1219 2.4210 -0.8643 0.8800 ) +d(W) 0.0776 2.0853 -0.5403 0.9480 /C) -1.0629 4.0553 5.6003 0.9100 /C) +d RF) - 0.8187 3.0002 4.3945 0.9350 +d (W) -0.4159 2.8612 2.0695 0.9120 /C) +(A) 5.8828 20.3788 -32.6524 0.9280 -0.3456 2.7849 1.6799 0.9120 H1 H3 H5 H7 H9 H11 H13 H15 H17 Models H1 H3 H5 H7 H9 H11 H13 H15 H17 Models MPE (%) MPE (%) H1 H3 H5 H7 H9 H11 H13 H15 H17 Models RMSE www.ijtsrd.com eISSN: 2456-6470 June 2021 Page 1745 0.8800 0.7750 0.9480 0.8990 0.9100 0.8290 0.9350 0.8740 0.9120 0.8320 0.9280 0.8620 0.9120 0.8320 MBE MPE (%) RMSE
- 4. International Journal of Trend in Scientific Research and Development (IJTSRD) @ www.ijtsrd.com eISSN: 2456-6470 @ IJTSRD | Unique Paper ID – IJTSRD41310 | Volume – 5 | Issue – 4 | May-June 2021 Page 1746 CONCLUSION Thus computer statistical software program, (IBM SPSS 21) was used in obtaining the regression constants. The accuracy of the estimated values was tested by calculating the Mean Bias Error (MBE), Root Mean Square Error (RMSE), and Mean Percentage Error (MPE). From the comparison of the results of these models, it was observed that the predicted values were in good agreement with the measured and the models were slightly similar. Model 13 based on the correlation coefficient, R of 0.9480, coefficient of determination, R2 of 0.8990, Mean Bias Error of 0.0775, Mean Percentage Error of -0.5403 the least Root Mean Square Error of 2.0853 and with the regression equation given as: gh gi =0.663 +0.008 (j/k) -0.016 (lm) -0.010(n) is the best performed model, hence can be used for predicting solar radiation for Awka.