
Recommended
Recommended
More Related Content
What's hot
What's hot (18)
Similar to Air Water System Design using Revit Mep for a Residential Building
Similar to Air Water System Design using Revit Mep for a Residential Building (20)
More from ijtsrd
More from ijtsrd (20)
Recently uploaded
Recently uploaded (20)
Air Water System Design using Revit Mep for a Residential Building
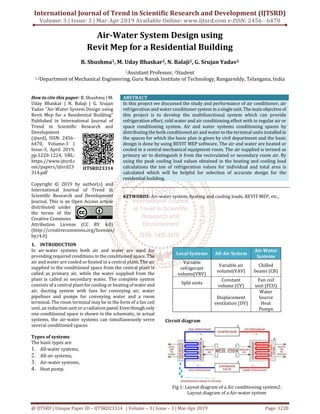
- 1. International Journal of Trend in Scientific Research and Development (IJTSRD) Volume: 3 | Issue: 3 | Mar-Apr 2019 Available Online: www.ijtsrd.com e-ISSN: 2456 - 6470 @ IJTSRD | Unique Paper ID – IJTSRD23314 | Volume – 3 | Issue – 3 | Mar-Apr 2019 Page: 1220 Air-Water System Design using Revit Mep for a Residential Building B. Shushma1, M. Uday Bhaskar2, N. Balaji2, G. Srujan Yadav2 1Assistant Professor, 2Student 1,2Department of Mechanical Engineering, Guru Nanak Institute of Technology, Rangareddy, Telangana, India How to cite this paper: B. Shushma | M. Uday Bhaskar | N. Balaji | G. Srujan Yadav "Air-Water System Design using Revit Mep for a Residential Building" Published in International Journal of Trend in Scientific Research and Development (ijtsrd), ISSN: 2456- 6470, Volume-3 | Issue-3, April 2019, pp.1220-1224, URL: https://www.ijtsrd.c om/papers/ijtsrd23 314.pdf Copyright © 2019 by author(s) and International Journal of Trend in Scientific Research and Development Journal. This is an Open Access article distributed under the terms of the Creative Commons Attribution License (CC BY 4.0) (http://creativecommons.org/licenses/ by/4.0) ABSTRACT In this project we discussed the study and performance of air conditioner, air refrigeration and water conditionersystem in asingleunit.Themainobjectiveof this project is to develop the multifunctional system which can provide refrigeration effect, cold water and air conditioning effect with in regular air or space conditioning system. Air and water systems conditioning spaces by distributing the both conditioned air and water to the terminal units installed in the spaces for which the basic plan is given by civil department and the basic design is done by using REVIT MEP software. The air and water are heated or cooled in a central mechanical equipment room. The air supplied is termed as primary air to distinguish it from the recirculated or secondary room air. By using the peak cooling load values obtained in the heating and cooling load calculations the ton of refrigeration values for individual and total area is calculated which will be helpful for selection of accurate design for the residential building. KEYWORDS: Air-water system, heating and cooling loads, REVIT MEP, etc., 1. INTRODUCTION In air-water systems both air and water are used for providing required conditions in the conditioned space. The air and water are cooled or heated in a central plant. The air supplied to the conditioned space from the central plant is called as primary air, while the water supplied from the plant is called as secondary water. The complete system consists of a central plant for cooling or heating ofwater and air, ducting system with fans for conveying air, water pipelines and pumps for conveying water and a room terminal. The room terminal may be in the form of a fan coil unit, an induction unit or a radiation panel.Eventhough only one conditioned space is shown in the schematic, in actual systems, the air-water systems can simultaneously serve several conditioned spaces Types of systems The basic types are 1. All-water systems, 2. All-air systems, 3. Air-water systems, 4. Heat pump. Local Systems All-Air System Air-Water Systems Variable refrigerant volume(VRV) Variable air volume(VAV) Chilled beams (CB) Split units Constant volume (CV) Fan coil unit (FCU) Displacement ventilation (DV) Water Source Heat Pumps Circuit diagram Fig 1: Layout diagram of a Air conditioning system2: Layout diagram of a Air-water system IJTSRD23314
- 2. International Journal of Trend in Scientific Research and Development (IJTSRD) @ www.ijtsrd.com eISSN: 2456-6470 @ IJTSRD | Unique Paper ID - IJTSRD23314 | Volume – 3 | Issue – 3 | Mar-Apr 2019 Page: 1221 Fig 2: Layout diagram of a Air-water system REFRIGERENT A refrigerant is a mixture or a substance usually in a liquid form used in a refrigeration cycle. Refrigeration is the process of exchanging heat from one place to the other place in a controlled space conditions. In various cycles the process undergoes the phase changes from a liquid state to a gas state and back again. Many working fluids have been used for such purposes. Different types of refrigerents Halocarbons Isotropic refrigerants. Zoetrope refrigerants. Inorganic refrigerants like carbon dioxide, ammonia, water and air. Hydrocarbo refrigerants. 2. LITERATURE SURVEY Pete Jacobs (2003) explains TheSmallHVAC SystemDesign Guide that provides design guidance on how to improve the installed performance of small packaged rooftop HVAC systems in commercial buildings. The document is targeted at architects, engineers, and design/build contractors involved in the design of small packaged rooftopsystemsfor commercial building applications. It includes information and advice on overall building design practices to minimize HVAC loads, unit selection and sizing, distribution and control system design, commissioning, and operations and maintenance. By applying the integrated designprinciplesin this document, the energy consumption and costs of buildings with small HVAC systems can be reduced by 25% to 35%. Impacts on building first costs are minimized through a combination of loadavoidancestrategiesdesigned to reduce the size and cost of the HVAC system, with simple paybacks of about 0.2 to 2.4 years. Along with integrated design, other design strategies suggested in this document focus on establishing and maintaining efficient operation of systems as they are installed in the field. Problems with equipment and controls (economizers, fan controls, thermostat programming), in-situair flow and fan power, refrigerant charge, and operation/maintenance practices that can lead to poor system performance are addressed. together with knowledge of the physical configurationofthe HVAC components and their relationships in systems. N Fernandez, MR Brambley and S Katipamula et all. (2009) made studies and explained self-correction algorithms developed in the Self- Correcting Heating, Ventilating and Air-Conditioning (HVAC) Controls project funded jointly by the Bonneville Power Administration and the Building Technologies ProgramoftheU.S. Departmentof Energy. The algorithms address faults for temperature sensors, humidity sensors, and dampers in air- handling units and correction of persistent manual overrides of automated control systems. All faults considered create energy waste when left uncorrected as is frequentlythecase in actual systems. The algorithms are presented in the form of a highly integrated set of flowcharts and include four processes are accomplished in the algorithms using passive observational fault detection, proactive tests for fault isolation (when needed), additional proactive testing for fault characterization for some faults, and formulation of a mathematical compensation for the fault to correct for the presence of the fault and permit continued operation of equipment. The processesflowchartsexpressthe algorithms as rules based on fundamental physical and engineering principles Andersson et al. designed heating and cooling loads for a sample commercial buildingatdifferentorientations,usinga development version of the building energy analysis computer program BLAST. They identified that the total loads were found to be higher for north than south orientation except in extreme southern latitudes of the U.S. Omar et al. calculated the hourly cooling load due to different kinds of wall, roof and fenestration using transfer function method (TFM). The output of this method was compared with the well-known Carrier program and the results were acceptable. In the case of coolingload,whenthe results were compared with the ASHRAE examples, some differences were noticed due to wall and roof. They also studied the effects of changing the wall coloroncoolingload. Adnan Shariah et al. studied theeffectofthe absorptanceof external surfaces of buildings on heating, cooling and total loads using the TRNSYS simulation program. Two types of construction materials, namely heavy weight concreteblock and light weight concrete were used in the simulation. They also calculated the effects of theabsorptanceon energyloads for insulated buildings. They reported that, for uninsulated buildings, as the absorptance was changed from one to zero, the total energy load decreased by 32%, while for insulated buildings, it decreased by 26% in Amman. Whereas the decrease was about 47% for uninsulated and 32% for insulated buildings in Aqaba 3. METHODOLOGY Design of the building: The basic design of the residential building is done using the REVIT MEP software based on the plan given by civil department. According to the plan thedesignofFCU(fan coil unit) is prepared and the heating and cooling load valuesare obtained for each and every space of the designed building and the values are mentioned in the following tables given below.
- 3. International Journal of Trend in Scientific Research and Development (IJTSRD) @ www.ijtsrd.com eISSN: 2456-6470 @ IJTSRD | Unique Paper ID - IJTSRD23314 | Volume – 3 | Issue – 3 | Mar-Apr 2019 Page: 1222 Fig 3: Layout of the building The basic plan is drawn in the above fig.3 based on the design parameters and the ceilings and roofs are mentioned in the below fig.4 and fig.6 and the layout is shown. Fig 4: Layout after fall ceiling Fig 5: Layout after ceiling Fig 6: 3D view of the building In fig 7. and fig.8 the heating and cooling load calculations is calculated by spacing following by zone spacing for individual spaces and by selecting the heating and cooling load the analytical values are obtained. The below fig.7 shows heating and cooling load values only for ground floor and fig.8 shows the heating and cooling load values for combined ground and first floor. Fig 7: Heating and cooling load analysis for ground floor Fig 8: Heating and cooling load analysis for ground and first floor 4. CALCULATIONS From the analysis of the building for ground and first floor the heating and cooling load values are obtained which are shown in below table 1 and table 2 for respective floor.
- 4. International Journal of Trend in Scientific Research and Development (IJTSRD) @ www.ijtsrd.com eISSN: 2456-6470 @ IJTSRD | Unique Paper ID - IJTSRD23314 | Volume – 3 | Issue – 3 | Mar-Apr 2019 Page: 1223 Table no.1 Heating and cooling load values of the ground floor Space Name Area (SF) Volume (CF) Peak Cooling Load (W) Cooling Airflow (L/s) Peak Heating Load (W) Heating Airflow (L/s) 1 Space 438 3,736.33 2,981 128.1 0 0.0 2 Space 438 3,736.33 2,981 128.1 0 0.0 3 Space 606 5,165.81 4,122 177.1 0 0.0 4 Space 521 4,442.87 3,545 152.3 0 0.0 5 Space 368 3,138.54 2,504 107.6 0 0.0 Table no.2 Heating and cooling load values of the first floor Space Name Area (SF) Volume (CF) Peak Cooling Load (W) Cooling Airflow (L/s) Peak Heating Load (W) Heating Airflow (L/s) 6 Space 438 3,736.33 11,157 641.8 1,292 138.0 7 Space 438 3,736.33 11,276 648.6 1,288 137.7 8 Space 606 5,165.81 14,199 816.8 1,598 170.8 9 Space 521 4,442.87 13,044 750.3 1,486 158.8 10 Space 368 3,138.54 9,501 546.5 1,093 116.8 By using the peak cooling load values obtained from the analysis the ton of refrigerationiscalculated byconvertingload values into tons mentioned in below table 3&4. Table no.3 The air flow rate and TR for the ground floor are listed below. SL NO FLOOR ROOM NAME FLOW (L/s) TONNES 1 GROUND SPACE 1 128.1 0.84 2 GROUND SPACE 2 128.1 0.84 3 GROUND SPACE 3 177.1 1.17 4 GROUND SPACE 4 152.3 1.0 5 GROUND SPACE 5 107.6 0.70 Table no.4 The air flow rate and TR for the first floor are listed below. 6 FIRST SPACE 6 641.8 3.17 7 FIRST SPACE 7 648.6 3.20 8 FIRST SPACE 8 816.8 4.0 9 FIRST SPACE 9 750.3 3.70 10 FIRST SPACE 10 546.5 2.70 RESULT Below results will show the TR values of all the floors and all the rooms SL NO FLOOR ROOM NAME TR 1 GROUND SPACE 1 0.84 2 GROUND SPACE 2 0.84 3 GROUND SPACE 3 1.17 4 GROUND SPACE 4 1.0 5 GROUND SPACE 5 0.70 6 FIRST SPACE 6 3.17 7 FIRST SPACE 7 3.20 8 FIRST SPACE 8 4.0 9 FIRST SPACE 9 3.70 10 FIRST SPACE 10 2.70 TOTAL 21.32
- 5. International Journal of Trend in Scientific Research and Development (IJTSRD) @ www.ijtsrd.com eISSN: 2456-6470 @ IJTSRD | Unique Paper ID - IJTSRD23314 | Volume – 3 | Issue – 3 | Mar-Apr 2019 Page: 1224 CONCLUSION From the above calculations the estimated 21.32 TRcapacity machine required. For this fan coil unit was used to maintain proper air conditioning. It is suitable for 12000-18000 CFM flow rate and 25-28 TR capacity. In this work the calculated cooling air flow values of each room in each floor and TR values of each room were calculated. The Capacity of unit required is 21.32 TR approximately but used 25-28 TR machine to avoid the fluctuations in the working. Based on the obtained cooling air flow values for each room and for all the floors the Duct Design was done by using AUTO_ DESK REVIT software.Allthediagramswereshownin the civil plan .Thus we can reach to a conclusion that our estimated values are enough to establish the airconditioning system in the specified location. By using HVAC system energy consumption of the building is reduced as possibleby avoiding unnecessary losses. This is one of the most well designed and most useful methods in the present day installations. REFERENCES [1] Jacobs, P. 2003. Small HVAC Problems and Potential Savings Reports. P500-03-082A-25, California Energy Commission, Sacramento, CA. [2] Fernandez, N., M.R. Brambley and S. Katipamula. 2009. Self-Correcting HVAC Controls: Algorithms forSensors and Dampers in Air-Handling Units, PNNL-19104, Pacific Northwest National Laboratory, Richland, WA. [3] Andersson,B., Wayne P. and Ronald K., " The impact of building orientationonresidentialheatingand cooling" , Energy and Buildings,1985; 8; 205-224. [4] Al-Rabghi,O. and Khalid A. , " Utilizing transferfunction method for hourly cooling load calculations" Energy Conversion and Management,1997; 38; 319-332 [5] Shariah,A., Bassam S., Akram R. and Brhan T.," Effects of absorptance of external surfaces on heating and cooling loads of residential buildings in Jordan"Energy Conversion and Management,1998; 39; 273-284.