Analysis of rainfall intensity of kunigal taluk, tumkur district, karnataka using gis techniques
•
1 like•656 views

IJRET : International Journal of Research in Engineering and Technology is an international peer reviewed, online journal published by eSAT Publishing House for the enhancement of research in various disciplines of Engineering and Technology. The aim and scope of the journal is to provide an academic medium and an important reference for the advancement and dissemination of research results that support high-level learning, teaching and research in the fields of Engineering and Technology. We bring together Scientists, Academician, Field Engineers, Scholars and Students of related fields of Engineering and Technology.

Recommended
Recommended
More Related Content
What's hot
What's hot (20)
Viewers also liked
Viewers also liked (20)
Similar to Analysis of rainfall intensity of kunigal taluk, tumkur district, karnataka using gis techniques
Similar to Analysis of rainfall intensity of kunigal taluk, tumkur district, karnataka using gis techniques (20)
More from eSAT Publishing House
More from eSAT Publishing House (20)
Recently uploaded
Recently uploaded (20)
Analysis of rainfall intensity of kunigal taluk, tumkur district, karnataka using gis techniques
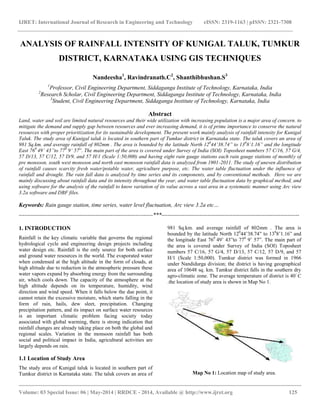
- 1. IJRET: International Journal of Research in Engineering and Technology eISSN: 2319-1163 | pISSN: 2321-7308 __________________________________________________________________________________________ Volume: 03 Special Issue: 06 | May-2014 | RRDCE - 2014, Available @ http://www.ijret.org 125 ANALYSIS OF RAINFALL INTENSITY OF KUNIGAL TALUK, TUMKUR DISTRICT, KARNATAKA USING GIS TECHNIQUES Nandeesha1 , Ravindranath.C2 , Shanthibhushan.S3 1 Professor, Civil Engineering Department, Siddaganga Institute of Technology, Karnataka, India 2 Research Scholar, Civil Engineering Department, Siddaganga Institute of Technology, Karnataka, India 3 Student, Civil Engineering Department, Siddaganga Institute of Technology, Karnataka, India Abstract Land, water and soil are limited natural resources and their wide utilization with increasing population is a major area of concern. to mitigate the demand and supply gap between resources and ever increasing demand, it is of prime importance to conserve the natural resources with proper prioritization for its sustainable development. The present work mainly analysis of rainfall intensity for Kunigal Taluk. The study area of Kunigal taluk is located in southern part of Tumkur district in Karnataka state. The taluk covers an area of 981 Sq.km. and average rainfall of 802mm . The area is bounded by the latitude North 120 44’38.74” to 130 8’1.16” and the longitude East 760 49’ 43”to 770 9’ 57”. The main part of the area is covered under Survey of India (SOI) Toposheet numbers 57 C/16, 57 G/4, 57 D/13, 57 C/12, 57 D/9, and 57 H/1 (Scale 1:50,000) and having eight rain gauge stations each rain gauge stations of monthly of pre monsoon, south west monsoon and north east monsoon rainfall data is analyzed from 1901-2011. The study of uneven distribution of rainfall causes scarcity fresh water/potable water, agriculture purpose, etc. The water table fluctuation under the influence of rainfall and drought. The rain fall data is analyzed by time series and its components, and by conventional methods. Here we are mainly discussing about rainfall data and its intensity throughout the year, and water table fluctuation data by graphical method, and using software for the analysis of the rainfall to know variation of its value across a vast area in a systematic manner using Arc view 3.2a software and DBF files. Keywords: Rain gauge station, time series, water level fluctuation, Arc view 3.2a etc… ----------------------------------------------------------------------***------------------------------------------------------------------------ 1. INTRODUCTION Rainfall is the key climatic variable that governs the regional hydrological cycle and engineering design projects including water design etc. Rainfall is the only source for both surface and ground water resources in the world. The evaporated water when condensed at the high altitude in the form of clouds, at high altitude due to reduction in the atmospheric pressure these water vapors expand by absorbing energy from the surrounding air, which cools down. The capacity of the atmosphere at the high altitude depends on its temperature, humidity, wind direction and wind speed. When it falls below the due point, it cannot retain the excessive moisture, which starts falling in the form of rain, hails, dew sleet, precipitation. Changing precipitation pattern, and its impact on surface water resources is an important climatic problem facing society today associated with global warming, there is strong indication that rainfall changes are already taking place on both the global and regional scales. Variation in the monsoon rainfall has both social and political impact in India, agricultural activities are largely depends on rain. 1.1 Location of Study Area The study area of Kunigal taluk is located in southern part of Tumkur district in Karnataka state. The taluk covers an area of 981 Sq.km. and average rainfall of 802mm . The area is bounded by the latitude North 120 44’38.74” to 130 8’1.16” and the longitude East 760 49’ 43”to 770 9’ 57”. The main part of the area is covered under Survey of India (SOI) Toposheet numbers 57 C/16, 57 G/4, 57 D/13, 57 C/12, 57 D/9, and 57 H/1 (Scale 1:50,000). Tumkur district was formed in 1966 under Nandidurga division; the district is having geographical area of 10648 sq. km. Tumkur district falls in the southern dry agro-climatic zone. The average temperature of district is 40◦ C .the location of study area is shown in Map No 1. Map No 1: Location map of study area.
- 2. IJRET: International Journal of Research in Engineering and Technology eISSN: 2319-1163 | pISSN: 2321-7308 __________________________________________________________________________________________ Volume: 03 Special Issue: 06 | May-2014 | RRDCE - 2014, Available @ http://www.ijret.org 126 1.2 Measurement of Rainfall Rainfall and other forms of precipitation are measured in terms of depth, the values being expressed in millimeters. One millimeter of precipitation represents the quantity of water needed to cover the land with a 1mm layer of water, taking into account that nothing is lost through drainage, evaporation or absorption. Instrument used to collect and measure the precipitation is called rain gauge. Rainfall varies greatly both in time and space with respect to time – Temporal variation, with space – Spatial variation. The temporal variation may be defined as hourly, daily, monthly, seasonal variations and annual variation (long-term variation of precipitation), and spatial variation is due to space, time and geographical area. 1.3 Objectives of Study In the study area total 108 years rainfall data is collected and it is analyzed by the conventional methods and non conventional methods To analyze the rainfall data (1901 to 2011) of Kunigal taluk, Tumkur by a standard methods which is mentioned below. Interpretation of South-west, North-east monsoons over an area about 108 years. 2. METHODOLOGY The rainfall details collected in monthly wise of 108 years in the eight locations in the Kunigal taluk prior existing rain gauge stations in taluk currently maintained by KSDMC and analyzed conventional methods such as arithmetic mean method Thiessen polygon method, and non conventional methods are Thiessen polygon using Arc GIS software. . Rain fall data is analyzed by time series followed by the trend variation, the seasonal variation, and also by moving average method of three years and five years . 2.1 Computing Average Rainfall:- 2.1.1 Airthematic Mean Method:- 𝑝 = 𝑝1 + 𝑝2 … + 𝑝𝑖 + ⋯ + 𝑝 𝑛 𝑁 = 1 𝑁 𝑝𝑖 𝑁 𝑖=1 2.1.2 Thiessen Polygon Method p = {P1A1 + P2A2 … … … + Pm Am } (A1 + A2 + ⋯ + Am ) = Pi Ai A m i=1 Where: The ratio ( Ai A ) is called the weight age factor of station i. 2.1.3 Moving Average Method F(t+1) = (Most Recent K data values) K i.e., 𝐹 𝑡+1 = ( 𝐴1 + 𝐴2 + 𝐴3) 𝐾 For 3-years moving average similarly for 5- years where 𝐹(𝑡+1) - Forecasting period values, t- Time / period A - Actual value of the time series in period. 2.1.4 Drought Calculations:- %𝑑𝑟𝑜𝑢𝑔ℎ𝑡 = 𝑃( 1, 2, 3 … ) 𝑃 − 1 ∗ 100 3. RESULTS The table 1 shows the average annual rainfall from the 2001 to 2010 the maximum rainfall accrued the taluk during 2001-2010 is 883.94mm and minimum rainfall is 668.77mm. Thiessen polygon area of the concern raingauge station is as shown below and the total entire area of the taluk will be 981 sqkm . Table 1 Annual rainfall and Theissen polygon area 3.1 Drought Calculations The table 2 is shown the drought calculations of the study area from the 1901 to 2010 of pre monsoon south west monsoon and north east monsoon the NR = Normal rainfall, SLD = slight drought, MD = Moderate drought, SR = Sever drought. SL.NO STATIONS ANNUAL RAINFALL (2001-2010) Thiessen polygon area Sqkm 1 Amruturu 786.97 131.6596 2 Bilidevalaya 668.77 186.2881 3 Huliyurudugra 877.24 216.9549 4 Kunigal S F 855.48 82.24542 5 Kunigal T B 798.09 54.47195 6 Markonahalli 685.84 109.2605 7 Nidasale 762.66 59.55078 8 Santhepete 883.94 141.1155 9 Maximum 883.94 216.9549 10 Minimum 668.77 54.47195
- 3. IJRET: International Journal of Research in Engineering and Technology eISSN: 2319-1163 | pISSN: 2321-7308 __________________________________________________________________________________________ Volume: 03 Special Issue: 06 | May-2014 | RRDCE - 2014, Available @ http://www.ijret.org 127 Table 2 Drought calculations. Rainfall calculations of 108 years of pre monsoon , south west monsoon and north east monsoon as shown in table 3, 4,&5 . Table 3 pre monsoon rainfall statists Table 4 South west monsoon statists Table 5 North East monsoon statists 3.2 Thiessen Polygon Area The Thiessen polygon is studies performed by using Arc GIS 3.2a and Arc view software, fig 1 shows the construction of Thiessen polygon with concern rain gauge stations existing in Kunigal taluk, area of the each polygon is calculated and tabulated in table no 1. Fig 1 Thiessen polygons of Kunigal area total rainfa ll N R S L D M D S D M in . Ma x. Me an SD Pre monso on (1-4) 168.2 8 5 6 1 7 2 2 14 5 4 375 115 73.1 7 south west monso on (5-8) 413.0 3 6 0 1 8 2 3 8 1 2 3 864 398 153. 1 north east monso on (9- 12) 220.6 7 5 8 1 8 1 7 16 1 0 604 206 11.2 Year (1901- 2011) Jan Feb Mar Apr May Pre- Monso on AVG 2.2 8 2.8 2 11.4 1 43.3 108.4 168.28 MIN 0 0 0 0 4 54 MAX 64 33 164 174 290 375 SD 7.9 8 6.9 4 30.7 9 39.93 53.89 73.19 VAR 53. 8 43. 5 906. 4 1535. 8 2814. 1 5354.5 Year (1901- 2011) Jun Jul Aug Sep South West Monsoon AVG 67.3 81.2 114.5 149.9 413 MIN 0 11 4 0 123 MAX 185 282 413 388 864 SD 43.1 54.5 81.97 91.95 153.1 VAR 1888.4 2976.7 6720.5 8456.5 23462.1 Year (1901- 2011) Oct Nov Dec North East Monsoo n Total AVG 156.4 54 10.1 220.67 802 MIN 0 0 0 10 292 MAX 421 365 126 604 1322 SD 91.55 57.3 18.9 111.22 207.0 8 VAR 8383. 2 3290. 6 359.0 3 12370.5 42886
- 4. IJRET: International Journal of Research in Engineering and Technology eISSN: 2319-1163 | pISSN: 2321-7308 __________________________________________________________________________________________ Volume: 03 Special Issue: 06 | May-2014 | RRDCE - 2014, Available @ http://www.ijret.org 128 4. CONCLUSIONS The graph of pre monsoon, south-west & north-east monsoons shows the increasing trend rainfall in which it shows Kunigal taluk receives normal rainfall of 802 mm annually, 413 mm in south-west Monsoon, 221mm during North-East Monsoon and 168 during Pre-Monsoon season. Therefore, the average annual rainfall of Kunigal taluk is 802mm and the standard deviation of this taluk is 20.708. Hence, the co-efficient of variation is 25.821 . From the three years and five years moving average calculations the rainfall for three and five years maximum and minimum rainfall will be notified and the average rainfall of the entire taluk from 1901-2011will be analyzed and trend analysis is tabulated. And the coefficient of variance Cv of rainfall is about 25.82% during annually, 37% in South-West Monsoon, 50.4% in North-East Monsoon & 43.48% in Pre- Monsoon season. Maximum rainfall received during the end of September & in the October and particularly during 40th to 45th standard Weeks. The trend line shows the increasing pattern of rainfall. ACKNOWLEDGEMENTS The special thanks to Dr V.S Prakesh Director and Dr Srinivasa reddy scientist KSDMC for the providing the rainfall data REFERENCES [1]. A.S Chandrabose et al. Development of fully distributed rainfall-runofff modal (FDRRM) using RS and GIS, Journal of applied hydrology vol XXIV No.3&4,Jul&Sep,-2011,pp76-83 [2]. C.R Suribabu et al. Evaluation of design rainfall depth from 100 years of daily rainfall –A case study, Journal of applied hydrology vol XXIV No.3&4,Jul&Sep,-2011,pp18-28. [3]. Dr.NM Tipparudrappa et al Stastical analysis of rainfall distribution and trend rainall anomalies in the two districts of Karnataka , HYDRO 2010 pp362-369 [4]. M R Yadupathi putty et al. Rainfall variation over the last two decades a comparision between two districts of karanataka ISH Journal vol 13 no.2 sept 2007 pp 93-107. [5]. N.R Patel et al. Probability Distribution Analysis of comsective Days Rainfall Data for Sabarkantha District of North Gujrath Region, India HYDRO 2007 pp 86-93. [6]. Subramanya K, Engineering Hydrology. [7]. www.aboutcivil.org/net/rainfall analysis [8]. www.ksndmc.net [9]. www.imd.com/weather at web [10]. www.cgwb.in/bangalore. BIOGRAPHIES Professor, Civil Engineering Department, Siddaganga Institute of Technology, Karnataka, India Research scholar, Siddaganga Institute of Technology, Civil Engineering Dept Tumkur Student , SIT Civil Engineering department Tumkur
- 5. IJRET: International Journal of Research in Engineering and Technology eISSN: 2319-1163 | pISSN: 2321-7308 __________________________________________________________________________________________ Volume: 03 Special Issue: 06 | May-2014 | RRDCE - 2014, Available @ http://www.ijret.org 129 The below table (Q1= jan+feb+mar+apr) followed remaining Q2, Q3 &Q4 , shows the moving average of rainfall throughout the year in every monthly data is tabulated and formulated as show in table no 6. Table 6 Rainfall data with seasonal YEAR Q1 Q2 Q3 Q4 Total Rainfall 3yr- moving avg 5yr- moving avg 1901 16 220 468 307 1011 - - 1902 0 121 176 213 510 - - 1903 0 293 530 385 1208 - - 1904 0 158 258 175 591 909.67 - 1905 41 158 236 117 552 769.67 - 1906 11 128 766 241 1146 783.67 774.4 1907 18 267 205 68 558 763 801.4 1908 0 166 110 16 292 752 811 1909 23 200 417 279 919 665.33 627.8 1910 0 171 458 341 970 589.67 693.4 1911 0 193 132 206 531 727 777 1912 0 179 443 221 843 806.67 654 1913 6 217 457 87 767 781.33 711 1914 0 137 241 228 606 713.67 806 1916 0 225 520 284 1029 738.67 743.4 1917 70 269 545 175 1059 800.67 755.2 1918 16 173 310 178 677 898 860.8 1919 18 247 194 270 729 921.67 827.6 1920 1 147 196 60 404 821.67 820
- 6. IJRET: International Journal of Research in Engineering and Technology eISSN: 2319-1163 | pISSN: 2321-7308 __________________________________________________________________________________________ Volume: 03 Special Issue: 06 | May-2014 | RRDCE - 2014, Available @ http://www.ijret.org 130 1921 7 175 362 252 796 603.33 779.6 1922 11 286 242 401 940 643 733 1923 47 194 263 24 528 713.33 709.2 1924 1 151 367 32 551 754.67 679.4 1925 2 226 450 217 895 673 643.8 1926 11 152 338 120 621 658 742 1927 0 138 410 45 593 689 707 1928 12 96 316 319 743 703 637.6 1929 7 207 327 278 819 652.33 680.6 1930 0 207 168 358 733 718.33 734.2 1931 11 219 235 180 645 765 701.8 1932 0 209 288 494 991 732.33 706.6 1933 0 208 694 195 1097 789.67 786.2 1934 0 140 107 205 452 911 857 1935 0 172 463 302 937 846.67 783.6 1936 82 190 404 175 851 828.67 824.4 YEAR Q1 Q2 Q3 Q4 Total Rainfall 3yr- moving avg 5yr- moving avg 1937 28 289 191 159 667 746.67 865.6 1938 13 131 625 10 779 818.33 800.8 1939 4 264 287 604 1159 765.67 737.2 1940 0 345 232 321 898 868.33 878.6 1941 0 213 232 190 635 945.33 870.8 1942 0 285 222 254 761 897.33 827.6
- 7. IJRET: International Journal of Research in Engineering and Technology eISSN: 2319-1163 | pISSN: 2321-7308 __________________________________________________________________________________________ Volume: 03 Special Issue: 06 | May-2014 | RRDCE - 2014, Available @ http://www.ijret.org 131 1943 17 268 318 407 1010 764.67 846.4 1944 142 245 336 176 899 802 892.6 1945 0 298 222 95 615 890 840.6 1946 18 123 309 330 780 841.33 784 1947 9 144 241 115 509 764.67 813 1948 7 241 222 157 627 634.67 762.6 1949 0 83 417 296 796 638.67 686 1950 0 170 332 276 778 644 665.4 1951 0 305 382 143 830 733.67 698 1952 0 217 297 416 930 801.33 708 1953 0 216 230 351 797 846 792.2 1954 5 341 247 171 764 852.33 826.2 1955 39 309 449 222 1019 830.33 819.8 1956 0 214 92 488 794 860 868 1957 19 325 212 308 864 859 860.8 1958 21 446 207 178 852 892.33 847.6 1959 0 279 440 91 810 836.67 858.6 1960 8 269 512 266 1055 842 867.8 1961 10 246 109 198 563 905.67 875 1962 22 270 339 248 879 809.33 828.8 1963 0 155 202 286 643 832.33 831.8 1964 0 182 496 361 1039 695 790 1965 0 166 328 68 562 853.67 835.8
- 8. IJRET: International Journal of Research in Engineering and Technology eISSN: 2319-1163 | pISSN: 2321-7308 __________________________________________________________________________________________ Volume: 03 Special Issue: 06 | May-2014 | RRDCE - 2014, Available @ http://www.ijret.org 132 1966 0 169 429 259 857 748 737.2 1967 7 189 191 133 530 819.33 796 1968 14 263 187 87 551 649.67 726.2 1969 0 200 208 306 714 646 707.8 1970 14 318 282 208 822 598.33 642.8 1971 30 178 456 147 811 695.67 694.8 1972 0 334 329 207 870 782.33 685.6 1973 0 294 599 395 1288 834.33 753.6 1974 4 250 561 153 968 989.67 901 1975 34 225 716 347 1322 1042 951.8 YEAR Q1 Q2 Q3 Q4 Total Rainfall 3yr- moving avg 5yr- moving avg 1976 0 163 276 135 574 1192.67 1051.8 1977 37 388 361 453 1239 954.67 1004.4 1978 0 139 367 175 681 1045 1078.2 1979 17 132 309 189 647 831.33 956.8 1980 0 307 350 199 856 855.67 892.6 1981 0 201 422 136 759 728 799.4 1982 0 258 187 53 498 754 836.4 1983 0 200 377 142 719 704.33 688.2 1984 172 131 351 204 858 658.67 695.8 1985 61 217 440 84 802 691.67 738 1986 17 107 476 125 725 793 727.2 1987 0 286 357 362 1005 795 720.4
- 9. IJRET: International Journal of Research in Engineering and Technology eISSN: 2319-1163 | pISSN: 2321-7308 __________________________________________________________________________________________ Volume: 03 Special Issue: 06 | May-2014 | RRDCE - 2014, Available @ http://www.ijret.org 133 1988 36 274 838 86 1234 844 821.8 1989 7 141 318 177 643 988 924.8 1990 1 213 143 248 605 960.67 881.8 1991 26 409 341 272 1048 827.33 842.4 1992 0 294 370 243 907 765.33 907 1993 0 277 389 243 909 853.33 887.4 1994 64 158 210 208 640 954.67 822.4 1995 18 121 388 108 635 818.67 821.8 1996 6 235 521 146 908 728 827.8 1997 0 227 462 169 858 727.67 799.8 1998 0 123 602 183 908 800.33 790 1999 4 199 401 390 994 891.33 789.8 2000 6 143 372 345 866 920 860.6 2001 0 153 370 207 730 922.67 906.8 2002 29 173 146 187 535 863.33 871.2 2003 35 66 201 236 538 710.33 806.6 2004 5 427 504 126 1062 601 732.6 2005 33 323 429 319 1104 711.67 746.2 2006 134 178 43 144 499 901.33 793.8 2007 0 337 479 144 960 888.33 747.6 2008 162 228 436 185 1011 854.33 832.6 2010 30 256 373 292 951 823.33 927.2 2011 15 299 291 264 869 974 905
- 10. IJRET: International Journal of Research in Engineering and Technology eISSN: 2319-1163 | pISSN: 2321-7308 __________________________________________________________________________________________ Volume: 03 Special Issue: 06 | May-2014 | RRDCE - 2014, Available @ http://www.ijret.org 134 The trend analysis map shows the slightly increasing trend but the rainfall is same because it is unevenly distributed. Shown in fig 2 Fig 2 shows the trend analysis of rainfall (1901-2011) Fig 3 shows the 3y moving average of rainfall Fig 4 shows the 5y moving average of rainfall Seasonal variation of rainfall (2001-2010) corresponding to table no 1.is shown in fig 6. Fig 6 seasonal variation of rainfall Seasonal variation of rainfall from 1901-2011 and each season wise like pre monsoon, southwest monsoon and North east monsoon is shown in the fig 8,9,&10 Fig 7 seasonal variation of rainfall(1901-2011) 0 500 1000 1500 1901 1916 1930 1944 1958 1972 1986 2000 ANNUALRAINFAALL YEARS TREND Total annual Linear (Total annual) 0 200 400 600 800 1000 1200 1400 1901 1914 1928 1941 1954 1967 1980 1993 2006 RAINFALLinmm YEARS TOTAL ANNUAL RAINFALL 3yr-moving avg 0 200 400 600 800 1000 1200 1400 1901 1916 1930 1944 1958 1972 1986 2000 RAINFALLinmm YEARS TOTAL ANNUAL RAINFALL 5yr-moving avg 0 100 200 300 400 500 600 Q1 Q4 Q3 Q2 Q1 Q4 Q3 Q2 Q1 Q4 Q3 Q2 Q1 Q4 Q3 20002001200220032004200520062007200820102011 SEASONA VARIATION Linear (SEASONA VARIATION) 0 200 400 600 800 1000 1901 1910 1920 1929 1938 1947 1956 1965 1974 1983 1992 2001 2011 Seasonal variation of rainfall PRE-MONSOON SOUTH-WEST MONSOON NORTH-EAST MONSOON
- 11. IJRET: International Journal of Research in Engineering and Technology eISSN: 2319-1163 | pISSN: 2321-7308 __________________________________________________________________________________________ Volume: 03 Special Issue: 06 | May-2014 | RRDCE - 2014, Available @ http://www.ijret.org 135 Fig 8 Pre monsoon rainfall (1901-2011) Fig 9 south west monsoon (1901-2011) Fig 10 North east monsoon (1901-2011) 0 100 200 300 400 1901 1914 1928 1941 1954 1967 1980 1993 2006 PRE-MONSOON Pre- Monsoon Linear (Pre- Monsoon) 0 200 400 600 800 1000 1901 1916 1930 1944 1958 1972 1986 2000 SOUTH-WEST MONSOON south-west monsoon Linear (south-west monsoon) 0 100 200 300 400 500 600 700 1901 1914 1928 1941 1954 1967 1980 1993 2006 North-East Monsoon North-East Monsoon Linear (North-East Monsoon)