Statistical Optimization of Keratinase Production from Marine Fungus

To improve the yield of keratinase from marine fungus Scopulariopsis brevicaulis, different medium constituents were optimized using response surface methodology (RSM) based on central composite design (CCD). The strain produced 24.8U/mL and 36.4U/mL of keratinase activity in conventional method of optimization with glucose and soya bean meal as carbon and nitrogen sources. Response surface methodology which was applied to optimize concentrations of glucose, soya bean meal, feather powder and inoculum level, improved the productivity to 225.0U/mL. This value represents 6.18 fold increases in productivity as compared to conventional methods. Optimal parameters of the cultivation process were determined as glucose 1.52g/L, soya bean meal-1.08g/L, feather powder-1.04g/L and inoculum level-10.6%.

Recommended
Recommended
More Related Content
What's hot
What's hot (19)
Viewers also liked
Viewers also liked (13)
Similar to Statistical Optimization of Keratinase Production from Marine Fungus
Similar to Statistical Optimization of Keratinase Production from Marine Fungus (20)
Recently uploaded
Recently uploaded (20)
Statistical Optimization of Keratinase Production from Marine Fungus
- 1. S.Satya lakshmi et al., Int. Journal of Engineering Research and Application www.ijera.com ISSN : 2248-9622, Vol. 5, Issue 2, ( Part -1) February 2015, pp.52-58 www.ijera.com 52 | P a g e Statistical Optimization of Keratinase Production from Marine Fungus S.Satya lakshmi*, G.Girija Shankar, T.Prabhakar, T.Satish, Pharmaceutical Biotechnology Division, College of Pharmaceutical Sciences, Andhra University, Visakhapatnam-530003, Andhrapradesh, India. Abstract To improve the yield of keratinase from marine fungus Scopulariopsis brevicaulis, different medium constituents were optimized using response surface methodology (RSM) based on central composite design (CCD). The strain produced 24.8U/mL and 36.4U/mL of keratinase activity in conventional method of optimization with glucose and soya bean meal as carbon and nitrogen sources. Response surface methodology which was applied to optimize concentrations of glucose, soya bean meal, feather powder and inoculum level, improved the productivity to 225.0U/mL. This value represents 6.18 fold increases in productivity as compared to conventional methods. Optimal parameters of the cultivation process were determined as glucose 1.52g/L, soya bean meal-1.08g/L, feather powder-1.04g/L and inoculum level-10.6%. Keywords: Keratinase, Marine sponge, Response surface methodology, Scopulariopsis brevicaulis, Glucose, soya bean meal. I. Introduction Chicken feathers are produced from poultry farms as undegradable waste material. Feathers are composed with keratin. Keratins are highly stable, insoluble fibrous proteins composed of tightly packed α-helix (α-keratin, e.g., hairs) or β-sheet (β-keratin, e.g., feathers) intertwined polypeptide chains which form dense network of intermediate filaments (IF) (Cohlberg, 1993). Keratin is the major constituent of skin, nails, hair, horns and wool. The high number of disulfide bonds in keratin makes it insoluble and indigestible by nature ((FilipelloMarchisio, 2000). Feathers are processed to animal feed material using thermal (Wang and Parsons, 1997) and chemical methods. But the enzymatic hydrolysis is the most convenient method to convert insoluble waste as soluble material without producing air pollution. Biodegradation of keratin containing feathers were achieved by incubating feathers with keratinase producing organisms. Production of Keratinase from various terrestrial organisms was reported previously by Williams et al., (1990) and Shankar et al., (2014) from Bacillus, Noval and Nickerson (1959) and Amany et al., (2009) from Streptomyces, Orr (1969) and Jitendra Kumar and Kushwaha (2014) from fungi. keratinases are having high specificity and efficiency in bio-degradation of insoluble feathers to animal feed stuff. Keratinases are also useful in cosmetic technology, leather and textile industry, in ungual drug delivery (Adriano Brandelli, 2008). Because of wide applications, keratinases are gaining importance commercially. So, the present research focused to isolate new marine fungus from sponges where as very few organisms were reported previously from marine sources. These marine organisms are having more salt tolerance and abundant keratinase producing ability. To reach the industrial needs it required to improve the yield of enzyme by application of optimization methods. Compared to conventional methods statistical methods are more advantageous as they required less time and simultaneously more than one parameter is optimized at five different levels. The present study was focused to optimize medium constituents for keratinase production by isolating fungus from marine sponges. Statistical methods like Response surface methodology (RSM) was applied to find out the effect of individual component on keratinase production and interaction between different components. II. Materials and Methods 2.1 Isolation of organism Fungus strain Scopulariopsis brevicaulis (MTCC 11794) isolated from marine sponges collected from Kulasekarapattinam, Tuticori district, Tamil Nadu using soluble keratin medium. Keratin substrate was prepared by method of Wawrzkiewicz et al., (1991). 2.2 Production of keratinase Keratinase from marine fungus was produced from the production medium containing MgSO4.H2O-0.5; KH2PO4-0.1; FeSO4.7H2O-0.01; ZnSO4.7H2O-0.005 g/L; Distilled water-500mL and Sea water-500mL; pH adjusted to 7.5 and the plates were incubated up to 5 days at room temperature (280 C±20 C) (Saber et al., 2009). RESEARCH ARTICLE OPEN ACCESS
- 2. S.Satya lakshmi et al., Int. Journal of Engineering Research and Application www.ijera.com ISSN : 2248-9622, Vol. 5, Issue 2, ( Part -1) February 2015, pp.52-58 www.ijera.com 53 | P a g e 2.3 Assay of keratinase: Keratinolytic activity was assayed as follows: 1mL of crude supernant was diluted in 0.2M, pH 7.0 Tris- acetate buffer and incubated with 0.5% of 1mL of soluble keratin solution at 50o C for 30min; reaction was arrested by adding 15% of TCA. After cooling the mixture was centrifuged and absorbance was determined at 280nm against control. One unit (U/mL) of keratinolytic activity was defined as an increase of corrected absorbance of 280 nm (A280) (modified method by Gradisar et al., 2005) with the control for 0.01 per minute under the conditions described above and calculated by the following equation: U=4×n×A280/ (0.01×T) Where n is the dilution rate; 4 is the final reaction volume (ml); T is the incubation time (min). 2.4 Screening of carbon and nitrogen sources by conventional method 11 carbon and 11 nitrogen sources were screened to identify the best carbon and nitrogen components for highest keratinase production. The following different carbon and nitrogen sources were tested such as glucose, glycerol, sucrose, lactose, sorbitol, mannitol, mannose, saccharose, potato starch, soluble starch, fructose and casein, yeast extract, peptone, tryptone, soya bean meal, urea, glycine, tyrosine, KNO3, NaNO3, meat extract. 0.2% of sample concentration was incorporated in basal mineral medium with 10% of fresh inoculum and incubated at 28O C, 120 rpm for about 5 days. III. Statistical optimization 3.1 Response surface method The optimum concentration and interaction of signal parameters namely glucose, soya bean meal, feather meal and inoculum level were studied by Response surface method. Basal mineral medium described above with variable concentrations of soya bean meal, glucose, feather meal and inoculum level was used for Response surface method studies. Each factor was studied at five different levels -2, -1, 0, +1, +2. A set of 28 experiments were generated and their actual and coded forms are listed in Table 1. A multiple regression analysis was performed on the data obtained. The following second-order polynomial equation was adopted to study the effects of variables to the response. Y=βo + β1X1 + β2X2 + β3X3 + β4X4 + β11X11 + β22X22 + β33X33 + β44X44 + β12X1X2 + β13X1X3 + β14X1X4 + β23X2X3 + β24X2X4 + β34X3X4 ----------------------- -------- (1) Where Y is the response (keratinase yield, U/mL), βo is the intercept term, β1, β2, β3, β4 the coefficients of linear terms and β11, β22, β33, β44 are the coefficients of quadratic terms and β12, β13, β14, β23, β24, β34 are the coefficients of interaction, X1, X2, X3, X4 represent the factors feather meal, glucose, soya bean meal, and % of inoculum respectively. IV. Results 4.1 Isolation of keratinase producing organisms The main interest of the present investigation is to isolate marine organisms having keratinase producing ability using cheap substrate like chicken feathers. Marine sponges were collected from Kulasekarapattinam, Tuticori district, Tamil Nadu. Among all isolates one fungus showing maximum keratinolytic activity (Figure.1) on soluble keratin containing mineral medium was selected for further study and it was identified as Scopulariopsis brevicaulis by IMTECH, Chandigarh, India. 4.2 Keratinase production Keratinase activity was assayed after 5 days of incubation in mineral salt medium utilizing chicken feathers as carbon and nitrogen sources. Without any prior treatment of feathers the present isolate degrading them in 5 days of short incubation period to produce keratinase. Several tons of feathers were produced from poultry industry every year and denaturation by some conventional methods like thermal and chemical treatment leads to air pollutants. Enzymatic and microbial hydrolysis is the effective alternative methods to denature feathers without causing air pollution. 16.06U/mL of keratinase activity was obtained after growing on basal mineral medium. 4.3 Optimization of carbon and nitrogen sources Among selected 11 carbon and 11 nitrogen sources glucose and soya bean meal were recorded as best sources for keratinase production with 24.8 and 36.4 U/mL of keratinase activity (Figure 2 and 3). Mannose and glycine recorded minimum keratinse production. 4.4 Statistical optimization The fitted second order response surface model as specified by Eq. (1) for keratinase activity (U/mL) in coded process variables is: Y= 224.87 + 0.6954 X1 + 1.4571 X2 + 7.0304 X3 + 3.1038 X4 -8.8230 X12 -9.3918 X22 -15.4730 X32 - 8.6318 X42 + 5.7956 X1* X2 + 6.1769 X1*X3 + 3.7056 X1*X4 -4.6569 X2*X3 -3.3256 X2*X4 - 1.8069X3*X4 ---------------- (1) ANOVA results of the model shown in Table 2 & 3. The goodness of the fit of the model verified by the determination coefficient R2 value. In this study, the R2 value for the keratinase production was 0.946. The value of the adjusted determination coefficient (Adj R2 = 0.888) advocates a high significance of the model. The Predicted R2 of 0.7206 is in reasonable
- 3. S.Satya lakshmi et al., Int. Journal of Engineering Research and Application www.ijera.com ISSN : 2248-9622, Vol. 5, Issue 2, ( Part -1) February 2015, pp.52-58 www.ijera.com 54 | P a g e agreement with the adjusted R2 of 0.8889. At the same time, a relatively lower value of the coefficient of variation (CV = 3.6%) indicates a better precision and reliability of the experiments carried out (Myers and Montgomery, 1995; Khuri and Cornell, 1987). The surface (3D) and contour (2D) plots based on Eq. (1) were prepared using STATISTICA 7.0 software. The surface plot (Figure 4a-4f) shows the behavioural change with respect to simultaneous change in two variables. The behaviour of keratinase production with respect to change in glucose and soya bean meal concentrations at specific hold values is shown in Figure 4a. From the figure it was observed that the contour plot is centered between soya bean meal and glucose indicating that the interaction between these two parameters is significant. It was observed that glucose at 1.48-1.6g/L(Figure 4a-4c) and soya bean meal at 0.98-1.18g/L (Figure 4a, 4d & 4e) concentrations were effective for enzyme production. Feather meal is the main source to produce keratinase from different organisms. From the figure 4b, 4d and 4f it was noticed the interaction behaviour of feather powder with other variables. It was observed that concentration of feather powder slightly depends on the soya bean meal concentration (Figure 4d). It was observed that feather powder concentration around 0.95-1.1 g/L is optimum for keratinase production (Figure 4b, 4d & 4f). It was noticed that the concentration of inoculum level around 11-9.7% is optimum for keratinase production (Figure 4c, 4e & 4f). From central composite design the optimum concentration for glucose, soya bean meal, feather powder and inoculum level were observed to be 1.52g/L, 1.08g/L, 1.04g/L and 10.6% respectively. The predicted enzyme production was 224.87U/mL. While conducting the experiments at the predicted optimum conditions, the keratinase production obtained was 225.00U/mL. V. Discussion Keratinases are the class of proteolytic enzymes. These enzymes are finding their applications in several industries. Keratinases utilizes keratin as substrate, which is the most important waste material produced high amount from slaughter house and poultry farms in the form of insoluble, undegradable feathers. In the present study keratinase was produced from marine fungus Scopulariopsis brevicaulis. Keratinase production from Scopulariopsis brevicaulis was previously reported by Anbu, Eman and Neveen and Malviya and maximum enzyme production possible only after 5 weeks and they were isolated same organism from poultry farm soil and Egyptian black soil. As compared to previous reports maximum amount of enzyme production was possible with short incubation period. RSM was successfully applied to the production of keratinase by Zauari et al., 2010. The present study showed that the maximum keratinase enzyme production was 225.0U/mL. Four factors glucose, soya bean meal, feather powder, inoculum level were optimized in this present study. The factors like glucose, soy flour and incubation time were employed for RSM optimization by Ekta Tiwary and Gupta 2010. The factors used by Zauari were feather meal, soy peptone, sodium chloride, potassium chloride and potassium dihydrogen phosphate and the factors like sucrose, yeast extract and feather keratin were used by Xian et al., 2010. Twenty eight run experimental set up was used in RSM in this present study for the production of enzyme keratinase. Twenty run experimental setup by Tiwary and Gupta and seven experimental setups for maximizing the production of keratinase using RSM were demonstrated by Xian et al. Similar work for keratinase production using response surface methodology was reported by Zauari et al., 2010, Xian et al., 2010 and Ekta Tiwary and Gupta, 2010. The medium components play an important role in keratinase production by fungus. Therefore designing an appropriate fermentation medium is of critical importance in optimizing the product yield. VI. Conclusion The statistical methods used in the present study enabled us to optimize the keratinase production medium, giving a 6.18-fold increase compared with the unoptimized medium. Thus statistical studies may prove useful for optimization of keratinases production by other micro-organisms too, thereby making their industrial application more promising.
- 4. S.Satya lakshmi et al., Int. Journal of Engineering Research and Application www.ijera.com ISSN : 2248-9622, Vol. 5, Issue 2, ( Part -1) February 2015, pp.52-58 www.ijera.com 55 | P a g e Table: 1 Experimental ranges and levels of the four independent variables used in RSM in terms of actual and coded factors Variables Actual coded actual Coded actual coded Actual coded actual Coded F.M (% w/v) 0.5 -2 0.75 -1 1.0 0 1.25 +1 1.5 +2 Glucose (% w/v) 0.5 -2 0.8 -1 1.0 0 1.2 +1 1.5 +2 S.B.M (% w/v) 0.5 -2 0.8 -1 1.2 0 1.5 +1 1.8 +2 Inoculum level (% v/v) 5 -2 8 -1 10 0 12 +1 15 +2 F.M- Feather meal, S.B.M- Soya bean meal. Table:2 Central composite design (CCD) of factors in coded value for optimization of process variables Trails Type F G S I Observed Keratinase activity(U/ml) Predicted Keratinase activity(U/ml) Residual Keratinase activity(U/ml) 1 Factorial -1 -1 -1 -1 179.3900 176.1575 3.23250 2 Factorial -1 -1 -1 1 180.9100 185.2188 -4.30875 3 Factorial -1 -1 1 -1 190.0300 190.7921 -0.76208 4 Factorial -1 -1 1 1 191.5500 192.6258 -1.07583 5 Factorial -1 1 -1 -1 186.9900 183.4454 3.54458 6 Factorial -1 1 -1 1 180.9200 179.2042 1.71583 7 Factorial -1 1 1 -1 179.3900 179.4525 -0.06250 8 Factorial -1 1 1 1 159.6200 167.9838 -8.36375 9 Factorial 1 -1 -1 -1 152.0200 146.1921 5.82792 10 Factorial 1 -1 -1 1 173.3100 170.0758 3.23417 11 Factorial 1 -1 1 -1 186.9900 185.5342 1.45583 12 Factorial 1 -1 1 1 196.1100 202.1904 -6.08042 13 Factorial 1 1 -1 -1 180.9100 176.6625 4.24750 14 Factorial 1 1 -1 1 185.4700 187.2438 -1.77375 15 Factorial 1 1 1 -1 199.1500 197.3771 1.77292 16 Factorial 1 1 1 1 200.6700 200.7308 -0.06083 17 Axial -2 0 0 0 191.5500 188.1921 3.35792 18 Axial 2 0 0 0 186.9800 190.9738 -3.99375 19 Axial 0 -2 0 0 183.9500 184.3938 -0.44375 20 Axial 0 2 0 0 190.0300 190.2221 -0.19208 21 Axial 0 0 -2 0 141.3800 148.9221 -7.54208 22 Axial 0 0 2 0 183.9500 177.0438 6.90625 23 Axial 0 0 0 -2 174.8300 184.1404 -9.31042 24 Axial 0 0 0 2 205.2300 196.5554 8.67458 25 Center 0 0 0 0 221.9500 224.8750 -2.92500 26 Center 0 0 0 0 232.1200 224.8750 7.24500 27 Center 0 0 0 0 220.4300 224.8750 -4.44500 28 Center 0 0 0 0 225.0000 224.8750 0.12500 Table: 3 Anova values for keratinase production by RSM F value 16.43 P>F 0.000 R2 0.946 Adjusted R2 0.888 Predicted R2 0.72 Correlation variance 3.6
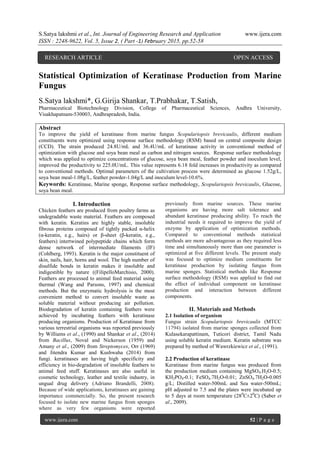
- 5. S.Satya lakshmi et al., Int. Journal of Engineering Research and Application www.ijera.com ISSN : 2248-9622, Vol. 5, Issue 2, ( Part -1) February 2015, pp.52-58 www.ijera.com 56 | P a g e Fig: 1: Scopulariopsis brevicaulis showing keratinolytic activity on soluble keratin medium Fig: 2: Effect of carbon source on keratinase production from S.brevicaulis Fig: 3: Effect of nitrogen source on keratinase production from S. brevicaulis 0 5 10 15 20 25 30 Keratinaseactivity(U/mL) Carbon sources (%) 0 5 10 15 20 25 30 35 40 Keratinaseactivity(U/mL) Nitrogen sources (%)
- 6. S.Satya lakshmi et al., Int. Journal of Engineering Research and Application www.ijera.com ISSN : 2248-9622, Vol. 5, Issue 2, ( Part -1) February 2015, pp.52-58 www.ijera.com 57 | P a g e Fig: 4a Contour plot showing the effect of Fig: 4bContour plot showing the effect of Glucose and S.B.M on keratinase production Glucose and feather meal on keratinase production Fig: 4d Contour plot showing the effect of Fig: 4c Contour plot showing the effect of Inoculums and glucose on keratinase production S.B.M and feather powder on keratinase production Fig: 4e Contour plot showing the effect of Fig: 4f Contour plot showing the effect of Inoculums and S.B.M on keratinase production inoculums and feather powder o keratinase production
- 7. S.Satya lakshmi et al., Int. Journal of Engineering Research and Application www.ijera.com ISSN : 2248-9622, Vol. 5, Issue 2, ( Part -1) February 2015, pp.52-58 www.ijera.com 58 | P a g e References [1.] Adriano Brandelli, Bacterial keratinases: Useful enzymes for bioprocessing agroindustrial wastes and beyond, Food Bioprocess Technol., 2008, 1:105-116. [2.] Amany L. Kansoh, Ebtsam N. Hossiny, Eman K. Abd EL-Hameed, Keratinase production from feathers wastes using some local Streptomyces isolates, Australian Journal of Basic and Applied Sciences, 2009, 3(2): 561-571. [3.] Anbu P, Gopinath SCB, Hilda A, Lakshmipriya T, Annadurai G, Optimization of extacellular keratinase production by poultry farm isolate scopulariopsis brevicaulis, Bioresource Technology, 2007, 98:1298-1303. [4.] Cohlberg, JA, The structure of α-keratin, Trends Biochem. Sci., 1993, 18:360-362. [5.] Ekta Tiwary, Rani Gupta, Medium optimization for a novel 58 KDa dimeric keratinase from Bacillus licheniformis ER- 15; Biochemical characterization and application in feather degradation and dehairing of hides. Bioresource Technology, 2010, 101: 6103-6110. [6.] Eman F. Sharaf, Neveen M. Khalil, Keratinolytic activity of purified alkaline keratinase produced by Scopulariopsis brevicaulis (Sacc.) and its amino acids profile. Saudi Journal of Biological Sciences, 2011, 18:117-121. [7.] Filipello V, Marchisio, Karatinophilic fungi: their role in nature and degradation of keratinic substrates. Rev Iber Micol., 2000, 17: 86- 92. [8.] Gradisar H, Friedrich J, Krizaj I, Jerala R, Similarities and specificities of fungal keratinolytic proteases: comparison of keratinase of Paecilomyces marquandii and Doratomyces microsporus to some known proteases. Appl. Environ. Microbiol., 2005, 71:3420- 3426. [9.] Jitendra Kumar, Kushwaha RKS, Screening of fungi efficient in feather degradation and keratinase production, Archives of Applied Science Research, 2014, 6 (1):73-78. [10.] Khuri AI, Cornell JA, Response surfaces: design and analysis. Marcel Dekker, Inc New York, 1987. [11.] Malviya HK, Rajak RC, Hasija SK, Purification and partial characterization of two extracellular keratinases of Scopulariopsis brevicaulis. Mycopathologia, 1992, 119:161-165. [12.] Myers RH, Montgomery DC Response surface methodology: process and product optimization using designed experiments. Wiley- Interscience., 1995. [13.] Noval JJ, Nickerson WJ, Decomposition of native keratin by Streptomyces fradiae. J. Bact., 77: 251, 1959. [14.] Orr GF, Keratinophilic fungi isolated from soils by a modified hair bait technique. bouraudia 1969; 7: 129-134. [15.] Saber WIA, EI-Metwally MM, EI-Hersh MS, Keratinase production and biodegradation of some keratinous wastes by Alternaria tenuissima and Aspergillus nidulans. Research journal of microbiology, 2009. [16.] Shankar T, Thangamathi P, Sathiya C, Sivakumar T, Statistical optimization of keratinase production by Bacillus thuringenisis, Journal of Global Biosciences, 2014, 3(2): 477-483. [17.] Wang X, Parsons CM, Effect of processing systems on protein quality of feather meal and hair meals, Poult. Sci., 1997, 76: 491- 496. [18.] Wawrzkiewicz KT, Wolski, Lobarzewski J, Screening the keratinolytic activity of dermatophytes in vitro. Mycophthologia, 1991, 114: 1-8. [19.] Williams, CM, Ritcher, CS, MacKenzie JM, Shih JCH, Isolation, identification and characterization of feather-degrading bacterium. Appl. Environ. Microbiol., 1990, 56, (8), 1509-1515. [20.] Xian LV, Sim MH, Li YD, Min J, Feng WH, Gban WJ, Li YG, Production, characterization and application of keratinase from Chryseobacterium 299 sp. nov., Process Biochem. 2010, 45: 1236- 1244. [21.] Zauari NF, Haddar A, Himidet N, Frikha F, Wasri M, Application of statistical experimental design for optimization of keratinase production by Bacillus pumilus A1 grown on chicken feather and some biochemical properties. Process Biochem., 2010, 45: 617-626.