Weekly Derivative Report Summary
•
1 like•274 views

The weekly derivative report recaps the performance of the stock market and derivative trading activity for the week. Key points include: - The Nifty index traded lower for the entire week, led by losses in banking stocks of around 5% compared to a 1.7% drop in the Nifty. - Bank Nifty futures saw increased volatility and breached support levels, signaling further downside potential towards 18,500. - FIIs were net sellers in the cash and futures segments while DIIs were net buyers, adding to downward pressure. - Put options saw increased open interest at strike prices of 8,500 and 8,700, indicating expectations of further declines in the Nifty.

Recommended
Recommended
More Related Content
What's hot
What's hot (20)
Viewers also liked
Viewers also liked (19)
Similar to Weekly Derivative Report Summary
Similar to Weekly Derivative Report Summary (20)
Recently uploaded
Recently uploaded (20)
Weekly Derivative Report Summary
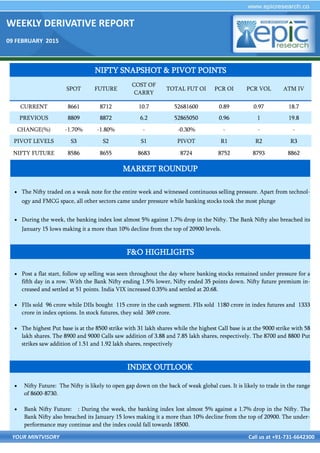
- 1. WEEKLY DERIVATIVE REPORT 09 FEBRUARY 2015 YOUR MINTVISORY Call us at +91-731-6642300 The Nifty traded on a weak note for the entire week and witnessed continuous selling pressure. Apart from technol- ogy and FMCG space, all other sectors came under pressure while banking stocks took the most plunge During the week, the banking index lost almost 5% against 1.7% drop in the Nifty. The Bank Nifty also breached its January 15 lows making it a more than 10% decline from the top of 20900 levels. Post a flat start, follow up selling was seen throughout the day where banking stocks remained under pressure for a fifth day in a row. With the Bank Nifty ending 1.5% lower, Nifty ended 35 points down. Nifty future premium in- creased and settled at 51 points. India VIX increased 0.35% and settled at 20.68. FIIs sold 96 crore while DIIs bought 115 crore in the cash segment. FIIs sold 1180 crore in index futures and 1333 crore in index options. In stock futures, they sold 369 crore. The highest Put base is at the 8500 strike with 31 lakh shares while the highest Call base is at the 9000 strike with 58 lakh shares. The 8900 and 9000 Calls saw addition of 3.88 and 7.85 lakh shares, respectively. The 8700 and 8800 Put strikes saw addition of 1.51 and 1.92 lakh shares, respectively Nifty Future: The Nifty is likely to open gap down on the back of weak global cues. It is likely to trade in the range of 8600-8730. Bank Nifty Future: : During the week, the banking index lost almost 5% against a 1.7% drop in the Nifty. The Bank Nifty also breached its January 15 lows making it a more than 10% decline from the top of 20900. The under- performance may continue and the index could fall towards 18500. NIFTY SNAPSHOT & PIVOT POINTS SPOT FUTURE COST OF CARRY TOTAL FUT OI PCR OI PCR VOL ATM IV CURRENT 8661 8712 10.7 52681600 0.89 0.97 18.7 PREVIOUS 8809 8872 6.2 52865050 0.96 1 19.8 CHANGE(%) -1.70% -1.80% - -0.30% - - - PIVOT LEVELS S3 S2 S1 PIVOT R1 R2 R3 NIFTY FUTURE 8586 8655 8683 8724 8752 8793 8862 F&O HIGHLIGHTS INDEX OUTLOOK MARKET ROUNDUP
- 2. WEEKLY DERIVATIVE REPORT 09 FEBRUARY 2015 YOUR MINTVISORY Call us at +91-731-6642300 INTRADAY STRATEGY i) INFOSYS LIMITED Ii) TATA STEEL LIMITED Buy Infosys limited future in range of 2252-2253 Sell Tata steel future in range of 368-367 View : Bullish View :Bearish Strategy : Buy Future Strategy : Sell Future Target1 : 2265 Target 2 : 2277 Target 1 : 361 Target 2 : 355 Stop loss : 2240 Stop loss : 374 Market Lot : 250 CMP : 2243.50 Market Lot : 500 CMP : 370.15 STOCK ANALYSIS OPEN INTEREST ACTIVITY LONG BUILD UP SHORT BUILD UP SYMBOL OI (LOTS) % CHNG PRICE %CHNG SYMBOL OI (LOTS) %CHNG PRICE %CHNG HDIL 25832000 12.18 115.00 8.70 ICICI BANK 74888750 3.44 332.00 1.73 SSLT 24343000 4.23 212.40 1.87 RPOWER 77912000 2.81 60.30 0.99 ITC 32608000 3.00 376.50 1.72 TATAMOTORS 23126000 5.89 563.55 5.04 NMDC 13710000 4.42 137.10 0.77 TATAPOWER 30380000 4.00 82.55 1.55 IDBI 23860000 2.12 66.45 0.91 BANKBARODA 26461250 3.61 176.75 0.45 OI addition : We saw long built up in Hdil, Ambujacem, Upl, Nmdc, Sslt short built up was seen in Gail, M&m, Sun tv, Canara bank OI Shedding : We saw short cover in Ibrealest, Sbin, Siemens while no long unwinding was seen in Syndi- cate bank, Bank india, Dlf, Ktk bank, Orient bank
- 3. WEEKLY DERIVATIVE REPORT 09 FEBRUARY 2015 YOUR MINTVISORY Call us at +91-731-6642300 OI Chart Analysis: From the OI Chart we can see that in February Series addition of open interest on the calls front is existent in the band at strike price of 9000-9100 indicating it as resistance on the up- side whereas on the put options front we can see that addition of open interest is existent at strike price of 8900-8800 indicating it as immediate support zone on the downside F&O TURNOVER INSTRUMENT NO. OF CONTRACTS TURNOVER(CR) PERCENTAGE CHANGE INDEX FUTURES 5,69,969 16,572.96 - STOCK FUTURES 8,37,874 26,127.50 - INDEX OPTIONS 53,67,200 1,28,911.66 0.80 STOCK OPTIONS 4,04,469 12,772.86 0.53 F&O TOTAL 71,79,512 1,84,384.98 0.78 NIFTY OPTION OI DISTRIBUTION 0 1000000 2000000 3000000 4000000 5000000 6000000 7000000 9400 9300 9200 9100 9000 8900 8800 8700 8600 8500 8400 OpenInterest Strike Price OI Concentration Chart Call OI (FEB) PutOI (FEB)
- 4. WEEKLY DERIVATIVE REPORT 09 FEBRUARY 2015 YOUR MINTVISORY Call us at +91-731-6642300 Instrument Type Symbol Expiry Date Option Type Strike Price LTP Traded Volume (Contracts) Traded Value (Lakhs) OPTSTK TATAMOTORS 26FEB2015 CE 600 5.25 4,358 13,200.16 OPTSTK TATASTEEL 26FEB2015 CE 400 4.05 3,602 7,297.65 OPTSTK RELIANCE 26FEB2015 CE 940 14.75 3,584 8,574.36 OPTSTK TATAMOTORS 26FEB2015 CE 580 10.05 3,521 10,396.81 OPTSTK AXIS BANK 26FEB2015 CE 600 8.80 2,839 8,631.27 MOST ACTIVE CALLS MOST ACTIVE PUTS Instrument Type Symbol Expiry Date Option Type Strike Price LTP Traded Volume (Contracts) Traded Value (Lakhs) OPTSTK TATASTEEL 26FEB2015 PE 360 10.75 2,865 5,292.80 OPTSTK TATAMOTORS 26FEB2015 PE 560 15.00 2,532 7,299.00 OPTSTK AXISBANK 26FEB2015 PE 550 13.95 1,956 5,553.08 OPTSTK INFOSYS 26FEB2015 PE 2,200 31.95 1,605 8,968.42 OPTSTK AXISBANK 26FEB2015 PE 560 18.40 1,578 4,589.14 FII ACTIVITY (IN RS. CRORE) BUY SELL OPEN INTEREST AT THE END OF THE DATE DERIVATIVE PRODUCT NO.OF CON- TRACTS AMOUNT IN CRORES NO.OF COTRACTS AMOUNT IN CRORES NO. OF CONTRACTS AMOUNT IN CRORES INDEX FUTURE 33684 842.18 63287 2021.95 857502 19709.95 INDEX OPTION 391464 10797.74 449240 12130.30 1970780 53885.73 STOCK FUTURE 91419 2731.35 103360 3100.79 1946942 58234.05 STOCK OPTION 71974 2164.80 72966 2202.32 78937 2376.94
- 5. WEEKLY DERIVATIVE REPORT 09 FEBRUARY 2015 YOUR MINTVISORY Call us at +91-731-6642300 DISCLAIMER The information and views in this report, our website & all the service we provide are believed to be reliable, but we do not accept any responsibility (or liability) for errors of fact or opinion. Users have the right to choose the product/s that suits them the most. Sincere efforts have been made to present the right investment perspective. The information contained herein is based on analysis and up on sources that we consider reliable. This material is for personal information and based upon it & takes no responsibility. The information given herein should be treated as only factor, while making investment decision. The report does not provide individually tailor-made investment advice. Epic research recommends that investors independently evaluate particular investments and strategies, and encourages investors to seek the advice of a financial adviser. Epic research shall not be responsible for any transaction conducted based on the information given in this report, which is in violation of rules and regulations of NSE and BSE. The share price projections shown are not necessarily indicative of future price performance. The information herein, together with all estimates and forecasts, can change without notice. Analyst or any person related to epic re- search might be holding positions in the stocks recommended. It is understood that anyone who is browsing through the site has done so at his free will and does not read any views expressed as a recommendation for which either the site or its owners or anyone can be held responsible for . Any surfing and reading of the information is the acceptance of this disclaimer. All Rights Reserved. Investment in equity & bullion mar- ket has its own risks. We, however, do not vouch for the accuracy or the completeness thereof. We are not responsible for any loss incurred whatsoever for any financial profits or loss which may arise from the recommendations above epic research does not purport to be an invitation or an offer to buy or sell any financial instrument. Our Clients (Paid or Unpaid), any third party or anyone else have no rights to forward or share our calls or SMS or Report or Any Information Provided by us to/with anyone which is received directly or indirectly by them. If found so then Serious Legal Actions can be taken. DATE SCRIP STRAT- EGY LOT ENTRY LEVEL TARGET SL REMARK PROFIT/LOSS 02/05/15 WIPRO LONG 500 648-649 655-661 642 1ST TGT 3000 02/05/15 BHEL SHORT 1000 273-272 269-266 276 2ND TGT 6000 PRICE VOLUME OI MARKET RISING UP UP STRONG RISING DOWN DOWN WEAK DECLINING UP UP WEAK DECLINING DOWN DOWN STRONG GENERAL RULES FOR OPEN INTEREST & VOLUME PERFORMANCE UPDATE