CFD Analysis on the Effect of Injection Timing for Diesel Combustion and Emission

This paper describes the effect of injection timing in diesel combustion. Ansys Fluent a computational fluid dynamics tool is used to study the combustion of diesel with three different injection timing. The fuel is injected before TDC, at TDC and after TDC. The parameters such as temperature, pressure, velocity, density, soot and NOx emission are compared. The specie transport model is used for modelling the combustion. Standard k-e (2 equ) is used for modelling the turbulence. The analysis is carried out by only considering the compression and expansion strokes. The pressure reaches the maximum when the fuel is injected before TDC and the maximum temperature is when injected at TDC. The NOx emission is less when the fuel is injected at TDC and the soot formation is when fuel injected before TDC.

Recommended
Recommended
More Related Content
What's hot
What's hot (19)
Viewers also liked
Viewers also liked (20)
Similar to CFD Analysis on the Effect of Injection Timing for Diesel Combustion and Emission
Similar to CFD Analysis on the Effect of Injection Timing for Diesel Combustion and Emission (20)
Recently uploaded
Recently uploaded (20)
CFD Analysis on the Effect of Injection Timing for Diesel Combustion and Emission
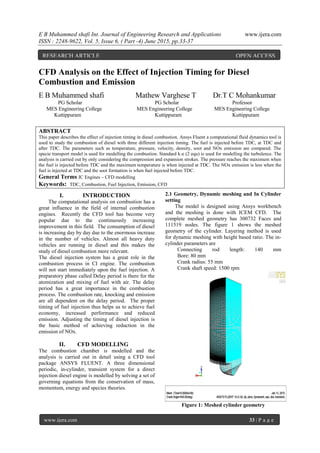
- 1. E B Muhammed shafi Int. Journal of Engineering Research and Applications www.ijera.com ISSN : 2248-9622, Vol. 5, Issue 6, ( Part -4) June 2015, pp.33-37 www.ijera.com 33 | P a g e CFD Analysis on the Effect of Injection Timing for Diesel Combustion and Emission E B Muhammed shafi Mathew Varghese T Dr.T C Mohankumar PG Scholar PG Scholar Professor MES Engineering College MES Engineering College MES Engineering College Kuttippuram Kuttippuram Kuttippuram ABSTRACT This paper describes the effect of injection timing in diesel combustion. Ansys Fluent a computational fluid dynamics tool is used to study the combustion of diesel with three different injection timing. The fuel is injected before TDC, at TDC and after TDC. The parameters such as temperature, pressure, velocity, density, soot and NOx emission are compared. The specie transport model is used for modelling the combustion. Standard k-e (2 equ) is used for modelling the turbulence. The analysis is carried out by only considering the compression and expansion strokes. The pressure reaches the maximum when the fuel is injected before TDC and the maximum temperature is when injected at TDC. The NOx emission is less when the fuel is injected at TDC and the soot formation is when fuel injected before TDC. General Terms IC Engines – CFD modelling Keywords: TDC, Combustion, Fuel Injection, Emission, CFD I. INTRODUCTION The computational analysis on combustion has a great influence in the field of internal combustion engines. Recently the CFD tool has become very popular due to the continuously increasing improvement in this field. The consumption of diesel is increasing day by day due to the enormous increase in the number of vehicles. Almost all heavy duty vehicles are running in diesel and this makes the study of diesel combustion more relevant. The diesel injection system has a great role in the combustion process in CI engine. The combustion will not start immediately upon the fuel injection. A preparatory phase called Delay period is there for the atomization and mixing of fuel with air. The delay period has a great importance in the combustion process. The combustion rate, knocking and emission are all dependent on the delay period. The proper timing of fuel injection thus helps us to achieve fuel economy, increased performance and reduced emission. Adjusting the timing of diesel injection is the basic method of achieving reduction in the emission of NOx. II. CFD MODELLING The combustion chamber is modelled and the analysis is carried out in detail using a CFD tool package ANSYS FLUENT. A three dimensional periodic, in-cylinder, transient system for a direct injection diesel engine is modelled by solving a set of governing equations from the conservation of mass, momentum, energy and species theories. 2.1 Geometry, Dynamic meshing and In Cylinder setting The model is designed using Ansys workbench and the meshing is done with ICEM CFD. The complete meshed geometry has 300732 Faces and 111519 nodes. The figure 1 shows the meshed geometry of the cylinder. Layering method is used for dynamic meshing with height based ratio. The in- cylinder parameters are Connecting rod length: 140 mm Bore: 80 mm Crank radius: 55 mm Crank shaft speed: 1500 rpm Figure 1: Meshed cylinder geometry RESEARCH ARTICLE OPEN ACCESS
- 2. E B Muhammed shafi Int. Journal of Engineering Research and Applications www.ijera.com ISSN : 2248-9622, Vol. 5, Issue 6, ( Part -4) June 2015, pp.33-37 www.ijera.com 34 | P a g e II.1 Turbulence modelling A turbulence model is a computational procedure to close the system of mean flow equation. The turbulence models allow the calculation of the mean flow without first calculating the full time dependent flow field. The fluctuation in velocity fields characterizes the turbulent flow. These fluctuations mix transported quantities such as momentum, energy and species concentration and cause the transported quantities to fluctuate. These fluctuations are difficult to simulate in practical engineering calculation instead the instantaneous governing equations can be averaged to small scales. In this present study standard k- ε model is selected. This model of turbulence are of two-equation model in which the solution of two separate transport equations allows the turbulent velocity and length scales to be independently determined. It is a semi- empirical model, and the derivation of the model equations relies on phenomenological considerations and empiricism. The turbulent (or eddy) viscosity, μt, is computed by combining k and ε as follows: µt = ρ cµ 2 k II.2 Combustion and Ignition model The combustion model used is species transport with volumetric reactions. The inlet diffusion and diffusion energy source is turned on. Eddy dissipation is used for turbulent chemistry interaction. This approach is based on the solution of transport equations for species mass fractions, with the chemical reaction mechanism defined by user. The reaction rates that appear as source terms in the species transport equations are computed from Arrhenius rate expressions, from the eddy dissipation model of Magnussen and Hjertager, or from the EDC model. Models of this type are suitable for a wide range of applications including premixed, partially premixed, and non-premixed combustion. Hardenburg ignition delay model is used for auto ignition. The auto ignition properties are Pre- Exponentials – 0.36 Pressure Exponent 0.63 Activation Energy – 82955.65 j/mol Cetane number -51 II.3 Fuel Injection and DPM modelling The fuel injected to the combustion chamber should be primarily break up into small droplets called primary breakup and this mechanism is characterized by the droplet size and breakup length. In the second phase which is called as secondary breakup the droplets is breakup into smaller ones. The primary breakup is the most important mechanism in fuel injection system as it determines the size of the droplet that separates from the liquid core. The fluent uses DPM model for spray stimulation and is based on the Euler- Lagrange method. The quantity of fuel injected is 0.00807 kg/s. Injection is done 200 BTDC, at TDC and 200 ATDC. II.4 Pollutant formation models NOx emission consists of mostly nitric oxide (NO), and to a lesser degree nitrogen dioxide (NO2) and nitrous oxide (N2O). NOx is a precursor for photochemical smog, contributes to acid rain, and causes ozone depletion. To predict NOx emissions, FLUENT solves a transport equation for nitric oxide (NO) concentration. When fuel NOx sources are present, FLUENT solves additional transport equations for intermediate species (HCN and/or NH3). When the N2O intermediate model is activated, an additional transport equation for N2O will be solved. The NOx transport equations are solved based on a given flow field and combustion solution. In other words, NOx is post processed from a combustion simulation. The prompt NOx model is used here for the NOx model and one step soot model is also activated as soot is also a major pollutant. The diesel is selected as fuel and oxygen as oxidant. The stoichiometry for soot combustion is given as 2.667and the soot formation constant is 1.5. III. BOUNDARY CONDITIONS AND INITIAL VALUES The boundary details involved in the in cylinder domain have to be supplied to facilitate the solution of momentum, and energy conservation equations. The boundary of the domain consists of a moving wall which is the piston head at the the bottom, periodic sides, stationary head at top and the cylinder walls. The velocity of piston is calculated from the engine speed, crank angle, connecting rod and stroke length. The initial values given for the calculations are Gauge pressure: 75105 pascal Turbulence kinetic energy: 1m2 s2 Turbulent dissipation rate: 1m2 s3 Temp: 358 k IV. RESULTS AND DISCUSSION The combustion analysis for diesel is carried out with fuel injection before TDC, at TDC and after TDC. The cycle pressure is shown in Figure. 2-4.
- 3. E B Muhammed shafi Int. Journal of Engineering Research and Applications www.ijera.com ISSN : 2248-9622, Vol. 5, Issue 6, ( Part -4) June 2015, pp.33-37 www.ijera.com 35 | P a g e The figure 2 shows the pressure vs time step diagram when the fuel is injected after TDC. The pressure initially increases and reaches a maximum value of 45 bar when the piston is at TDC and it reduces during the expansion stroke. The fuel starts injecting between crank angle 730 to 750 and a small rise in pressure can be seen in the diagram. The figure 3 shows the cycle pressure when the fuel is injected at TDC. Here the maximum pressure goes beyond 50 bar. And the pressure rise can be noted after the combustion initiated. The maximum pressure reaches to 80 bar when the fuel is injected before TDC and it is clearly visible from the cycle pressure diagram shown in figure 4.
- 4. E B Muhammed shafi Int. Journal of Engineering Research and Applications www.ijera.com ISSN : 2248-9622, Vol. 5, Issue 6, ( Part -4) June 2015, pp.33-37 www.ijera.com 36 | P a g e To understand the temperature variation over the cycle the temperature vs time step diagram is also included in figure 5-7. The figure 5 shows the temperature variation when the fuel is injected after TDC. The temperature increases in the compression and reaches a maximum of 900k and then decreases in the expansion stroke when the fuel is injected and the combustion initiates the temperature starts increasing and reaches a maximum value of 1500k and it reduces further and reaches up to 1400k. The figure 6 shows the temperature variation overt the cycle when the fuel is injected at TDC. Here the temperature after combustion reaches to 1300k and when the fuel is injected before TDC the temperature after combustion falls to 1100k. The figure 7 shows the temperature variation when the fuel is injected before TDC. The table 1 shows the various results obtained after the analysis. The density and velocity are different for different injection timing. The NOx emission is more when the fuel is injected before TDC and less when the fuel is injected at TDC. But the soot formation is more for at TDC and less for before TDC. Since more time is available for combustion the fuel and oxide after combustion is less for before TDC. Since the time available for combustion is less for injection after TDC the fuel and oxide wastage is more. Similarly the presence of co2, h20 and n2 is also higher for the before TDC injection as the time available is more.
- 5. E B Muhammed shafi Int. Journal of Engineering Research and Applications www.ijera.com ISSN : 2248-9622, Vol. 5, Issue 6, ( Part -4) June 2015, pp.33-37 www.ijera.com 37 | P a g e Table 1: Properties after combustion V. CONCLUSION The CFD analysis for the effect of fuel injection timing for diesel is proved to be very helpful. The variation in combustion properties with the change in fuel injection timing is studied. The NOx emission is found to be less when he fuel is injected at TDC. But the soot formation is less when the fuel is injected before TDC. The cycle pressure is also high when the fuel injected before TDC. The exhaust gas temperature will be higher when the fuel is injected after TDC. REFERENCES [1] S Gavudhama Karunanidhi, Nithin Balakrishnan, G Subba Rao , “CFD Studies of Combustion in Direct Injection Single Cylinder Diesel Engine Using Non-Premixed Combustion Model” , Journal of Engineering Research and Applications, vol 4, July 2014.. [2] Umakant V. Kongre , Vivek K. Sunnapwar, “CFD Modelling and Experimental Validation of Combustion in Direct Ignition Engine Fueled with Diesel” , International Journal of Applied Engineering Research, Volume 1, No 3, 2010 [3] Murari Mohon Roy, “Effect of Fuel Injection Timing and Injection Pressure on Combustion and Odorous Emissions in DI Diesel Engines”, Journal of Energy Resources Technology by ASME, Vol. 131 / 032201-1, SEPTEMBER 2009. [4] Tutorial: Modeling Non-Premixed Combustion, “14.1 Descriptions of the Equilibrium Mixture Fraction/ PDF Model, Fluent Inc. November 28, 2001”. Properties BEFORE TDC AT TDC AFTER TDC Density (kg/m3 ) 1.705 1.737 1.726 Velocity (m/s) 15.481 9.546 16.29 NOx 7.038e-06 1.63e-06 5.29e-06 Soot 2.374e-05 7.25e-05 6.82e-06 C10h22 0.00020 0.00412 0.00946 O2 0.01977 0.09084 0.10604 Co2 0.1957 0.1182 .106438 H20 0.0547 0.0541 0.0493 N2 0.7395 0.7327 0.732