
Recommended
Recommended
More Related Content
Similar to A Study on Process Improvement in the Assembly Line of Switch Manufacturing
Similar to A Study on Process Improvement in the Assembly Line of Switch Manufacturing (20)
Recently uploaded
Recently uploaded (20)
A Study on Process Improvement in the Assembly Line of Switch Manufacturing
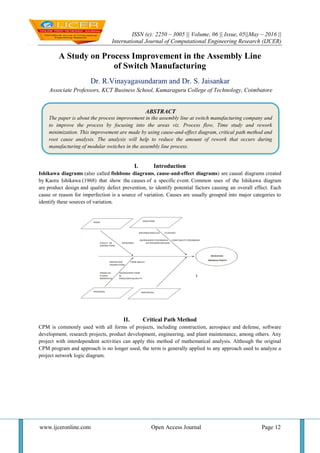
- 1. ISSN (e): 2250 – 3005 || Volume, 06 || Issue, 05||May – 2016 || International Journal of Computational Engineering Research (IJCER) www.ijceronline.com Open Access Journal Page 12 A Study on Process Improvement in the Assembly Line of Switch Manufacturing Dr. R.Vinayagasundaram and Dr. S. Jaisankar Associate Professors, KCT Business School, Kumaraguru College of Technology, Coimbatore I. Introduction Ishikawa diagrams (also called fishbone diagrams, cause-and-effect diagrams) are causal diagrams created by Kaoru Ishikawa (1968) that show the causes of a specific event. Common uses of the Ishikawa diagram are product design and quality defect prevention, to identify potential factors causing an overall effect. Each cause or reason for imperfection is a source of variation. Causes are usually grouped into major categories to identify these sources of variation. II. Critical Path Method CPM is commonly used with all forms of projects, including construction, aerospace and defense, software development, research projects, product development, engineering, and plant maintenance, among others. Any project with interdependent activities can apply this method of mathematical analysis. Although the original CPM program and approach is no longer used, the term is generally applied to any approach used to analyze a project network logic diagram. ABSTRACT The paper is about the process improvement in the assembly line at switch manufacturing company and to improve the process by focusing into the areas viz. Process flow, Time study and rework minimization. This improvement are made by using cause-and-effect diagram, critical path method and root cause analysis. The analysis will help to reduce the amount of rework that occurs during manufacturing of modular switches in the assembly line process.
- 2. A Study on Process Improvement in the Assembly… www.ijceronline.com Open Access Journal Page 13 III. Root Cause Analysis Root cause analysis (RCA) is a method of problem solving used for identifying the root causes of faults or problems. A factor is considered a root cause if removal thereof from the problem fault-sequence prevents the final undesirable event from recurring; whereas a causal factor is one that affects an event's outcome. Simulation after changing the mould for cavity 8 and rocker middle line: The below is the simulation of the change in the amount of time taken for the completion of a unit from the assembly unit. The amount of time taken to scrape the middle line of the rocker could be reduced to 2 seconds from 12 seconds. The amount of time taken to de flash the flash cover would be reduced to 3 seconds. Results after Simulation U3 - Modular Assembly Norms Details Per Qty Sl. No. Job Description Operation Type Norms Opn.Time Qty/Hr In Sec. 1 Screws Fixing F.Contact-10/20/32 550 7 Screws Fixing G.Terminal-10/20/32 550 7 2 Contact Assly AS101 150 24 3 Contact Cover Fixing AS101/As61 350 10 4 Final Assly AS101/As61 75 48 5 Deburring One-way Housing 175 21 6 Deburring One-way Cover 300 12 7 Deburring Front Cover-Rr 600 3 8 Panel Checking Rocker W/O - Rr 300 3 9 Panel Checking RS101 -Switch 400 9 10 FGI FGI 220 16
- 3. A Study on Process Improvement in the Assembly… www.ijceronline.com Open Access Journal Page 14 COMPARISON BETWEEN ACTUAL AND SIMULATED PROCESS Total amount of time taken in the initial process is 172 seconds The amount of time reduced is 12 seconds The amount of time consumed in the new process is 160 seconds The % of change is 6.97% IV. Conclusion By changing the mould for the flash cover, the time taken for rework can be reduced from 9.09% to 4.54%. By following the critical path, 6% of time consumed can be reduced for every unit produced, this will increase the production from 5500 to 5830 units each day. The process time of deburring can be reduced by 6.97% if the rocker design is modified. References [1] www.salzergroup.net/ [2] www.leanproduction.com/top-25-lean-tools.html [3] www.amscontrols.com/support/whitepapers/continuous-improvement-in-roll-forming [4] www.conceptdraw.com/examples/fishbone-analysis-example-pdf [5] www.technologystudent.com/joints/contin1a.htm