The Digital Insurer Award - HSBC Life (International) Limited
•
0 likes•81 views

The Digital Insurer Award - HSBC Life (International) Limited

Recommended
Recommended
More Related Content
What's hot
What's hot (20)
Similar to The Digital Insurer Award - HSBC Life (International) Limited
Similar to The Digital Insurer Award - HSBC Life (International) Limited (20)
More from The Digital Insurer
More from The Digital Insurer (20)
Recently uploaded
Recently uploaded (20)
The Digital Insurer Award - HSBC Life (International) Limited
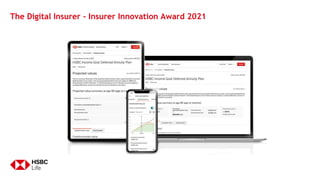
- 1. The Digital Insurer - Insurer Innovation Award 2021
- 2. 1 |PUBLIC| Introducing Digital Policy Value Projections What we noticed What we did about it Customers are curious to understand how their policy value grows over time Customers are eager to know the non- guaranteed cash value Customers want to know when their policy will break even, so they can plan when to surrender the policy for liquidity …and want all these answers instantly at their fingertips Launch of Digital Policy Value Projections A revolutionary platform for customers to view projected policy values, with enhanced features that are currently not available via paper illustrations: Real-time Graphical and interactive Additional figures: Expanded product scope: • Total projected premium paid calculation • Projected total benefit % • Non-participating endowment products, Annuity and Whole of Life policies *The Digital Insurer - Insurer Innovation Award 2020 winner • Understanding that customers often feel insurance is complex, HSBC Life launched the first-in-market Digital Policy Value Projections platform – a new function within its award-winning Insurance Dashboard*. • This innovative and exciting new functionality enables customers to have a simple and clear view of their current policy projection anytime, anywhere and without waiting until the anniversary for paper benefit illustrations.
- 3. 2 |PUBLIC| A new benchmark in Hong Kong’s insurance industry Available online and via mobile, the Digital Policy Value Projections platform not only provides customers with greater transparency on their policy values, but also simplifies complex policy information with an intuitive design and interactive charts. Annual Paper Illustrations Real-time Reprojections Projected benefit Cumulative received/projected value • Only sent to customers by mail on an annual basis • Written request with a lead time of 3-4 days is required if they want to view their projected policy values before their next policy anniversary Customers can easily stay on top of their wealth matters anytime, anywhere
- 4. 3 |PUBLIC| Without compromising any calculations available in paper illustrations, we leveraged on a real-time calculation engine that uses the latest rates and charges to calculate accurate values, allowing us to be transparent with our customers. Customers can now view their real-time policy value projections whenever they wish. Greater transparency with real-time value projections Select ‘View future value projections’ on policy details page projections Projected benefit Cumulative received/projected value 2 i) FOUR tabs for easy navigation : Highlights, Payout benefit, Cash/ Surrender value and Death benefit ii) Information includes projected total premiums paid, cumulative received/ projected value, and projected benefit 1 HSBC Life new products, services and promotions at a glance Select any policy to view the projections Personal Internet Banking Mobile banking
- 5. 4 |PUBLIC| Case Study #1: Annuity with payout Kate has an HSBC Early Income Annuity Plan and is currently in the annuity period where she is receiving monthly payouts to support her retirement expenses. She wants to see the amount of her non-guaranteed payout when she turns 85 years old … The interactive chart shows the total payout and the guaranteed / non-guaranteed breakdown at any age, starting from the current policy year. 1. Select the ‘Payout benefit’ tab for details of monthly payouts 2. Tap the button to view the projected value at 85 3. The orange portion represents the non-guaranteed payout 4. The annual payout at age 85 (guaranteed and non-guaranteed) is shown 5. Both previous payouts and projected future payouts are shown 6. The payout benefit table shows the breakdown of the payout at a certain age (in 1-year or 5-year intervals) 1 2 3 4 5 6 Non-guaranteed payout at her age of 85
- 6. 5 |PUBLIC| 1. Tap on the Cash/Surrender value tab 2. Activate non-guaranteed portion and select age 80 3. Guaranteed/ non-guaranteed cash benefit and total payout against total premiums paid at age 80 are shown 4. This number includes all monthly annuity payouts received and cash benefit upon surrender 5. Cash/surrender values are shown in table format for easy comparison across the policy years Cash/Surrender value at age 80 4 2 3 Breakeven point 5 Death benefit 1. Tap on the Death Benefit tab 2. In this interactive chart, she can see her guaranteed/non-guaranteed Death benefit and total premiums paid across time 3. Also shown in table format for easy comparison across the policy years 1 3 Case Study #1: Annuity with payout Afterwards Kate wonders how much her cash benefit would be if she surrenders her policy at 80 years of age, and also how much her children would receive if anything happened to her … 2 1
- 7. 6 |PUBLIC| Tom has an annuity plan with HSBC and has chosen to rollover and accumulate all his paid monthly annuity payments to earn additional interest. He wants to check how much he is projected to receive if he were to surrender his policy at age 63 and also the amount his beneficiaries are projected to receive in the unfortunate event of his passing … 1. Tap on the Cash/Surrender value tab 2. Select age 63 to view his guaranteed/non-guaranteed cash benefit 3. The interactive chart shows the breakeven point with non-guaranteed cash value (orange) and without non-guaranteed cash value (green) 4. Tom can also expand the table to view the details Cash/Surrender value at age 63 1 3 2 4 Death benefit 1. Tap on the Death Benefit tab 2. The interactive chart shows guaranteed/non-guaranteed death benefit and total premiums paid across time; non-guaranteed continues to grow over time due to special bonus and accumulated dividend and interest 3. Tom can also expand the table to view more details At age 63, Tom’s guaranteed death benefit already exceeds the total premiums paid. 2 3 Case Study #2: Annuity with accumulating payments (rollover) 1
- 8. 7 |PUBLIC| Day 1 – Jack requests to change the settlement option from accumulation to payout. Day X - HSBC Life operations team changes the option; a notification will be issued once it has been completed. Dashboard will be updated and the re-projections page will reflect the latest settlement option.The payout tab will be shown in the following month. If the change happens mid-year, the first year will be prorated. From rollover to payout Jack is currently in the annuity period and has been accumulating his monthly payouts. However, his financial situation has recently changed and wants to cash out his monthly payouts to support his retirement expenses ... Day 1 The first year’s figure will be pro- rated if the change was processed mid-year. Day X This chart would reflect a decreasing trend (the previous accumulated cash value would remain). Cumulative received/projected value would remain the same. Five years later, Jack’s financial circumstances improve and he is ready to change the annuity settlement option from monthly payouts back to rollover and accumulate interest once again. The cash surrender and death benefit will be refreshed with an increasing trend, with figures commencing from the next anniversary. Case Study #3: Changing annuity settlement option during accumulation period
- 9. 8 |PUBLIC| Case Study #4: Adjusting dividend / interest rates According to the latest market conditions, HSBC Life decides to adjust its dividend / interest rates, customers then can see their latest projected returns on the reprojections page for transparency ... Day 1 – HSBC Life changes the dividend rate / interest rate. End of day 1 – HSBC Life operations team changes the rate table overnight; reprojection charts and figures will be refreshed. The non-guaranteed portion of the chart will reflect the new rates Day 1 End of day 1 The non- guaranteed figure will also be adjusted
- 10. 9 |PUBLIC| Case Study #5: Withdrawing dividends Bob is facing financial pressure and wants to withdraw his dividends from his policy account for liquidity. After processing his request, he is able to view his updated projected figures on the reprojections page to reflect his recent withdrawal ... Day 1 Day x Day 1 – Bob requests to withdraw dividends from his policy account. Day X– HSBC Life operations team processes the dividend withdrawal request and issues the payment; re-projection charts and figures will be refreshed, showing a decreasing trend on cash/surrender value. Quick link on Personal Internet Banking to submit request for withdrawal. Dividend account will be deducted. The surrender chart will be adjusted to show a drop in cash value since dividends have already been withdrawn.
- 11. 10 |PUBLIC| Case Study #6: Whole of Life Jessica has a Whole of Life policy with HSBC Life and wants to check its non-guaranteed cash value. She prefers using her desktop so she logs onto the Insurance Dashboard on Personal Internet Banking to find her policy details and value projections ... 1. Select the policy she wants to view from the insurance policy summary section. 2. On the policy details page, click Projected value of your policy to view the value on the re-projections page. 3. Under the section of projected values, projected total premiums paid, total projected cash benefit including guaranteed / non-guaranteed portions, and projected total benefit. are shown; tabs for cash/surrender value and death benefit are also available for more policy details. Non-guaranteed cash value (using desktop) 1 3 2
- 12. 11 |PUBLIC| 4. Projected cash value details can also be viewed in a table format, which highlights the cash/surrender values across the years until the policy matures 5. On the Death benefit tab, guaranteed and non-guaranteed death benefit against total premiums paid are shown in both chart and table views. Non-guaranteed cash value (using desktop) 4 5 With a chart view, growth of the non- guaranteed portion of the death benefit can be easily viewed. The table view provides the exact figures across the years at a glance. Case Study #6: Whole of Life (cont’d) Jessica has a Whole of Life policy with HSBC Life and wants to check its non-guaranteed cash value. She prefers using her desktop so she logs onto the Insurance Dashboard on Personal Internet Banking to find her policy details and value projections ...
- 13. 12 |PUBLIC| Achievements Having real-timeprojected values is really useful. I don’t have to wait for a year until my policy anniversary. I like how transparent this is. All the information is laid out in front of me. I think the charts are useful. I can see the projected trend of my policy value. I always lose or misplace my paper statements/illustrations so I like this online platform. Feedback from pilot testers Off to great start Since its launch in mid-October, the number of visits to the digital policy projections page have been increasing every month as we gradually raise awareness via commercialisation activities. In January, the number of visits increased by 15% (vs December) with the majority of the increase from mobile visits. This shows that customers value having their policy information in the palm of the hands as they keep track of finances at their fingertips. 63% of total visits in January came via mobile, which proves that our ‘mobile-first’ strategy is aligned with our customers’ needs and preferences. 0 4,000 8,000 12,000 16,000 20,000 Nov Dec Jan Visits Mobile visits Online visits
- 14. 13 |PUBLIC|