Channel Utilization and Network Selection for Cellular-WLAN
•Download as DOCX, PDF•
0 likes•49 views

This is part of the Master of Science (MSc) collaboration with the Massachusetts Institute of Technology (MIT) in year 2005. Attached is part of my Master of Science Thesis: "Policies For Cellular-WLAN Integration" by having a simulator which I had coded using C# and the analytical data and graphs with my simulation results and conclusion. Dr. Daniel Wong KS was my supervisor.

Recommended
Recommended
More Related Content
What's hot
What's hot (20)
Similar to Channel Utilization and Network Selection for Cellular-WLAN
Similar to Channel Utilization and Network Selection for Cellular-WLAN (20)
More from Hui-Shin Wong
More from Hui-Shin Wong (20)
Recently uploaded
Recently uploaded (20)
Channel Utilization and Network Selection for Cellular-WLAN
- 1. Channel Utilization and Network Selection Policy for Cellular-WLAN Integration Wong Hui Shin Faculty of Computing and Informatics, Multimedia University, Cyberjaya, Selangor, Malaysia. hswong@mmu.edu.my Daniel K S Wong Faculty of Information Technology, Malaysia University of Science and Technology Petaling Jaya, Selangor, Malaysia. dwong@must.edu.my Abstract— The ultimate goal of implementing Cellular-WLAN Integration is to combine Cellular and WLAN advantages to allow subscribers to enjoy higher data rate and lower cost of voice and data services, along with authentication, mobility and accounting features. This paper illustrates a computer simulation to justify the Cellular-WLAN Integration policies from the regional coverage perspective and implementation cost perspective. A computer simulation for Cellular-WLAN Integration performance is studied, planned, designed and implemented. This research focused on assessing the performance implication of channel utilization and network selection during frequent traveling. Keywords: Cellular-WLAN Integration, Channel Utilization and Network Selection 1.0 Introduction The idea of Cellular-WLAN integration is getting great support by the giant companies such as Malaysia’s Maxis Communications Bhd, Malaysia’s Digi Telecommunication, Japan’s NTT, Singapore’s StarHub, US-based T-mobile, Italy’s Telecom Italia, Australia’s Telstra, Avaya/Proxim/Motorola, Nokia, British Telecom, Texas Instruments, Toshiba, Intel, Cisco and etc. They have put in the efforts and walk out the first step to make Cellular-WLAN Integration a reality. Cellular-WLAN Integration refers to a mixture of Cellular Network and WLANs interconnected together. Cellular Networks refer to GSM/GPRS, UMTS Release 99’, cdma2000, etc. and the WLAN networks refer to wireless LANs (IEEE 802.11), HiperLan/2, etc (J.Blau, 2002). Cellular-WLAN integration is an advantageous combination of Cellular Network and WLAN (3GPP TS 23.234, 2004). It offers broad coverage and minimum deployment and consumption costs for the objective of providing a better quality and higher bandwidth of communication to the subscribers. The subscribers are provided with a seamless service and connection within roaming agreement interconnected networks environment by maintaining one account with a cellular operator. Subscribers also enjoy roaming facilities when they travel into other cellular operator’s or WLAN service providers’ service regions. A computer simulation for Cellular-WLAN integration is used to justify the Cellular-WLAN Integration policies from the regional coverage perspective and implementation cost perspective. 2.0 Network Selection Policy Network Selection Policy is mainly depends on the used network selection algorithm in a system. Besides, Network Selection Policy considers the network selection priority list. The issue rises for the conflicts or difficulties network selection is from the agreement between the service provider and mobile operator. The compromised agreement or a win-win agreement between service provider and mobile operator definitely reduced the conflicts and difficulties for network selection. The users in this content refer to the Cellular Network Subscribers. The subscribers are flexible enough to choose either a manual mode or an auto mode for the network selection within some intersection of Cellular Networks and WLAN. As also mentioned in Chapter 1, the subscribers have the right to list down their preference Cellular Network and WLANs during the service registration time. In this context, the simulation environment has limited Network Selection Policy into 3 types. 3.0 Channel Utilization Policy The simulations are being done to find out the Percentage of Dropped Call VS Initial Channel Allocation, I as a Percentage of Total Number of Users, N based on Network Selection Policy 3 by playing around the Channel Utilization Policy’s Simulation Parameters by I) fixed value of Average Time Interval for ON status, Average Time Interval for IDLE status and same Mobility Model with Total Number of Users is vary; II) fixed value of Average Time Interval for ON status, Average Time Interval for IDLE status and Total Number of Users with Mobility Model is vary, III) fixed value of Average Time Interval for IDLE status and same Mobility Model with Total Number of Users is vary and Average Time Interval for ON status is vary, IV) fixed value of Average Time Interval for ON status and same Mobility Model with Total Number of Users is vary and Average Time Interval for IDLE status is vary. A simulation is being done by using different Network
- 2. Selection Policies, V) fixed value of Average Time Interval for ON status, Average Time Interval for IDLE status, Total Number of Users and same Mobility Model with types of Network Selection Policy is vary. Graph 6, Graph 7, Graph 8, Graph 9, Graph 10, Graph 11, Graph 12, Graph 13, Graph 14 and Chart 1 are plotted based on the simulation processed data from Channel Utilization Output Calculation. 3.1 The Influences of the different Number of Users Graph 1: Percentage of Dropped Call VS Initial Channel Allocation, I as a Percentage of Total Number of Users, N where Average Time Interval for ON status = 3 min, Average Time Interval for IDLE status = 9 min, Total Number of Users = 25, 50 & 75, Policy 3 and Random Mobility Model with 100% moving (Simulation 3, 9 & 15) Graph 1 shows that simulation with 25 users has the least percentage of dropped call follows by simulation with 50 users and simulation with 75 users. The simulation with more users will have higher percentage of dropped call. The simulation with 25 users and 50 users reach the lowest percentage of dropped call when it has 40% of I as a percentage ofN. 3.2 The Influences of the different Mobility Model The users’ initial location is started with uniform distribution. Graph 2 shows that there is no significant different between the simulation with mobility model 20% users moving and 100% users moving. The graph also shows the simulation with mobility model 20% users moving and 100% users moving reach the lowest percentage of dropped call when it has 40% of I as a percentage of N. 3.3 The Influences of different average interval time for ON status with same IDLE status In general, the Graph 3, Graph 4 and Graph 5 show that the simulation with longest Average Time Interval for ON status will hit the highest percentage of dropped call. This is because within a longer Average Time Interval for ON status within a Cellular-WLAN Integration environment, more request channels are being made by the users. Graph 2: Percentage of Dropped Call VS Initial Channel Allocation, I as a Percentage of Total Number of Users, N where Average Time Interval for ON status = 3 min, Average Time Interval for IDLE status = 9 min, Total Number of Users = 25, 50 & 75, Policy 3 and Random Mobility Model, 100% Users Moving and 20% Users Moving (Simulation 9 & 19) Graph 3: Percentage of Dropped Call VS Initial Channel Allocation, I as a Percentage of Total Number of Users, N where Average Time Interval for ON status is vary, Average Time Interval for IDLE status = 9 min, Total Number of Users %of Dropped Call VS I asa %of N -20 0 20 40 60 80 100 120 0.00 20.00 40.00 60.00 80.00 100.00 120.00 140.00 160.00 I as %of N % of Dropped Call 25 Users 50 Users 75 Users %of Dropped Call VS I as a %of N 0 20 40 60 80 100 120 0.00 25.00 50.00 75.00 100.00 125.00 150.00 I as a %of N % of Dropped Cal 100% Users Moving 20% Users Moving %of Dropped Call VS I asa %of N 0 20 40 60 80 100 120 0.00 50.00 100.00 150.00 200.00 250.00 300.00 I as a %of N % of Dropped Cal N=25, O=3Min N=25, O=6Min N=25, O=9Min
- 3. = 25, Policy 3 and Random Mobility Model, 100% Moving (Simulation 3, 5 & 6) Graph 4: Percentage of Dropped Call VS Initial Channel Allocation, I as a Percentage of Total Number of Users, N where Average Time Interval for ON status is vary, Average Time Interval for IDLE status = 9 min, Total Number of Users = 50, Policy 3 and Random Mobility Model, 100% Moving (Simulation 9, 11 & 12) Graph 5: Percentage of Dropped Call VS Initial Channel Allocation, I as a Percentage of Total Number of Users, N where Average Time Interval for ON status is vary, Average Time Interval for IDLE status = 9 min, Total Number of Users = 75, Policy 3 and Random Mobility Model, 100% Moving (Simulation 15, 17 & 18) The Graph 3 and Graph 4 also shows those simulations with 25 users and 50 users reach the lowest percentage of dropped call when it has 40% of I as a percentage of N regardless of the time length for Average Time Interval for ON status. However, those simulations with 75 users reach the lowest percentage of dropped call when it has 55% of I as a percentage of N. 3.4 The Influences of different average interval time for IDLE status with same ON status In general, the Graph 6, Graph 7 and Graph 8 show that the simulation with longest Average Time Interval for IDLE status will hit the lowest percentage of dropped call. This is because within a longer Average Time Interval for IDLE status within a Cellular-WLAN Integration environment, less request channels are being made by the users. The Graph 6 and Graph 7 also shows those simulations with 25 users and 50 users reach the lowest percentage of dropped call when it has 40% of I as a percentage of N regardless of the time length for Average Time Interval for IDLE status. This means the total numbers of channel requests within the simulations with 25 users and 50 users are able to get communicated although the initial channel allocation is 60% less than the total number of users. However, those simulations with 75 users reach the lowest percentage of dropped call when it has 55% of I as a percentage of N. In simulation with 75 users, the total numbers of channel requests are able to get communicated although the initial channel allocation is 45% less than the total number of users. Graph 6: Percentage of Dropped Call VS Initial Channel Allocation, I as a Percentage of Total Number of Users, N where Average Time Interval for ON status = 3, Average Time Interval for IDLE status is vary, Total Number of Users = 25, Policy 3 and Random Mobility Model, 100% Moving (Simulation 1, 2, 3 & 4) %of Dropped Call VS I asa %of N 20 30 40 50 60 70 80 90 100 110 0.00 50.00 100.00 150.00 I as a %of N % of Dropped Cal N=50, O=3Min N=50, O=6Min N=50, O=9Min %of Dropped Call VS I asa %of N 30 40 50 60 70 80 90 100 110 0.00 20.00 40.00 60.00 80.00 100.00 120.00 I as a %of N % of Dropped Cal N=75, O=3Min N=75, O=6Min N=75, O=9Min %of Dropped Call VS I asa %of N 0 20 40 60 80 100 120 0.00 50.00 100.00 150.00 I as a %of N % of Dropped Cal N=25, Id=3Min N=25, Id=6Min N=25, Id=9Min N=25, Id=12Min
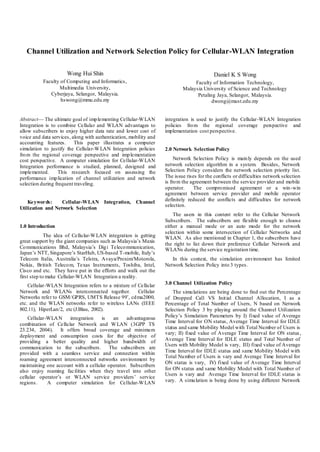
- 4. Graph 7: Percentage of Dropped Call VS Initial Channel Allocation, I as a Percentage of Total Number of Users, N where Average Time Interval for ON status = 3, Average Time Interval for IDLE status is vary, Total Number of Users = 50, Policy 3 and Random Mobility Model, 100% Moving (Simulation 7, 8, 9 & 10) Graph 8: Percentage of Dropped Call VS Initial Channel Allocation, I as a Percentage of Total Number of Users, N where Average Time Interval for ON status = 3, Average Time Interval for IDLE status is vary, Total Number of Users = 75, Policy 3 and Random Mobility Model, 100% Moving (Simulation 13, 14, 15 & 16) 3.5 The Influences of the type of Network Selection Policies Chart 1: Percentage Dropped Call VS Channels Condition where Average Time Interval for ON status = 6 min, Average Time Interval for IDLE status = 9 min, Total Number of Users = 50 and Random Mobility Model (Simulation 11) (Please refer to Table 11 for the definition of Channel Condition) Chart 1 shows that the Percentage Dropped Call in general versus the channel conditions in Cellular-WLAN Integration Environment with respect of 3 different Network Selection Policies. Observation shows Network Selection Policy 2 has the highest percentage dropped call. Network Selection Policy 3 achieves a higher percentage of dropped call than Network Selection Policy 1. As a general conclusion from Chart 1, Network Selection Policy 1 which has applied the “Directed Retry” network selection method within the Cellular-WLAN Integration environment gains the least percentage of dropped calls while the Network Selection Policy 2 gains the highest dropped call as a result of only applying the “Directed Retry” network selection method within the Cellular network only. %of Dropped Call VS I asa %of N 0 20 40 60 80 100 120 0.00 20.00 40.00 60.00 80.00 100.00 120.00 I as a %of N % of Dropped Cal N=50, Id=3Min N=50, Id=6Min N=50, Id=9Min N=50, Id=12Min %of Dropped Call VS I asa %of N 0 20 40 60 80 100 120 0.00 20.00 40.00 60.00 80.00 100.00 120.00 I as a %of N % of Dropped Cal N=75, Id=3Min N=75, Id=6Min N=75, Id=9Min N=75, Id=12Min %of Dropped Call VS Channel Condition 0 10 20 30 40 50 60 70 80 90 100 A B C E F G H Channel Condition % of Dropped Call Policy 3 Policy 2 Policy 1
- 5. Graph 9: Percentage of Dropped Call VS Initial Channel Allocation, I as a Percentage of Total Number of Users, N where Average Time Interval for ON status = 6 min, Average Time Interval for IDLE status = 9 min, Total Number of Users = 50 and Random Mobility Model (Simulation 11) From Graph 9, the observation shows Network Selection Policy 2 and Network Selection Policy 3 have achieved lowest percentage of dropped call (<20%) when they are 40% I as a percentage N. This means the total numbers of channel requests are able to get communicated although the initial channel allocation is 60% less than the total number of users. Network Selection Policy 1 is using the “directed retry” network selection approach to aim for having less initial channel allocation (the total channels available for each of the networks) within the Cellular-WLAN integration, but it able to support more users. Observation from Graph 1 shows the Network Selection Policy 1 have achieved up to 80% initial channel allocation less than the total number users. This encourages a broader coverage networks with lower cost implementation. And, the simulation with Network Selection Policy 1 has minimum of percentage ofdropped call. 4.0 Conclusion Based on the simulation results, in general, a small conclusion is drawn that each of the simulation parameters does affect the percentage of Dropped Call within a simulation environment. Based on all simulations with Network Selection Policy 3, the following conclusions are found. There is no significant different between the simulation with mobility model 20% users moving and 100% users moving. Higher number of users (75 users) leads to higher percentage of dropped call (≈0%) at low initial channel allocation as a percentage of total number of users (≈40%). Lower number of users leads to lower percentage of dropped call (<40%) at high initial channel allocation as a percentage of total number of users (<60%). Longer time length of average time interval for ON status and lower number of total users (25 users) lead to higher percentage of dropped call (<40%) at low initial channel allocation as a percentage of total number of users (≈40%). Shorter time length of average time interval for ON status and lower number of total users (25 users) lead to lower percentage of dropped call (≈10%) at low initial channel allocation as a percentage of totalnumber of users (≈40%). Longer time length of average time interval for OFF status and lower number of total users (25 users) lead to lower percentage of dropped call (<10%) at low initial channel allocation as a percentage of total number of users (≈40%). Shorter time length of average time interval for OFF status and lower number of total users (25 users) lead to higher percentage of dropped call (≈40%) at low initial channel allocation as a percentage oftotal number of users (≈40%). After the observation from simulations with Network Selection Policy 3, the percentage of dropped call can be minimized more by implementing appropriate network selection method like Network Selection Policy 1 instead of Network Selection Policy 3. Network Selection Policy 1 leads to the lowest percentage of dropped call (<20%) by having maximum of 80% initial channel allocation less than the total number of users. Network Selection Policy 2 and Network Selection Policy 3 achieve higher percentage of dropped call than Network Selection Policy 1 by having maximum of 60% initial channelallocation less than the totalnumber of users. 5.0 Future Enhancement & Suggestion The random uniform movement model adopted in a building simulation environment in this research is a weakness of this research. The mobile equipments start with a random uniform distributed location and their next movement location is a random uniform distributed location too. There is an option setting to limit only 20% of mobile equipment will move around in a building while 80% of the mobile equipment will stay static in a building. This might not be a realistic movement model within a building however; the research questions are answered by compromising the usage of random uniform movement model in a one-dimensional building view simulation environment. The reason behind is that the planning of the location and the radius coverage of a WLAN Access Point are not properly done, therefore, the random uniform movement model can project some situation whereby the simulation is not done within a building. Also, the user equipment within a building is very rarely to walk out from their subscribed WLAN, this shows the difficulties to justify the distinctions between the defined policies. This research still can be improved from the following 3 perspectives. %of Dropped Call VS I asa %of N 0 20 40 60 80 100 120 0.00 20.00 40.00 60.00 80.00 100.00 120.00 140.00 160.00 I as %of N % of Dropped Call Policy 3 Policy 2 Policy 1
- 6. Network Selection Policy Perspective - Load balancing is proposed as an enhancement for the “Directed Retry” network selection method. The load balancing is used in the situation of the number of users in a Network exceeds a certain threshold, the existing users are advised to switch to adequate neighboring cell to avoid disappointment from the new users’ request. Channel Utilization Policy Perspective – The observation from Graph 6 shows the Network Selection Policy 1 have achieved up to 80% initial channel allocation less than the total number of users. It is suggested to work future to improve Network Selection method or algorithm for the Network Selection Policy. The user mobility model should be improved by implementing some movement pattern instead of randomly uniform distributed regardless ofspeed and direction. Simulator Perspective – The interface of the simulator should be more user friendly, so that the users are able to add in the simulation parameters fromthe interface and get the final out come result with graph and charts. Besides, the simulations in table 12 should be tested by a more realistic movement model in different simulation environment such as the user equipment moving on the road and the user equipment moving outside the building with different traveling speed. 6.0 Summary The influence of different type of network selection policy, total number of initial channel allocation versus total number of users for each of the networks on channel utilization are analyzed by using mathematical analysis and computer simulations. The analysis results are considered with the proposed Cellular-WLAN integration communication scenarios. Direct roaming agreement, indirect roaming agreement and service agreement between Cellular operator and WLAN service providers ensure subscribers to get connected with maximum coverage when they travel. It is crucial to have an excellent Network Selection Policy with the dynamic network selection approach or algorithm, such as Network Selection Policy 1 as stated in Table 10 which is able to work on the statement to minimize the initial channel available in each of the network to accommodate the maximum number of userchannelrequest. A best combination of simulation parameters within a Channel Utilization Policy is needed. The proposed Channel Utilization Policy states a Network Selection Policy with a network selection approach or algorithm is needed to achieve more than 80% of Initial Channel Allocation less than the total number of User Channel Request within a Cellular-WLAN Integration. It is hard for us to predict the call arrivals pattern from the users, however, with the negatively-exponential distribution of Random Communication Time or Idle time, the time period for Average Time Interval for ON state or Average Time Interval for IDLE state is crucial. The Average Time Interval affects the percentage of Dropped Call in Cellular- WLAN integration system. The Chart 1, the Percentage Dropped Call VS Channel Condition shows the outstanding of the Network Selection Policy 1 where network uses “Directed Retry” in Cellular- WLAN Integration to dynamically relocate some of the channel requests to another networks according to Network Selection Priority List when the network faces less channel supply. The Channel Utilization Policy includes the proposal of the best combination of the optimal number of users, number of WLAN channel, number of Cellular Network channel in an exponential call arrival communication scenario to maximize overall performance of the Cellular-WLAN Integration. By excluding the movement pattern of the users’ mobility model, according to our observation in plotted graphs in Chapter 7, the channel utilization policy within the Cellular-WLAN integration is proposed as following: The ratio of the total number of initial channel allocation, I to total number of users, N within Cellular-WLAN Integration Environment is 5I:3N. It means the total number of initial allocation could be set at a level with 60% less than the total number of users. Total number of initial channel allocation for WLANs must be more than total number of initial channel allocation for Cellular WLAN at a ratio of at least 7:3. A Cellular-WLAN integration environment with excessive communication traffic should be incorporated with a network selection algorithm to achieve a minimum percentage of dropped call. To conclude, Cellular-WLAN Integration is a feasible solution to the community for the purpose of providing broad coverage and low cost in term of technology implementation and subscribers usage charges perspective. 6.0 References [1] 3GPP TS23.234. (2004). "3rd Generation Partnership Project; Technical Specification Group Service and System Aspects; 3GPP system to Wireless Local Area Network (WLAN) interworking; System Description V6.2.0", Sept 2004. [2] 3GPP TS33.234. (2004). "3rd Generation Partnership Project; Technical Specification Group Service and System Aspects; 3G Security; Wireless Local Area Network (WLAN)interworkingsecurity V6.2.1", Sept 2004. [3] 3GPP TS22.234 (2004). "3rd Generation Partnership Project; Technical Specification Group Service and System Aspects; Requirement on 3GPP system to Wireless Local Area Network (WLAN) interworking V6.2.0", Sept 2004. [4] 3GPP TR 22.934. (2003). "3rd Generation Partnership Project; Technical Specification Group Service and System Aspects; Feasibility Study on 3GPP System to Wireless Local Area Network (WLAN) InterworkingV6.2.0",Sept 2003. [5] 3GPP TS33.102. (2003). "3rd Generation Partnership Project; Technical Specification Group Service and System Aspects; 3G Security; Security architecture",Sept 2003. [6] 3GPP TR 21.133. (2001). "3rd Generation Partnership Project; Technical Specification Group Service and System Aspects; 3G Security; V4.1.0 (2001-12)". [7] 3GPP S2-031430 (2003). “PLMN Selection for 802.11 Type of WLAN”, Nokia,
- 7. [8] Retrieved April, 2003, from Web site: http://www.3G.org/ftp/tsg_sa/WG2_Arch/TSGS2_31_Seoul/tdocs/ S2- 031430.zip [9] A. A. William, S. Narendar & W. YC. Justion. (2001). "Your 802.11 wireless network has no clothes”. April 2001. [10] B. James. F (2004). “Traffic Generation Concepts Random Arrivals”, retrieved Nov. 20, 2004, from Web site: http://www.perfdynamics.com/Classes/Materials/BradyTraffic.pdf [11] B. Nikita, G. Ian, and W. David (2001). “Security of WEP Algorithm”, retrieved June. 20, 2004, from Web site: http://www.isaac.cs.berkeley.edu/isaac/wep-faq.html [12] C. Rigney et al. (2000). “Remote Authentication Dial In User Service (RADIUS)”, IETF RFC 2865, June 2000. [13] C. Roy, M. Dennis & M. Suvda. (2002). “Analysis of 3G Mobile Security”, Motorola, Software Research Group, Department of Computer Science, University of Illinois at Urbana-Champaign, retrievedMay. 01, 2004, from Website: [14] http://choices.cs.uiuc.edu/MobilSec/#Tools [15] Cisco Systems, Inc. (1993-2003). “Cisco ITP MAP Gateway for Public WLAN SIM Authentication andAuthorization whitepaper”. [16] Digi Malaysia. (2004). “DiGi's first HighSpeed Mobile NetworkTM ”, retrieved Jun. 06, 2004, from Web site: http://www.digi.com.my/mobile/gprsedge/ [17] ETSI TC-GSM. (1993). “GSM Security Aspects (GSM 02.09)”, Recommendation GSM 02.09, Version 3.1.0, European Telecommunications Standards Institute (ETSI), June 1993. [18] ETSI TC-GSM. (1994). “European Digital Cellular Telecommunications System (Phase 2): Security Related Network Functions (GSM 03.20). ETS 300 534, EuropeanTelecommunications Standards Institute (ETSI), September 1994. [19] Gartner, Inc. (2003). “Enterprises Must Consider Six Types of WLAN ‘Hot Spots’”, June. [20] Global Information, Inc. (n.d.). “Wi-Fi Hotspot Operator Case Studies”, retrieved Oct. 06, 2004, from Web site: http://www.gii.co.jp/english/ba11884_hotspot_operator_toc.html [21] G. Schäfer. (2003). “Netzsicherheit - Algorithmische Grundlagen und Protokolle”, dpunkt.verlag, 2003. [22] H. Haverinen & J. Salowey. (2005). Work in progress: “Extensible Authentication Protocol Method for GSM Subscriber Identity Modules (EAP-SIM)”, draft-haverinen-pppext-eap-sim-14.txt, April 25, 2005, Internet Draft. [23] IEEE Std 802.11a-1999. (1999). “Part 11: Wireless LAN Medium Access Control (MAC) and Physical Layer (PHY) Specifications; High Speed Physical Layerin the 5 GHz Band.” [24] Intel Corporation. (2003). “Public WLAN Hotspot Deployment and Interworking”. Intel Technology Journal, Volume 07, August, 19, retrieved Sept. 19, 2004, from Web site: http://www.intel.com/technology/itj/2003/volume07issue03/art02_hotsp ot/p02_intro.htm [25] Intel Corporation and Infocomm Development Authority of Singapore (2003-2004). [26] (2004). “Public WLAN Interworking Study”, Draft Revision 0.8, January 12, 2004. [27] G. Schafer, A. Festag & H. Karl. (2004). “Current Approaches to Authentication in Wireless and Mobile Communications Networks”. Telecommunication Networks Group, Technical University of Berlin, 26 March 2001, Version1.0 [28] J. Arkko & H. Haverinen. (2005). Work in progress: “Extensible Authentication Protocol Method for UMTS Authentication and Key Agreement (EAP-AKA)”, draft-arkko-pppext-eap-aka-13.txt, April 25, 2005, Internet Draft. [29] J.Blau. (2002). “WiFi” Hotspot Networks Sprout Like Mushrooms”, IEEE Spectrum,Sept. 2002,pp.18-20. [30] J. Schiller. (1994). “Mobile Communications - The Course”, Retrieved Sept. [31] 18, 2004, from Web site: http://www.inf.fuberlin.de/inst/ag- tech/resources/mobile_communications.htm [32] K. Ahmavaara, H. Haverinen & R. Pichna. (2003). "Interworking architecturebetween [33] 3GPP and WLAN systems, IEEE Communications Magazine, Volume: 41, Issue: 11, Pages:74– 81, November 2003. [34] L. Blunk & J. Vollbrecht. (1998). “PPP Extensible Authentication Protocol (EAP)”, IETF RFC 2284,Mar 1998. [35] L. Blunk et al. (2003). Work in progress: “Extensible Authentication Protocol (EAP)”, draft-ietf-eap-rfc2284bis-04.txt, June 2003, Internet Draft. [36] L.William.(2003). "The effort has been done." [37] M.Arunesh & A. A. William. (2002). "An initial security analysis of the IEEE802.1xstandard ". [38] M.Burrows, M. Abadi & R. Needham. (1989). "A logic for authentication". DES System Research Technical Report No. 39, Feb 1989. [39] M. K. Koien, T. Haslestad. (2003). "Security Aspects of 3G-WLAN Interworking”, IEEE [40] Communications Magazine, Volume: 41, Issue: 11, Pages:82 – 88, November 2003. [41] MIT, 18.013A. (2001). “Mathematic 18.013a Online Textbook: Calculation With Applications, Fall 2001”. Chapter 2, USA, retrieved Jan. 06, 2005, fromWebsite: [42] http://ocw.mit.edu/ans7870/18/18.013a/textbook/HTML/chapter02/secti on01.html [43] S. Fluhrer, I. Mantin & A. Shamir. (2001). "Weaknesses in the Key Scheduling Algorithm" of 8th Annual Workshop on Selected Areas in Cryptography, August 2001. [44] S. K. Apostolis, Motorola. (2004). “Interworking Techniques and Architectures for [45] WLAN/3G Integration Toward 4G Mobile Data Networks”. IEEE Wireless Communications, June 2004. [46] The Star News (2004). “Global WiFi roaming from Maxis”, Retrieved Thursday, November. [47] 18, 2004, fromWebsite: http://www.thestar.com.my [48] Trillium Digital Systems, Inc. (2000). “Third Generation (3G) Whitepaper”.Los [49] Angeles, CA., retrievedJun. 06,2004, from Website: [50] http://www.trillium.com/assets/wireless3g/whitepaper/8722019.pdf [51] Wong, Hui Shin., & KDaniel, Wong. (2004). Re-authentication Policy for Cellular-WLAN Integration. Proceedings of the International Computer Engineering Conference 2004, Computer Engineering Department, Faculty ofEngineeringCairoUniversity, Egypt.