SlideShare a Scribd company logo
1 of 114
Occupation & Industry
Projections
Office of Occupational and Labor Market Information
Delaware Department of Labor
John J. McMahon Jr., Secretary
July, 2012
Delaware
2020
Table of Contents
Occupation Projections by Occupational Group
..............................................1
Table 1: Occupation Projections by Occupational Group
......................4
Occupation Projections by Career Cluster
.......................................................19
Table 2: Occupation Projections by Career Cluster
..............................20
Industry
Projections..............................................................................
...........35
Table 3: Industry Projections
................................................................37
Acknowledgements & Contact Information
................................................... 40
Delaware 2020
Introduction
Every two years, the federal Bureau of Labor Statistics
produces industry and occupation forecasts for a period
ten years into the future and the states are asked to do
the same for their respective economies. This publication
presents Delaware’s efforts for the period 2010 to 2020.
It supersedes the last such set of projections, which were
generated for the 2008-2018 period and published in
October, 2010.
Delaware is projected to have 48,450 more jobs in 2020
than in 2010, for an average annual growth rate of 1.07
percent. Health Care and Social Assistance is expected to
create far and away the greatest number of jobs, with
projected growth of 13,140 jobs. More than one-quarter of
the net new jobs in Delaware are projected to come in this
industry. Already the state’s biggest industry in terms of
employment, it will be even more dominant by 2020.
Some of the projected job growth comes from the cyclical
nature of the economy. Delaware’s economy hit bottom
early in 2010, and the base year of 2010 average annual
employment represents the low point of the Great
Recession. For the projection year of 2020, the assumption
is that the economy will be at full employment (this is the
Occupation & Industry Projections
only theoretically sound assumption eight years in advance),
so the return of many of the jobs lost during the recession
is added to the expected growth trend. In other words, most
of the projected job growth is due to normally expected
population and economic growth, but some is from the
expected return of unemployment in the state to more
normal levels.
Another change in this publication is in the education
and training requirements of the occupations. In previous
editions, occupations were assigned one of eleven education
or training levels, which represented the expected
attainment to be considered competent in the field. For
this edition, the US Bureau of Labor Statistics (BLS)
has separated the single education/training category into
three distinct categories for each occupation: typical entry
level education, work experience in a related occupation,
and typical on-the-job training. To comply with national
standards, we have adopted the new BLS categories for
use in this publication. It should be noted that while the
education category represents the BLS assessment of
current typical educational requirements for entry into
an occupation, those requirements are subject to change.
When they do change, they almost always increase.
Occupation & Industry Projections 1
Occupation Projections by Occupational Group
Occupations With the Most Annual Openings, 2010–2020
In this section, we present job
projections and associated data for
495 specific occupations in Delaware,
listed by major occupational group.
The data elements provided for
each occupation are: the Standard
Occupational Classification (SOC)
code, an estimate of the total number
of filled jobs in the state in 2010, the
projection of total filled jobs in 2020,
the wage category, job availability,
and usual education, experience,
and training requirements. In the
following section we present these
same occupations arranged by the 16
career clusters used by state educators.
There you will find the forecasted
annual growth rate, annual openings
due to growth, annual openings due
to net replacement, and the 2010
estimated average annual wage for
each occupation.
Estimates of past employment
levels and projections of future
employment levels do not refer to
the demand for workers, nor to the
supply of workers. They refer to the
equilibrium point where the supply
and demand for labor are equal, that
is, filled jobs. Labor demand and
labor supply each have many possible
employment levels, depending on
the wage level. The wage level adjusts
until the supply and demand for any
given occupation are the same – that
point is the employment estimate or
projection for that occupation. Any
forecast a decade into the future that
predicts shortages or surpluses ignores
this fact and is not well grounded in
economic theory.
Cashiers
Retail Salespersons
Registered Nurses
Waiters and Waitresses
Combined Food Preparation/Serving Workers, Inc Fast Food
Customer Service Representatives
Office Clerks, General
Laborers and Freight, Stock, & Material Movers, Hand
Janitors and Cleaners, Exc Maids & Housekeeping Cleaners
Meat, Poultry, and Fish Cutters and Trimmers
Nursing Aides, Orderlies, and Attendants
Medical Secretaries
First-Line Supers/Mngrs of Office & Admin Support Workers
Receptionists and Information Clerks
First-Line Supervisors/Managers of Retail Sales Workers
Truck Drivers, Heavy & Tractor-Trailer
Accountants and Auditors
Cooks, Restaurant
0 100 200 300 400 500 600 700
Openings due to growth
Openings due to replacements
2 Delaware 2020
Wage Category Abbreviation 2010 Average Annual Wage
Low Low Below $29,300
Below Average -Avg. $29,300 to $38,700
Average Avg. $38,701 to $50,080
Above Average +Avg. $50,081 to $66,000
High High Above $66,000
Wage Categories
Category
Annual Openings
Due to Growth
Number of Occupations
in each Category
Poor 0 137
Fair 1 to 3 143
Good 4 to 14 134
Excellent (Excl) 15 or more 81
Job Availability Categories
For ease of comparison, this first section presents
occupational wages by wage categories. To create the
categories, we divided the 493 occupations for which we
have wage estimates (two agricultural occupations, Animal
Breeders and Farmers, are not covered by our wage surveys)
into quintiles. There are 98 occupations in the Low and
High categories, and 99 occupations in each of the three
middle categories. These categories are based on the 2010
average annual wage for each occupation. Of course, it
should be recognized that some people working in each
occupation were paid less than the average, and some were
paid more than the average, and that those just entering
an occupation should expect to be paid less than this
amount. More detailed wage distributions for each of these
occupations, including estimates for entry- and experienced
level wages, can be obtained by contacting our office.
The lowest-paying 98 occupations (Low) paid below
$29,300 per year. The next lowest-paying 99 occupations,
those in the Below Average category (-Avg.), had average
wages between $29,300 and $38,700 per year. The middle
category, Average (Avg.) paid from $38,700 to $50,080.
The second highest-paying category, Above Average
(+Avg.), had average wages from $50,081 to $66,000, while
the 98 highest-paying occupations (High) had average
annual wages exceeding $66,000.
The placement of occupations into job availability
categories is based on the expected annual openings
solely due to growth. An occupation with no expected
growth would still be expected to generate openings
due to replacement of those who leave employment, but
overall job availability would still be considered poor
compared to occupations with openings due to both
growth and replacement. It is through actual expansion of
employment within an occupation that potential entrants
will find the most opportunity.
New Jobs Created by Level of Education, 2010–2020
Bachelor’s
Degree or
Higher
More than
High School,
Less than
Bachelor’s
On-the-Job
Training
20%
17%
63%
The rest of the data refer to education, experience, and
training requirements. In the past, one variable was used
to describe all three; the current standard is for separate
measures for each. There are eight levels of education,
which are intended to describe the typical education
level of someone entering the occupation. The education
categories range from less than high school (<HS),
high school diploma or equivalent (HS), postsecondary
vocational training (VocEd), associate’s degree (Assoc),
bachelor’s degree (Bach), and master’s degree (Mast)
through doctoral or professional degree (PhD/prof ).
Some occupations typically require experience working in
a related field. The work experience measure captures this
as one of four possible values: none, less than one year (<1),
from one to five years (1-5), and over five years (5+). The
on-the-job training field has six possible measures for the
There are four categories of job availability: Poor, with no
openings due to growth projected; Fair, with from 1 to 3
annual openings due to growth projected; Good, with from
4 to 14 such openings; and Excellent (Excl), with 15 or
more annual openings due to growth projected. There are
81 occupations with Excellent job availability, 134 in the
Good category, 143 with Fair job availability prospects, and
137 in the Poor category.
Occupation & Industry Projections 3
Projected Openings and Growth by Education Level, 2010–2020
Education
Total
Openings
2010–2020
Percent
of Total
Openings New Jobs
Annual
Percent
Growth
2011
Unemployment
Rate
Ph.D./Professional 3,985 2.6% 1,625 1.2% 0.4%
Master’s 2,480 1.6% 959 1.4% 3.0%
Bachelor’s 24,201 15.7% 7,478 0.9% 4.2%
Associate’s 9,515 6.2% 4,741 1.7% 4.6%
Some College 899 0.6% 284 1.2% 7.8%
Vocational Education 7,244 4.7% 3,608 1.7% Not Available
High School Graduate 58,837 38.2% 19,871 1.0% 8.3%
Less than HS 46,998 30.5% 12,000 1.0% 12.0%
typical amount of training required
to be considered competent in the
occupation. These range from none,
short-term on-the-job training of one
month or less (STOJT), moderate-
term on-the-job training of from one
month to one year (MOJT), long-term
on-the-job training of over one year
(LTOJT), and apprenticeship (App)
through internship or residency (Int).
Those interested in further details of
the new education, experience, and
training requirements should go to:
www.bls.gov/emp/ep_education_tech.htm
Do
cto
ra
l o
r p
ro
fes
sio
na
l d
eg
re
e
Ma
ste
r’s
de
gr
ee
Ba
ch
elo
r’s
de
gr
ee
As
so
cia
te
de
gr
ee
Po
sts
ec
on
da
ry
vo
ca
tio
na
l tr
ain
ing
Hi
gh
S
ch
oo
l d
ipl
om
a
Le
ss
th
an
H
igh
S
ch
oo
l
Wages by Level of Education, 2010
$160,000
$140,000
$120,000
$100,000
$80,000
$60,000
$40,000
$20,000
$0
$144,588
$62,118
$75,003
$23,418
$40,188$39,135
$74,317
4 Delaware 2020
SOC
Code Title of Occupation
2010
Est.
Empl
2020
Proj.
Empl.
Wage
Cat.
Job
Avail. Educ.
Work
Exp.
Job
Training
11-0000 Management Occupations
11-2021 Marketing Managers 950 931 High Poor Bach 1-5 None
11-2022 Sales Managers 691 710 High Fair Bach 1-5 None
11-2031 Public Relations Managers 231 233 High Poor Bach 1-
5 None
11-3011 Administrative Services Managers 776 824 High Good
HS 1-5 None
11-3021 Computer and Information Systems Managers 1,598
1,656 High Good Bach 5+ None
11-3031 Financial Managers 2,367 2,382 High Fair Bach 5+
None
11-3051 Industrial Production Managers 379 418 High Good
Bach 1-5 None
11-3061 Purchasing Managers 152 151 High Poor Bach 5+ None
11-3071 Transportation, Storage, and Distribution Managers
363 364 High Poor HS 5+ None
11-3111 Compensation and Benefits Managers 163 150 High
Poor Bach 1-5 None
11-3121 Human Resources Managers 256 267 High Fair Bach 1-
5 None
11-3131 Training and Development Managers 131 128 High
Poor Bach 1-5 None
11-9013 Farmers, Ranchers, and Other Agricultural Managers
2,592 2,425 NA Poor HS 5+ None
11-9021 Construction Managers 1,157 1,469 High Excl Assoc
5+ None
11-9031 Education Administrators, Preschool and Child Care
Center/Program 296 332 +Avg Good Bach 1-5 None
11-9032 Education Administrators, Elementary and
Secondary School 605 638 High Fair Mast 1-5 None
11-9039 Education Administrators, All Other 45 52 +Avg Fair
Bach 1-5 None
11-9041 Engineering Managers 437 454 High Fair Bach 5+
None
11-9051 Food Service Managers 389 463 High Good HS 1-5
None
11-9081 Lodging Managers 135 144 High Fair HS 1-5 None
11-9111 Medical and Health Services Managers 928 1,112 High
Excl Bach 0 None
11-9131 Postmasters and Mail Superintendents 48 42 High Poor
HS 1-5 MOJT
11-9141 Property, Real Estate, and Community
Association Managers 591 642 High Good HS 1-5 None
11-9151 Social and Community Service Managers 718 829
+Avg Good Bach 1-5 None
11-9161 Emergency Management Directors 15 16 +Avg Poor
Bach 1-5 LTOJT
11-9199 Managers, All Other 1,159 1,159 High Poor HS 1-5
None
11-1011 Chief Executives 395 424 High Fair Bach 5+ None
11-1021 General and Operations Managers 4,318 4,793 High
Excl Assoc 1-5 None
13-0000 Business and Financial Operations Occupations
13-1022 Wholesale and Retail Buyers, Except Farm Products
254 291 Avg Fair HS 0 LTOJT
13-1023 Purchasing Agents, Except Wholesale, Retail, and
Farm Products 694 707 High Fair HS 0 LTOJT
13-1031 Claims Adjusters, Examiners, and Investigators 846
906 +Avg Good HS 0 LTOJT
13-1041 Compliance Officers, Except Agriculture,
Construction,
Health and Safety, and Transportation 1,089 1,256 +Avg Excl
Bach 0 MOJT
Table 1: Occupation Projections by Occupational Group
Occupation & Industry Projections 5
Occupation Projections by Occupational Group
SOC
Code Title of Occupation
2010
Est.
Empl
2020
Proj.
Empl.
Wage
Cat.
Job
Avail. Educ.
Work
Exp.
Job
Training
13-1051 Cost Estimators 720 955 +Avg Excl Bach 0 None
13-1078 Human Resources, Labor Relations, and Training
Specialists, All Other 1,564 1,706 +Avg Good Bach 0 None
13-1081 Logisticians 484 585 High Good Bach 1-5 None
13-1111 Management Analysts 2,011 2,177 High Excl Bach 1-5
None
13-1121 Meeting and Convention Planners 258 287 Avg Fair
Bach <1 None
13-1141 Compensation, Benefits, and Job Analysis Specialists
324 319 High Poor Bach 0 None
13-1151 Training and Development Specialists 893 962 +Avg
Good Bach 0 None
13-1161 Market Research Analysts and Marketing Specialists
1,796 1,875 High Good Bach 0 None
13-1199 Business Operations Specialists, All Other 1,890 2,062
+Avg Excl HS <1 LTOJT
13-2011 Accountants and Auditors 4,755 5,156 High Excl Bach
0 None
13-2021 Appraisers and Assessors of Real Estate 157 166 +Avg
Fair HS 0 App
13-2031 Budget Analysts 155 172 +Avg Fair Bach 0 None
13-2041 Credit Analysts 1,182 1,285 +Avg Good Bach 0 None
13-2051 Financial Analysts 1,948 2,120 High Excl Bach 0 None
13-2052 Personal Financial Advisors 930 1,199 High Excl Bach
0 None
13-2053 Insurance Underwriters 369 400 +Avg Fair Bach 0
MOJT
13-2061 Financial Examiners 168 180 High Fair Bach 0 MOJT
13-2071 Loan Counselors 201 210 Avg Fair Bach 0 MOJT
13-2072 Loan Officers 735 783 +Avg Good HS 0 MOJT
13-2081 Tax Examiners, Collectors, and Revenue Agents 225
239 +Avg Fair Bach 0 MOJT
13-2082 Tax Preparers 341 344 Avg Poor HS 0 MOJT
15-0000 Computer and Mathematical Occupations
15-1111 Computer and Information Research Scientists 81 95
High Fair PhD/prof 0 None
15-1121 Computer Systems Analysts 2,976 3,315 High Excl
Bach 0 None
15-1131 Computer Programmers 1,232 1,263 High Fair Bach 0
None
15-1132 Software Developers, Applications 1,867 2,148 High
Excl Bach 0 None
15-1133 Software Developers, Systems Software 1,260 1,394
High Good Bach 0 None
15-1141 Database Administrators 575 673 High Good Bach 1-5
None
15-1142 Network and Computer Systems Architects
and Administrators 854 1,069 High Excl Bach 0 None
15-1150 Computer Support Specialists 2,084 2,329 +Avg Excl
HS 0 MOJT
15-1179 Information Security Analysts, Web Developers, and
Computer Network Architects 1,033 1,111 High Good Bach 1-5
None
15-1799 Computer Occupations, All Other 186 194 High Fair
Bach 0 None
15-2011 Actuaries 122 158 High Good Bach 0 LTOJT
15-2031 Operations Research Analysts 208 225 High Fair Bach
0 None
15-2041 Statisticians 85 86 High Poor Mast 0 None
17-0000 Architecture and Engineering Occupations
17-1011 Architects, Except Landscape and Naval 115 138 High
Fair Bach 0 Int/res
17-1012 Landscape Architects 106 118 +Avg Fair Bach 0 Int/res
6 Delaware 2020
Occupation Projections by Occupational Group
SOC
Code Title of Occupation
2010
Est.
Empl
2020
Proj.
Empl.
Wage
Cat.
Job
Avail. Educ.
Work
Exp.
Job
Training
17-1022 Surveyors 124 145 High Fair Bach 0 None
17-2051 Civil Engineers 1,019 1,148 High Good Bach 0 None
17-2071 Electrical Engineers 880 935 High Good Bach 0 None
17-2081 Environmental Engineers 143 153 High Fair Bach 0
None
17-2111 Health and Safety Engineers, Except Mining Safety
Engineers and Inspectors 64 79 High Fair Bach 0 None
17-2112 Industrial Engineers 620 655 High Fair Bach 0 None
17-2141 Mechanical Engineers 569 652 High Good Bach 0 None
17-3011 Architectural and Civil Drafters 317 308 +Avg Poor
Assoc 0 None
17-3012 Electrical and Electronics Drafters 154 171 +Avg Fair
Assoc 0 None
17-3013 Mechanical Drafters 226 273 +Avg Good Assoc 0 None
17-3019 Drafters, All Other 16 16 +Avg Poor Assoc 0 None
17-3022 Civil Engineering Technicians 411 423 Avg Fair Assoc
0 None
17-3023 Electrical and Electronic Engineering Technicians 317
349 Avg Fair Assoc 0 None
17-3025 Environmental Engineering Technicians 31 36 +Avg
Fair Assoc 0 None
17-3026 Industrial Engineering Technicians 120 129 Avg Fair
Assoc 0 None
17-3027 Mechanical Engineering Technicians 156 164 +Avg
Fair Assoc 0 None
17-3031 Surveying and Mapping Technicians 127 137 Avg Fair
HS 0 MOJT
19-0000 Life, Physical, and Social Science Occupations
19-1013 Soil and Plant Scientists 74 85 +Avg Fair Bach 0 None
19-1021 Biochemists and Biophysicists 115 141 High Fair
PhD/prof 0 None
19-1022 Microbiologists 107 116 +Avg Fair Bach 0 None
19-1023 Zoologists and Wildlife Biologists 13 12 High Poor
Bach 0 None
19-1029 Biological Scientists, All Other 25 26 High Poor
PhD/prof 0 None
19-1031 Conservation Scientists 29 30 +Avg Poor Bach 0 None
19-1032 Foresters 15 15 +Avg Poor Bach 0 None
19-2012 Physicists 21 25 High Poor PhD/prof 0 None
19-2031 Chemists 1,905 1,904 High Poor Bach 0 None
19-2032 Materials Scientists 87 94 High Fair Bach 0 None
19-2041 Environmental Scientists and Specialists,
Including Health 401 460 +Avg Good Bach 0 None
19-2042 Geoscientists, Except Hydrologists and Geographers 40
49 High Fair Bach 0 None
19-2043 Hydrologists 29 35 +Avg Poor Mast 0 None
19-3011 Economists 44 44 High Poor Bach 0 None
19-3031 Clinical, Counseling, and School Psychologists 450
547 High Good PhD/prof 0 Int/res
19-3051 Urban and Regional Planners 196 211 +Avg Fair Mast
0 None
19-4021 Biological Technicians 225 230 Avg Poor Bach 0 None
19-4031 Chemical Technicians 617 655 +Avg Good Assoc 0
MOJT
19-4061 Social Science Research Assistants 100 112 -Avg Fair
Assoc 0 None
19-4091 Environmental Science and Protection Technicians,
Including Health 124 144 -Avg Fair Assoc 0 MOJT
Occupation & Industry Projections 7
Occupation Projections by Occupational Group
SOC
Code Title of Occupation
2010
Est.
Empl
2020
Proj.
Empl.
Wage
Cat.
Job
Avail. Educ.
Work
Exp.
Job
Training
21-0000 Community and Social Service Occupations
21-1011 Substance Abuse and Behavioral Disorder Counselors
185 214 -Avg Fair HS 0 MOJT
21-1012 Educational, Vocational, and School Counselors 919
1,048 +Avg Good Mast 0 None
21-1013 Marriage and Family Therapists 223 238 +Avg Fair
Mast 0 Int/res
21-1014 Mental Health Counselors 191 247 -Avg Good Mast 0
Int/res
21-1015 Rehabilitation Counselors 501 571 -Avg Good Mast 0
None
21-1021 Child, Family, and School Social Workers 970 1,113
Avg Good Bach 0 None
21-1022 Medical and Public Health Social Workers 892 1,040
Avg Excl Mast 0 None
21-1023 Mental Health and Substance Abuse Social Workers
499 606 Avg Good Bach 0 None
21-1029 Social Workers, All Other 115 121 +Avg Fair Bach 0
None
21-1091 Health Educators 187 256 +Avg Good Bach 0 None
21-1092 Probation Officers and Correctional
Treatment Specialists 656 805 Avg Excl Bach 0 STOJT
21-1093 Social and Human Service Assistants 731 842 Low
Good HS 0 STOJT
21-1798 Community and Social Service Specialists, All Other
410 485 -Avg Good Bach 0 None
23-0000 Legal Occupations
23-1011 Lawyers 3,037 3,058 High Fair PhD/prof 0 None
23-1012 Judicial Law Clerks 201 209 Avg Fair PhD/prof 0 None
23-1021 Administrative Law Judges, Adjudicators, and
Hearing Officers 89 87 +Avg Poor Bach 1-5 MOJT
23-1022 Arbitrators, Mediators, and Conciliators 47 51 Avg
Poor Bach 1-5 MOJT
23-1023 Judges, Magistrate Judges, and Magistrates 161 176
High Fair PhD/prof 5+ STOJT
23-2011 Paralegals and Legal Assistants 1,215 1,313 +Avg
Good Assoc 0 None
23-2091 Court Reporters 76 89 +Avg Fair VocEd 0 STOJT
23-2093 Title Examiners, Abstractors, and Searchers 41 38 Avg
Poor HS 0 STOJT
23-2099 Legal Support Workers, All Other 179 183 Avg Poor
HS 0 STOJT
25-0000 Education, Training, and Library Occupations
25-1194 Vocational Education Teachers, Postsecondary 332 363
Avg Fair Bach 1-5 None
25-2011 Preschool Teachers, Except Special Education 1,890
2,117 Low Excl Assoc 0 None
25-2012 Kindergarten Teachers, Except Special Education 374
422 +Avg Good Bach 0 Int/res
25-2021 Elementary School Teachers, Except
Special Education 3,604 4,032 +Avg Excl Bach 0 Int/res
25-2022 Middle School Teachers, Except Special and
Vocational Education 2,499 2,797 +Avg Excl Bach 0 Int/res
25-2031 Secondary School Teachers, Except Special and
Vocational Education 3,025 3,101 +Avg Good Bach 0 Int/res
25-2041 Special Education Teachers, Preschool, Kindergarten,
and Elementary School 1,718 1,981 Avg Excl Bach 0 Int/res
25-2053 Special Education Teachers, Middle School 298 344
+Avg Good Bach 0 Int/res
25-2054 Special Education Teachers, Secondary School 220 227
+Avg Fair Bach 0 Int/res
Occupation Projections by Occupational Group
SOC
Code Title of Occupation
2010
Est.
Empl
2020
Proj.
Empl.
Wage
Cat.
Job
Avail. Educ.
Work
Exp.
Job
Training
8 Delaware 2020
25-3011 Adult Literacy, Remedial Education, and GED
Teachers
and Instructors 307 338 +Avg Fair Bach 0 Int/res
25-3021 Self-Enrichment Education Teachers 456 534 Avg
Good HS 1-5 None
25-3999 Teachers and Instructors, All Other 1,046 1,149 Avg
Good Bach 0 None
25-4011 Archivists 44 45 Avg Poor Bach 0 None
25-4012 Curators 51 59 +Avg Fair Mast 0 None
25-4013 Museum Technicians and Conservators 46 47 Avg Poor
Bach 0 None
25-4021 Librarians 482 509 +Avg Fair Mast 0 None
25-4031 Library Technicians 265 288 -Avg Fair VocEd 0 None
25-9011 Audio-Visual Collections Specialists 34 36 -Avg Poor
Bach 1-5 None
25-9031 Instructional Coordinators 421 485 +Avg Good Mast
5+ None
25-9041 Teacher Assistants 2,148 2,370 Low Excl HS 0 STOJT
25-9099 Education, Training, and Library Workers, All Other
149 154 Avg Poor Bach 0 None
27-0000 Arts, Design, Entertainment, Sports, and Media
Occupations
27-1011 Art Directors 60 65 High Fair Bach 1-5 None
27-1021 Commercial and Industrial Designers 24 22 +Avg Poor
Bach 0 None
27-1023 Floral Designers 134 121 Low Poor HS 0 STOJT
27-1024 Graphic Designers 506 572 Avg Good Bach 0 None
27-1025 Interior Designers 119 139 Avg Fair Bach 0 None
27-1026 Merchandise Displayers and Window Trimmers 328
360 Low Fair HS 0 MOJT
27-1027 Set and Exhibit Designers 13 15 Avg Poor Bach 0 None
27-2023 Umpires, Referees, and Other Sports Officials 263 280
Low Fair HS 0 LTOJT
27-2041 Music Directors and Composers 27 27 High Poor Bach
1-5 None
27-3011 Radio and Television Announcers 43 54 Avg Fair Bach
0 None
27-3022 Reporters and Correspondents 77 72 -Avg Poor Bach 0
None
27-3031 Public Relations Specialists 946 1,092 +Avg Excl Bach
0 MOJT
27-3041 Editors 232 250 +Avg Fair Bach 1-5 None
27-3042 Technical Writers 114 135 +Avg Fair Bach 1-5 STOJT
27-3043 Writers and Authors 234 271 +Avg Good Bach 0
LTOJT
27-4011 Audio and Video Equipment Technicians 97 113 Avg
Fair VocEd 0 MOJT
27-4012 Broadcast Technicians 35 44 Avg Fair Assoc 0 STOJT
27-4021 Photographers 220 237 -Avg Fair HS 0 LTOJT
29-0000 Healthcare Practitioners and Technical Occupations
29-1011 Chiropractors 161 199 High Good PhD/prof 0 None
29-1021 Dentists, General 433 496 High Good PhD/prof 0
Int/res
29-1031 Dietitians and Nutritionists 156 187 +Avg Fair Bach 0
Int/res
29-1041 Optometrists 112 139 High Fair PhD/prof 0 None
29-1051 Pharmacists 645 773 High Good PhD/prof 0 None
29-1061 Anesthesiologists 125 148 High Fair PhD/prof 0 Int/res
29-1062 Family and General Practitioners 533 639 High Good
PhD/prof 0 Int/res
Occupation Projections by Occupational Group
SOC
Code Title of Occupation
2010
Est.
Empl
2020
Proj.
Empl.
Wage
Cat.
Job
Avail. Educ.
Work
Exp.
Job
Training
Occupation & Industry Projections 9
29-1063 Internists, General 249 297 High Good PhD/prof 0
Int/res
29-1064 Obstetricians and Gynecologists 85 101 High Fair
PhD/prof 0 Int/res
29-1065 Pediatricians, General 124 148 High Fair PhD/prof 0
Int/res
29-1066 Psychiatrists 100 116 High Fair PhD/prof 0 Int/res
29-1067 Surgeons 278 332 High Good PhD/prof 0 Int/res
29-1069 Physicians and Surgeons, All Other 1,199 1,406 High
Excl PhD/prof 0 Int/res
29-1071 Physician Assistants 321 391 High Good Mast 0 None
29-1081 Podiatrists 97 114 High Fair PhD/prof 0 Int/res
29-1111 Registered Nurses 10,426 12,928 High Excl Assoc 0
None
29-1122 Occupational Therapists 356 441 High Good Mast 0
None
29-1123 Physical Therapists 631 841 High Excl PhD/prof 0
None
29-1124 Radiation Therapists 49 55 High Fair Assoc 0 None
29-1125 Recreational Therapists 65 74 -Avg Fair Bach 0 None
29-1126 Respiratory Therapists 399 514 +Avg Good Assoc 0
None
29-1127 Speech-Language Pathologists 380 465 High Good
Mast 0 None
29-1128 Therapists, all other 102 147 Avg Good Mast 0 None
29-1131 Veterinarians 196 246 High Good PhD/prof 0 None
29-1181 Audiologists 28 34 +Avg Fair PhD/prof 0 None
29-1199 Health Diagnosing & Treating Practitioners, All Other
26 31 High Poor Mast 0 None
29-2011 Medical and Clinical Laboratory Technologists 403
421 +Avg Fair Bach 0 None
29-2012 Medical and Clinical Laboratory Technicians 308 347
Avg Good Assoc 0 None
29-2021 Dental Hygienists 572 720 High Excl Assoc 0 None
29-2031 Cardiovascular Technologists and Technicians 245 310
+Avg Good Assoc 0 None
29-2032 Diagnostic Medical Sonographers 207 287 +Avg Good
Assoc 0 None
29-2033 Nuclear Medicine Technologists 97 112 High Fair
Assoc 0 None
29-2037 Radiologic Technologists and Technicians 1,061 1,318
+Avg Excl Assoc 0 None
29-2041 Emergency Medical Technicians and Paramedics 947
1,168 -Avg Excl VocEd 0 None
29-2051 Dietetic Technicians 121 138 Low Fair HS 0 MOJT
29-2052 Pharmacy Technicians 1,160 1,483 Low Excl HS 0
MOJT
29-2055 Surgical Technologists 324 376 Avg Good VocEd 0
None
29-2056 Veterinary Technologists and Technicians 257 297 -
Avg Good Assoc 0 None
29-2061 Licensed Practical and Licensed Vocational Nurses
2,341 2,818 Avg Excl VocEd 0 None
29-2071 Medical Records and Health Information Technicians
448 523 -Avg Good VocEd 0 None
29-2081 Opticians, Dispensing 267 303 -Avg Good HS 0 LTOJT
29-2799 Health Technologists and Technicians, All Other 241
294 Avg Good VocEd 0 STOJT
29-9011 Occupational Health and Safety Specialists 459 512
+Avg Good Bach 0 MOJT
29-9012 Occupational Health and Safety Technicians 14 17 Avg
Poor HS 0 MOJT
29-9799 Healthcare Practitioners and Technical Workers, All
Other, including genetic counselors 57 60 +Avg Poor Bach 0
None
Occupation Projections by Occupational Group
SOC
Code Title of Occupation
2010
Est.
Empl
2020
Proj.
Empl.
Wage
Cat.
Job
Avail. Educ.
Work
Exp.
Job
Training
10 Delaware 2020
31-0000 Healthcare Support Occupations
31-1011 Home Health Aides 2,108 2,722 Low Excl <HS 0
STOJT
31-1012 Nursing Aides, Orderlies, and Attendants 5,533 6,609
Low Excl VocEd 0 None
31-1013 Psychiatric Aides 104 122 -Avg Fair HS 0 STOJT
31-2011 Occupational Therapist Assistants 78 96 +Avg Fair
Assoc 0 None
31-2021 Physical Therapist Assistants 161 210 +Avg Good
Assoc 0 None
31-2022 Physical Therapist Aides 164 222 Low Good HS 0
MOJT
31-9011 Massage Therapists 185 248 +Avg Good VocEd 0 None
31-9091 Dental Assistants 765 914 -Avg Excl VocEd 0 None
31-9092 Medical Assistants 1,380 1,680 -Avg Excl HS 0 MOJT
31-9093 Medical Equipment Preparers 200 229 -Avg Fair HS 0
MOJT
31-9094 Medical Transcriptionists 181 173 -Avg Poor VocEd 0
None
31-9095 Pharmacy Aides 34 37 Low Poor HS 0 STOJT
31-9096 Veterinary Assistants & Laboratory Animal Caretakers
242 246 Low Poor HS 0 STOJT
31-9799 Healthcare Support Workers, All Other 287 314 -Avg
Fair HS 0 STOJT
33-0000 Protective Service Occupations
33-1012 First-Line Supervisors/Managers of Police
and Detectives 276 286 High Fair HS 1-5 MOJT
33-1099 First-Line Supervisors/Managers, Protective Service
Workers, All Other 325 356 Avg Fair HS 1-5 None
33-2011 Fire Fighters 379 411 Avg Fair VocEd 0 LTOJT
33-2021 Fire Inspectors and Investigators 88 96 Avg Fair HS 5+
MOJT
33-3041 Parking Enforcement Workers 33 35 -Avg Poor HS 0
STOJT
33-3051 Police and Sheriff's Patrol Officers 1,628 1,749 +Avg
Good HS 0 MOJT
33-9011 Animal Control Workers 242 317 -Avg Good HS 0
MOJT
33-9021 Private Detectives and Investigators 39 45 +Avg Fair
HS 1-5 MOJT
33-9031 Gaming Surveillance Officers and
Gaming Investigators 57 64 Low Fair HS 0 STOJT
33-9032 Security Guards 3,288 3,800 Low Excl HS 0 STOJT
33-9091 Crossing Guards 309 318 Low Fair HS 0 STOJT
33-9092 Lifeguards, Ski Patrol, and Other Recreational
Protective Service Workers 782 883 Low Good HS 0 STOJT
33-9099 Protective Service Workers, All Other 200 225 Low
Fair HS 0 STOJT
35-0000 Food Preparation and Serving-Related Occupations
35-1011 Chefs and Head Cooks 165 169 Avg Poor HS 1-5 None
35-1012 First-Line Supervisors/Managers of Food Preparation
and Serving Workers 2,821 3,108 -Avg Excl HS 1-5 None
35-2011 Cooks, Fast Food 836 809 Low Poor <HS 0 STOJT
35-2012 Cooks, Institution and Cafeteria 2,228 2,188 Low Poor
<HS 0 STOJT
35-2014 Cooks, Restaurant 3,975 4,503 Low Excl <HS <1
MOJT
35-2015 Cooks, Short Order 132 138 Low Poor <HS 0 STOJT
Occupation Projections by Occupational Group
SOC
Code Title of Occupation
2010
Est.
Empl
2020
Proj.
Empl.
Wage
Cat.
Job
Avail. Educ.
Work
Exp.
Job
Training
Occupation & Industry Projections 11
35-2021 Food Preparation Workers 1,662 1,866 Low Excl <HS
0 STOJT
35-3011 Bartenders 1,770 1,925 Low Excl <HS 0 STOJT
35-3021 Combined Food Preparation and Serving Workers,
Including Fast Food 9,574 11,022 Low Excl <HS 0 STOJT
35-3022 Counter Attendants, Cafeteria, Food Concession, and
Coffee Shop 1,530 1,654 Low Good <HS 0 STOJT
35-3031 Waiters and Waitresses 7,285 7,959 Low Excl <HS 0
STOJT
35-3041 Food Servers, Nonrestaurant 451 504 Low Good <HS 0
STOJT
35-9011 Dining Room and Cafeteria Attendants and
Bartender Helpers 1,005 1,120 Low Good <HS 0 STOJT
35-9021 Dishwashers 1,670 1,783 Low Good <HS 0 STOJT
35-9031 Hosts and Hostesses, Restaurant, Lounge, and
Coffee Shop 1,331 1,392 Low Good <HS 0 None
35-9099 Food Preparation / Serving Related Workers, All Other
104 93 Low Poor <HS 0 STOJT
37-0000 Building and Grounds Cleaning and Maintenance
Occupations
37-1011 First-Line Supervisors/Managers of Housekeeping
and Janitorial Workers 503 500 -Avg Poor HS 1-5 None
37-1012 First-Line Supervisors/Managers of Landscaping,
Lawn Service, and Groundskeeping Workers 440 538 +Avg
Good HS 1-5 None
37-2011 Janitors and Cleaners, Except Maids and
Housekeeping Cleaners 7,912 8,604 Low Excl <HS 0 STOJT
37-2012 Maids and Housekeeping Cleaners 2,708 2,962 Low
Excl <HS 0 STOJT
37-2021 Pest Control Workers 180 221 -Avg Good HS 0 MOJT
37-3011 Landscaping and Groundskeeping Workers 3,212 3,956
Low Excl <HS 0 STOJT
37-3012 Pesticide Handlers, Sprayers, and
Applicators, Vegetation 161 173 -Avg Fair HS 0 MOJT
37-3019 Grounds Maintenance Workers, All Other 22 23 +Avg
Poor <HS 0 STOJT
39-0000 Personal Care and Service Occupations
39-1011 Gaming Supervisors 17 20 +Avg Poor HS 1-5 None
39-1012 Slot Key Persons 27 24 -Avg Poor HS 1-5 None
39-1021 First-Line Supervisors/Managers of Personal
Service Workers 1,052 1,171 -Avg Good HS 1-5 None
39-2011 Animal Trainers 155 168 Avg Fair HS 0 MOJT
39-2021 Nonfarm Animal Caretakers 871 965 Low Good <HS 0
STOJT
39-3012 Gaming and Sports Book Writers and Runners 123 138
-Avg Fair HS 0 STOJT
39-3031 Ushers, Lobby Attendants, and Ticket Takers 274 275
Low Poor <HS 0 STOJT
39-3091 Amusement and Recreation Attendants 721 815 Low
Good <HS 0 STOJT
39-3092 Costume Attendants 12 12 Low Poor HS 0 STOJT
39-3093 Locker Room, Coatroom, and Dressing
Room Attendants 15 16 Low Poor HS 0 STOJT
39-3099 Entertainment Attendants and Related Workers,
All Other 58 63 Low Fair HS 0 STOJT
39-4021 Funeral Attendants 149 166 -Avg Fair HS 0 STOJT
Occupation Projections by Occupational Group
SOC
Code Title of Occupation
2010
Est.
Empl
2020
Proj.
Empl.
Wage
Cat.
Job
Avail. Educ.
Work
Exp.
Job
Training
12 Delaware 2020
39-4831 Funeral Service Managers, Directors, Morticians,
and Undertakers 111 136 High Fair Assoc 0 App
39-5012 Hairdressers, Hairstylists, and Cosmetologists 2,012
2,527 -Avg Excl VocEd 0 None
39-5092 Manicurists and Pedicurists 271 353 Low Good VocEd
0 None
39-5093 Shampooers 416 403 Low Poor <HS 0 STOJT
39-9011 Child Care Workers 2,418 2,806 Low Excl HS 0 STOJT
39-9021 Personal and Home Care Aides 583 713 Low Good <HS
0 STOJT
39-9031 Fitness Trainers and Aerobics Instructors 2,238 2,542 -
Avg Excl HS 0 STOJT
39-9032 Recreation Workers 936 1,093 Low Excl Bach 0 None
39-9041 Residential Advisors 65 80 Low Fair HS <1 STOJT
41-0000 Sales and Related Occupations
41-1011 First-Line Supervisors/Managers of Retail
Sales Workers 5,036 5,362 Avg Excl HS 1-5 None
41-1012 First-Line Supervisors/Managers of Non-Retail
Sales Workers 863 889 High Fair HS 5+ None
41-2011 Cashiers 12,168 13,068 Low Excl <HS 0 STOJT
41-2021 Counter and Rental Clerks 1,393 1,537 Low Good <HS
0 STOJT
41-2022 Parts Salespersons 724 808 Low Good <HS 0 MOJT
41-2031 Retail Salespersons 15,169 16,909 Low Excl <HS 0
STOJT
41-3011 Advertising Sales Agents 235 264 +Avg Fair HS 0
MOJT
41-3021 Insurance Sales Agents 1,231 1,596 +Avg Excl HS 0
MOJT
41-3041 Travel Agents 159 171 -Avg Fair HS 0 MOJT
41-3099 Sales Representatives, Services, All Other 2,404 2,878
+Avg Excl HS 0 STOJT
41-4011 Sales Representatives, Wholesale and Manufacturing,
Technical and Scientific Products 1,674 1,972 High Excl Bach 0
MOJT
41-4012 Sales Representatives, Wholesale and Manufacturing,
Except Technical and Scientific Products 2,608 2,954 +Avg
Excl HS 0 MOJT
41-9011 Demonstrators and Product Promoters 289 330 Low
Good HS 0 STOJT
41-9021 Real Estate Brokers 102 114 High Fair HS 1-5 None
41-9022 Real Estate Sales Agents 1,380 1,756 +Avg Excl HS 0
LTOJT
41-9031 Sales Engineers 76 84 High Fair Bach 0 MOJT
41-9041 Telemarketers 410 416 Low Fair <HS 0 STOJT
41-9799 Sales and Related Workers, All Other 480 565 Avg
Good HS 0 MOJT
43-0000 Office and Administrative Support Occupations
43-1011 First-Line Supervisors/Managers of Office and
Administrative Support Workers 4,797 5,213 +Avg Excl HS 1-5
None
43-2011 Switchboard Operators, Including Answering Service
319 245 Low Poor HS 0 STOJT
43-2021 Telephone Operators 68 60 Low Poor HS 0 STOJT
43-3011 Bill and Account Collectors 1,904 2,003 -Avg Good HS
0 MOJT
43-3021 Billing and Posting Clerks and Machine Operators
2,129 2,410 -Avg Excl HS 0 STOJT
43-3031 Bookkeeping, Accounting, and Auditing Clerks 6,105
6,675 -Avg Excl HS 0 MOJT
Occupation Projections by Occupational Group
SOC
Code Title of Occupation
2010
Est.
Empl
2020
Proj.
Empl.
Wage
Cat.
Job
Avail. Educ.
Work
Exp.
Job
Training
Occupation & Industry Projections 13
43-3051 Payroll and Timekeeping Clerks 386 440 -Avg Good
HS 0 MOJT
43-3061 Procurement Clerks 247 252 -Avg Poor HS 0 MOJT
43-3071 Tellers 1,858 1,750 Low Poor HS 0 STOJT
43-4011 Brokerage Clerks 152 147 Avg Poor HS 0 MOJT
43-4031 Court, Municipal, and License Clerks 705 745 -Avg
Good HS 0 MOJT
43-4041 Credit Authorizers, Checkers, and Clerks 870 843 Avg
Poor HS 0 STOJT
43-4051 Customer Service Representatives 7,623 8,447 Avg
Excl HS 0 STOJT
43-4071 File Clerks 726 642 Low Poor HS 0 STOJT
43-4081 Hotel, Motel, and Resort Desk Clerks 727 782 Low
Good HS 0 STOJT
43-4111 Interviewers, Except Eligibility and Loan 587 668 -
Avg Good HS 0 STOJT
43-4121 Library Assistants, Clerical 294 324 Low Fair HS 0
STOJT
43-4131 Loan Interviewers and Clerks 1,060 932 -Avg Poor HS
0 STOJT
43-4141 New Accounts Clerks 333 319 -Avg Poor HS 0 STOJT
43-4151 Order Clerks 509 551 -Avg Good HS 0 STOJT
43-4161 Human Resources Assistants, Except Payroll
and Timekeeping 401 419 -Avg Fair HS 0 STOJT
43-4171 Receptionists and Information Clerks 3,265 3,840 Low
Excl HS 0 STOJT
43-4199 Information and Record Clerks, All Other 315 317 Avg
Poor HS 0 STOJT
43-5011 Cargo and Freight Agents 32 37 Avg Poor HS 0 STOJT
43-5021 Couriers and Messengers 199 192 Low Poor HS 0
STOJT
43-5031 Police, Fire, and Ambulance Dispatchers 200 219 Avg
Fair HS 0 MOJT
43-5032 Dispatchers, Except Police, Fire, and Ambulance 842
1,110 Avg Excl HS 0 MOJT
43-5041 Meter Readers, Utilities 136 129 Avg Poor HS 0
STOJT
43-5051 Postal Service Clerks 222 137 +Avg Poor HS 0 STOJT
43-5052 Postal Service Mail Carriers 992 1,047 Avg Good HS 0
STOJT
43-5053 Postal Service Mail Sorters, Processors, and
Processing Machine Operators 444 274 Avg Poor HS 0 STOJT
43-5061 Production, Planning, and Expediting Clerks 740 788
Avg Good HS 0 MOJT
43-5071 Shipping, Receiving, and Traffic Clerks 1,639 1,612 -
Avg Poor HS 0 STOJT
43-5081 Stock Clerks and Order Fillers 4,573 4,413 Low Poor
<HS 0 STOJT
43-5111 Weighers, Measurers, Checkers, and
Samplers, Recordkeeping 182 207 Low Fair HS 0 STOJT
43-6011 Executive Secretaries and Administrative Assistants
2,614 2,682 Avg Good HS 1-5 None
43-6012 Legal Secretaries 1,132 1,078 +Avg Poor HS 0 MOJT
43-6013 Medical Secretaries 4,267 5,453 -Avg Excl HS 0 MOJT
43-6014 Secretaries, Except Legal, Medical, and Executive
5,793 5,729 -Avg Poor HS 0 STOJT
43-9011 Computer Operators 552 517 Avg Poor HS 0 MOJT
43-9021 Data Entry Keyers 1,071 930 Low Poor HS 0 MOJT
43-9022 Word Processors and Typists 253 218 -Avg Poor HS 0
STOJT
43-9031 Desktop Publishers 58 52 -Avg Poor Assoc 0 STOJT
43-9041 Insurance Claims and Policy Processing Clerks 827 922
-Avg Good HS 0 MOJT
Occupation Projections by Occupational Group
SOC
Code Title of Occupation
2010
Est.
Empl
2020
Proj.
Empl.
Wage
Cat.
Job
Avail. Educ.
Work
Exp.
Job
Training
14 Delaware 2020
43-9051 Mail Clerks and Mail Machine Operators, Except
Postal Service 417 467 Low Good HS 0 STOJT
43-9061 Office Clerks, General 9,558 10,618 Low Excl HS 0
STOJT
43-9071 Office Machine Operators, Except Computer 310 266
Low Poor HS 0 STOJT
43-9081 Proofreaders and Copy Markers 19 20 -Avg Poor Bach
0 MOJT
43-9111 Statistical Assistants 22 24 Avg Poor Bach 0 None
43-9799 Office and Administrative Support Workers, All Other
510 585 -Avg Good HS 0 STOJT
45-0000 Farming, Fishing, and Forestry Occupations
45-1011 First-Line Supervisors/Managers of Farming, Fishing,
and Forestry Workers 172 172 Avg Poor HS 1-5 None
45-2021 Animal Breeders 14 13 NA Poor HS 1-5 STOJT
45-2091 Agricultural Equipment Operators 210 211 -Avg Poor
<HS <1 STOJT
45-2092 Farmworkers and Laborers, Crop, Nursery,
and Greenhouse 1,878 1,871 Low Poor <HS 0 STOJT
45-2093 Farmworkers, Farm and Ranch Animals 462 483 Low
Fair <HS 0 STOJT
47-0000 Construction and Extraction Occupations
47-1011 First-Line Supervisors/Managers of Construction
Trades and Extraction Workers 1,984 2,537 +Avg Excl HS 5+
None
47-2011 Boilermakers 34 36 +Avg Poor HS 0 App
47-2021 Brickmasons and Blockmasons 310 364 Avg Good HS
0 App
47-2022 Stonemasons 27 39 Avg Fair HS 0 App
47-2031 Carpenters 2,414 3,106 Avg Excl HS 0 App
47-2051 Cement Masons and Concrete Finishers 327 422 Avg
Good <HS 0 MOJT
47-2061 Construction Laborers 2,599 3,119 -Avg Excl <HS 0
STOJT
47-2071 Paving, Surfacing, and Tamping Equipment Operators
213 260 Avg Good HS 0 MOJT
47-2072 Pile-Driver Operators 12 16 -Avg Poor HS 0 MOJT
47-2073 Operating Engineers and Other Construction
Equipment Operators 1,222 1,407 Avg Excl HS 0 MOJT
47-2081 Drywall and Ceiling Tile Installers 272 337 Avg Good
<HS 0 MOJT
47-2111 Electricians 1,700 1,990 Avg Excl HS 0 App
47-2132 Insulation Workers, Mechanical 334 417 Avg Good HS
0 App
47-2141 Painters, Construction and Maintenance 953 1,137 -
Avg Excl <HS 0 MOJT
47-2151 Pipelayers 148 182 -Avg Fair HS 0 STOJT
47-2152 Plumbers, Pipefitters, and Steamfitters 1,615 2,007
Avg Excl HS 0 App
47-2181 Roofers 232 261 Avg Fair <HS 0 MOJT
47-2211 Sheet Metal Workers 563 641 Avg Good HS 0 App
47-2221 Structural Iron and Steel Workers 230 269 Avg Good
HS 0 App
47-3011 Helpers--Brickmasons, Blockmasons, Stonemasons,
and Tile and Marble Setters 60 76 -Avg Fair <HS 0 STOJT
47-3012 Helpers--Carpenters 164 224 Low Good <HS 0 STOJT
47-3013 Helpers--Electricians 135 163 -Avg Fair HS 0 STOJT
Occupation Projections by Occupational Group
SOC
Code Title of Occupation
2010
Est.
Empl
2020
Proj.
Empl.
Wage
Cat.
Job
Avail. Educ.
Work
Exp.
Job
Training
Occupation & Industry Projections 15
47-3015 Helpers--Pipelayers, Plumbers, Pipefitters,
and Steamfitters 134 190 Low Good HS 0 STOJT
47-3019 Helpers, Construction Trades, All Other 102 124 Low
Fair <HS 0 STOJT
47-4011 Construction and Building Inspectors 426 498 Avg
Good HS 5+ MOJT
47-4041 Hazardous Materials Removal Workers 133 153 -Avg
Fair HS 0 MOJT
47-4051 Highway Maintenance Workers 28 32 -Avg Poor HS 0
MOJT
47-4061 Rail-Track Laying and Maintenance
Equipment Operators 77 78 Avg Poor HS 0 MOJT
47-4071 Septic Tank Servicers and Sewer Pipe Cleaners 64 78 -
Avg Fair <HS 0 MOJT
47-4799 Construction and Related Workers, All Other 48 54 -
Avg Poor HS 0 MOJT
47-5021 Earth Drillers, Except Oil and Gas 42 48 Avg Fair HS
0 MOJT
49-0000 Installation, Maintenance, and Repair Occupations
49-1011 First-Line Supervisors/Managers of Mechanics,
Installers, and Repairers 1,239 1,338 +Avg Good HS 1-5 None
49-2011 Computer, Automated Teller, and Office
Machine Repairers 264 262 -Avg Poor VocEd 0 None
49-2022 Telecommunications Equipment Installers and
Repairers, Except Line Installers 451 542 +Avg Good VocEd 0
MOJT
49-2092 Electric Motor, Power Tool, and Related Repairers 11
12 Avg Poor VocEd 0 LTOJT
49-2094 Electrical and Electronics Repairers, Commercial and
Industrial Equipment 324 355 +Avg Fair VocEd 0 LTOJT
49-2095 Electrical and Electronics Repairers, Powerhouse,
Substation, and Relay 270 284 High Fair VocEd 0 LTOJT
49-2096 Electronic Equipment Installers and Repairers,
Motor Vehicles 33 32 -Avg Poor VocEd 0 STOJT
49-2097 Electronic Home Entertainment Equipment Installers
and Repairers 155 162 -Avg Poor VocEd 0 None
49-2098 Security and Fire Alarm Systems Installers 224 286
+Avg Good HS 0 MOJT
49-3011 Aircraft Mechanics and Service Technicians 301 308
+Avg Fair VocEd 0 None
49-3021 Automotive Body and Related Repairers 331 354 Avg
Fair HS 0 MOJT
49-3023 Automotive Service Technicians and Mechanics 2,262
2,462 Avg Excl HS 0 LTOJT
49-3031 Bus and Truck Mechanics and Diesel
Engine Specialists 454 507 Avg Good HS 0 LTOJT
49-3041 Farm Equipment Mechanics 76 92 -Avg Fair HS 0
LTOJT
49-3042 Mobile Heavy Equipment Mechanics, Except Engines
502 584 Avg Good HS 0 LTOJT
49-3051 Motorboat Mechanics 88 102 -Avg Fair HS 0 LTOJT
49-3053 Outdoor Power Equipment and Other Small
Engine Mechanics 92 107 -Avg Fair HS 0 MOJT
49-3093 Tire Repairers and Changers 247 273 Low Fair HS 0
MOJT
49-9011 Mechanical Door Repairers 33 39 -Avg Fair HS 0
MOJT
49-9012 Control and Valve Installers and Repairers, Except
Mechanical Door 127 120 +Avg Poor HS 0 MOJT
Occupation Projections by Occupational Group
SOC
Code Title of Occupation
2010
Est.
Empl
2020
Proj.
Empl.
Wage
Cat.
Job
Avail. Educ.
Work
Exp.
Job
Training
16 Delaware 2020
49-9021 Heating, Air Conditioning, and Refrigeration
Mechanics and Installers 1,075 1,414 Avg Excl VocEd 0 LTOJT
49-9031 Home Appliance Repairers 153 139 -Avg Poor HS 0
MOJT
49-9041 Industrial Machinery Mechanics 695 784 +Avg Good
HS 0 LTOJT
49-9044 Millwrights 122 125 Avg Poor HS 0 LTOJT
49-9051 Electrical Power-Line Installers and Repairers 286 287
+Avg Poor HS 0 LTOJT
49-9052 Telecommunications Line Installers and Repairers
1,361 1,559 +Avg Excl HS 0 LTOJT
49-9062 Medical Equipment Repairers 120 148 Avg Fair Assoc
0 MOJT
49-9069 Precision Instrument and Equipment Repairers,
All Other 64 65 +Avg Poor Assoc 0 LTOJT
49-9071 Maintenance and Repair Workers, General 3,346 3,686
-Avg Excl HS 0 MOJT
49-9091 Coin, Vending, and Amusement Machine Servicers
and Repairers 174 219 -Avg Good HS 0 STOJT
49-9098 Helpers--Installation, Maintenance, and
Repair Workers 385 437 Low Good HS 0 MOJT
49-9799 Installation, Maintenance, and Repair Workers,
All Other 391 421 Avg Fair HS 0 MOJT
51-0000 Production Occupations
51-1011 First-Line Supervisors/Managers of Production and
Operating Workers 1,417 1,493 +Avg Good VocEd 1-5 None
51-2041 Structural Metal Fabricators and Fitters 208 243 Avg
Good HS 0 MOJT
51-2092 Team Assemblers 872 926 Low Good HS 0 MOJT
51-3011 Bakers 294 292 Low Poor <HS 0 LTOJT
51-3021 Butchers and Meat Cutters 191 208 -Avg Fair <HS 0
LTOJT
51-3022 Meat, Poultry, and Fish Cutters and Trimmers 4,879
5,278 Low Excl <HS 0 STOJT
51-3092 Food Batchmakers 35 34 Low Poor HS <1 STOJT
51-3093 Food Cooking Machine Operators and Tenders 53 52
Low Poor HS <1 STOJT
51-4011 Computer-Controlled Machine Tool Operators, Metal
and Plastic 97 112 -Avg Fair HS 0 MOJT
51-4012 Numerical Tool and Process Control Programmers 15
16 Avg Poor HS 0 MOJT
51-4021 Extruding and Drawing Machine Setters, Operators,
and Tenders, Metal and Plastic 355 467 -Avg Good HS 0 MOJT
51-4031 Cutting, Punching, and Press Machine Setters,
Operators, and Tenders, Metal and Plastic 234 219 -Avg Poor
HS 0 MOJT
51-4032 Drilling and Boring Machine Tool Setters, Operators,
and Tenders, Metal and Plastic 40 35 Low Poor HS 0 MOJT
51-4033 Grinding, Lapping, Polishing, and Buffing Machine
Tool Setters, Operators, and Tenders, Metal
and Plastic 73 80 -Avg Fair HS 0 MOJT
51-4041 Machinists 475 542 Avg Good HS 0 LTOJT
51-4072 Molding, Coremaking, and Casting Machine Setters,
Operators, and Tenders, Metal and Plastic 87 92 -Avg Poor HS
0 MOJT
51-4081 Multiple Machine Tool Setters, Operators, and
Tenders, Metal and Plastic 170 195 -Avg Fair HS 0 MOJT
Occupation Projections by Occupational Group
SOC
Code Title of Occupation
2010
Est.
Empl
2020
Proj.
Empl.
Wage
Cat.
Job
Avail. Educ.
Work
Exp.
Job
Training
Occupation & Industry Projections 17
51-4121 Welders, Cutters, Solderers, and Brazers 501 627 Avg
Good HS <1 MOJT
51-5111 Prepress Technicians and Workers 64 53 Avg Poor
VocEd 0 None
51-5112 Printing Press Operators and Job Printers 274 263 Avg
Poor HS 0 MOJT
51-5113 PrInt Binding and Finishing Workers 83 76 -Avg Poor
HS 0 STOJT
51-6011 Laundry and Dry-Cleaning Workers 873 880 Low Fair
<HS 0 STOJT
51-6031 Sewing Machine Operators 133 125 Low Poor <HS 0
STOJT
51-6041 Shoe and Leather Workers and Repairers 29 29 Avg
Poor HS 0 MOJT
51-6093 Upholsterers 81 81 -Avg Poor HS 0 MOJT
51-7011 Cabinetmakers and Bench Carpenters 324 307 -Avg
Poor HS 0 MOJT
51-7021 Furniture Finishers 27 35 -Avg Fair HS 0 STOJT
51-7042 Woodworking Machine Setters, Operators, and
Tenders, Except Sawing 42 38 Low Poor HS 0 STOJT
51-8013 Power Plant Operators 166 158 High Poor HS 0 LTOJT
51-8021 Stationary Engineers and Boiler Operators 63 65 +Avg
Poor HS 0 LTOJT
51-8031 Water and Liquid Waste Treatment Plant and
System Operators 324 388 Avg Good HS 0 LTOJT
51-8091 Chemical Plant and System Operators 111 94 +Avg
Poor HS 0 LTOJT
51-8092 Gas Plant Operators 20 18 +Avg Poor HS 0 LTOJT
51-9011 Chemical Equipment Operators and Tenders 514 459
+Avg Poor HS 0 MOJT
51-9012 Separating, Filtering, Clarifying, Precipitating, and
Still
Machine Setters, Operators, and Tenders 126 129 -Avg Poor HS
0 MOJT
51-9021 Crushing, Grinding, and Polishing Machine Setters,
Operators, and Tenders 107 117 Low Fair HS 0 MOJT
51-9023 Mixing and Blending Machine Setters, Operators,
and Tenders 144 211 Avg Good HS 0 MOJT
51-9031 Cutters and Trimmers, Hand 18 17 -Avg Poor <HS 0
STOJT
51-9032 Cutting and Slicing Machine Setters, Operators,
and Tenders 165 151 -Avg Poor HS 0 STOJT
51-9041 Extruding, Forming, Pressing, and Compacting
Machine Setters, Operators, and Tenders 245 206 -Avg Poor HS
0 MOJT
51-9051 Furnace, Kiln, Oven, Drier, and Kettle Operators
and Tenders 25 25 Avg Poor HS 0 MOJT
51-9061 Inspectors, Testers, Sorters, Samplers, and Weighers
1,129 1,284 -Avg Excl HS 0 MOJT
51-9082 Medical Appliance Technicians 49 50 -Avg Poor HS 0
LTOJT
51-9083 Ophthalmic Laboratory Technicians 17 20 -Avg Poor
HS 0 MOJT
51-9111 Packaging and Filling Machine Operators and Tenders
1,269 1,363 -Avg Good HS 0 MOJT
51-9121 Coating, Painting, and Spraying Machine Setters,
Operators, and Tenders 31 34 Avg Poor HS 0 MOJT
51-9122 Painters, Transportation Equipment 139 147 Avg Fair
HS 0 MOJT
51-9191 Cementing and Gluing Machine Operators
and Tenders 33 29 Low Poor HS 0 MOJT
51-9196 Paper Goods Machine Setters, Operators, and Tenders
46 39 -Avg Poor HS 0 MOJT
51-9198 Helpers--Production Workers 763 869 Low Good <HS
0 STOJT
51-9399 Production Workers, All Other 173 173 Low Poor HS 0
MOJT
Occupation Projections by Occupational Group
SOC
Code Title of Occupation
2010
Est.
Empl
2020
Proj.
Empl.
Wage
Cat.
Job
Avail. Educ.
Work
Exp.
Job
Training
18 Delaware 2020
53-0000 Transportation and Material Moving Occupations
53-1021 First-Line Supervisors/Managers of Helpers, Laborers,
and Material Movers, Hand 468 570 Avg Good HS 1-5 None
53-1031 First-Line Supervisors/Managers of Transportation
and Material-Moving Machine and Vehicle Operators 549 607
+Avg Good HS 1-5 None
53-2012 Commercial Pilots 93 126 High Fair VocEd 0 None
53-3011 Ambulance Drivers and Attendants, Except Emergency
Medical Technicians 123 155 Low Fair HS 0 MOJT
53-3021 Bus Drivers, Transit and Intercity 150 160 Low Fair
HS 0 MOJT
53-3022 Bus Drivers, School 1,675 1,895 Low Excl HS 0 MOJT
53-3031 Driver/Sales Workers 1,296 1,419 Low Good HS 0
STOJT
53-3032 Truck Drivers, Heavy and Tractor-Trailer 3,781 4,473
Avg Excl HS 1-5 STOJT
53-3033 Truck Drivers, Light or Delivery Services 2,639 2,822
-Avg Excl HS 0 STOJT
53-3041 Taxi Drivers and Chauffeurs 628 707 Low Good <HS 0
STOJT
53-3099 Motor Vehicle Operators, All Other 391 425 Low Good
HS 0 STOJT
53-5011 Sailors and Marine Oilers 20 22 -Avg Poor <HS 0
STOJT
53-5021 Captains, Mates, and Pilots of Water Vessels 33 37
High Poor Bach 0 None
53-6021 Parking Lot Attendants 407 412 Low Poor <HS 0
STOJT
53-6031 Service Station Attendants 93 104 Low Fair <HS 0
STOJT
53-6051 Transportation Inspectors 117 136 Avg Fair HS 0
STOJT
53-6099 Transportation Workers, All Other 38 47 Low Fair HS
0 STOJT
53-7011 Conveyor Operators and Tenders 13 15 -Avg Poor <HS
0 STOJT
53-7021 Crane and Tower Operators 131 139 +Avg Fair <HS 1-
5 LTOJT
53-7032 Excavating and Loading Machine and
Dragline Operators 261 318 Avg Good <HS 1-5 MOJT
53-7051 Industrial Truck and Tractor Operators 984 1,079 -Avg
Good <HS <1 STOJT
53-7062 Laborers and Freight, Stock, and Material
Movers, Hand 5,479 6,136 Low Excl <HS 0 STOJT
53-7064 Packers and Packagers, Hand 1,607 1,725 Low Good
<HS 0 STOJT
53-7081 Refuse and Recyclable Material Collectors 496 614 -
Avg Good <HS 0 STOJT
53-7121 Tank Car, Truck, and Ship Loaders 433 431 +Avg Poor
<HS 0 STOJT
19Occupation & Industry Projections
Career Cluster
Average
Wage 2010 Rank
Total
Openings Rank
Percent Total
Openings New Jobs
Ann. Pct.
Growth
Agriculture, Food, & Natural Resources $28,426 15th 5,567
10th 3.8% 1,585 3.3%
Architecture & Construction $48,244 10th 11,212 5th 7.7%
5,458 11.4%
Arts, A/V Technology & Communications $51,886 8th 1,900
15th 1.3% 666 1.4%
Business Management & Administration $53,227 7th 17,771 3rd
12.2% 5,012 10.5%
Education & Training $49,107 9th 7,511 7th 5.2% 2,277 4.8%
Finance $55,595 5th 6,729 8th 4.6% 1,899 4.0%
Government & Public Administration $54,207 6th 916 16th
0.6% 343 0.7%
Health Science $61,231 4th 17,264 4th 11.9% 9,645 20.2%
Hospitality & Tourism $23,349 16th 21,661 2nd 14.9% 5,153
10.8%
Human Services $30,926 14th 5,834 9th 4.0% 2,500 5.2%
Information Technology $80,562 1st 3,974 13th 2.7% 1,466
3.1%
Law, Public Safety & Security $65,020 3rd 4,575 11th 3.1%
1,261 2.6%
Manufacturing $46,145 11th 4,304 12th 3.0% 1,267 2.7%
Marketing, Sales & Service $38,865 12th 22,708 1st 15.6%
5,267 11.0%
Science, Technology, Engineering & Mathematics $78,735 2nd
2,549 14th 1.8% 494 1.0%
Transportation, Distribution & Logistics $37,353 13th 11,041
6th 7.6% 3,483 7.3%
Wages, Projected Openings, and Growth by Career Cluster,
2010–2020
Occupation Projections by Career Cluster
This section contains occupations
grouped by career clusters. The US
Department of Education developed
these 16 groupings as a way to link
school and work, helping students
to choose a curriculum which is
best suited to their career plans. The
occupations listed here are the same
ones displayed in the previous section;
they are simply organized differently.
Occupations are arranged alphabetically
within each of the 16 career clusters.
For each occupation, we provide
its SOC code, forecasted average
annual growth rate from 2010 to
2020, average annual openings due to
growth for that period, average annual
openings due to net replacement
of workers (the total expected job
openings in an average year would
be the sum of these two numbers),
and the estimated 2010 average
annual wage. The SOC code
can be used to refer back to the
previous section to find the usual
education, experience, and training
requirements for the occupation.
The Marketing, Sales & Service
cluster is expected to generate
the most job openings, more than
22,700, while the Government and
Public Administration cluster is
expected to generate the fewest, at
just over 900. This is not to say that
government as an employer will
grow the slowest (total government
employment is actually expected to
grow at the same pace as the overall
average); the great majority of jobs
in government are to be found in
other career clusters (for example,
public school teachers are in the
Education and Training cluster, while
computer programmers who work
for a government agency would be
found in the Information Technology
cluster).
Information Technology is the highest-
paying cluster; its occupations paid
an average wage of $80,562 in 2010.
Hospitality and Tourism had the
lowest average wage; this cluster’s
occupations paid an average $23,349
in 2010. Averages for all 16 career
clusters can be found in the table
below, along with their ranking
among the 16 clusters.
20 Delaware 2020
SOC
Code Title of Occupation
Average
Annual
Growth
Rate
Average
Annual
Openings
due to
Growth
Average
Annual
Openings
due to
Replacements
2010 Average
Annual Wages
Table 2: Occupation Projections by Career Cluster
Agriculture, Food and Natural Resources
45-2091 Agricultural Equipment Operators 0.0% 0 6 $29,765
45-2021 Animal Breeders -0.7% 0 0 NA
39-2011 Animal Trainers 0.8% 1 2 $40,269
19-1029 Biological Scientists, All Other 0.4% 0 1 $66,331
51-3021 Butchers and Meat Cutters 0.9% 2 6 $33,779
19-1031 Conservation Scientists 0.3% 0 0 $63,794
17-3025 Environmental Engineering Technicians 1.5% 1 1
$53,498
17-2081 Environmental Engineers 0.7% 1 3 $76,606
49-3041 Farm Equipment Mechanics 1.9% 2 2 $34,570
11-9013 Farmers, Ranchers, and Other Agricultural Managers -
0.7% 0 50 NA
45-2092 Farmworkers and Laborers, Crop, Nursery, and
Greenhouse 0.0% 0 57 $26,416
45-2093 Farmworkers, Farm and Ranch Animals 0.4% 2 14
$23,650
45-1011 First-Line Supervisors/Managers of Farming, Fishing,
and
Forestry Workers 0.0% 0 5 $50,066
37-1012 First-Line Supervisors/Managers of Landscaping, Lawn
Service,
and Groundskeeping Workers 2.0% 10 6 $51,376
19-1032 Foresters 0.0% 0 0 $50,523
37-3019 Grounds Maintenance Workers, All Other 0.4% 0 0
$51,189
37-3011 Landscaping and Groundskeeping Workers 2.1% 75 57
$24,960
51-3022 Meat, Poultry, and Fish Cutters and Trimmers 0.8% 40
142 $22,776
39-2021 Nonfarm Animal Caretakers 1.0% 9 19 $23,982
37-2021 Pest Control Workers 2.1% 4 8 $34,653
37-3012 Pesticide Handlers, Sprayers, and Applicators,
Vegetation 0.7% 1 3 $36,982
19-1013 Soil and Plant Scientists 1.4% 1 3 $51,750
29-1131 Veterinarians 2.3% 5 4 $112,070
31-9096 Veterinary Assistants and Laboratory Animal
Caretakers 0.2% 0 4 $24,294
29-2056 Veterinary Technologists and Technicians 1.5% 4 4
$29,640
19-1023 Zoologists and Wildlife Biologists -0.8% 0 0 $83,866
Architecture and Construction
17-1011 Architects, Except Landscape and Naval 1.8% 2 2
$80,413
17-3011 Architectural and Civil Drafters -0.3% 0 6 $51,210
47-2011 Boilermakers 0.6% 0 1 $57,200
47-2021 Brickmasons and Blockmasons 1.6% 6 6 $45,739
47-2031 Carpenters 2.6% 69 51 $43,285
Occupation & Industry Projections 21
Occupation Projections by Career Cluster
SOC
Code Title of Occupation
Average
Annual
Growth
Rate
Average
Annual
Openings
due to
Growth
Average
Annual
Openings
due to
Replacements
2010 Average
Annual Wages
47-2051 Cement Masons and Concrete Finishers 2.6% 10 5
$41,746
17-2051 Civil Engineers 1.2% 13 21 $76,773
49-9091 Coin, Vending, and Amusement Machine Servicers and
Repairers 2.3% 4 3 $36,338
47-4011 Construction and Building Inspectors 1.6% 7 12
$47,424
47-4799 Construction and Related Workers, All Other 1.2% 0 2
$38,085
47-2061 Construction Laborers 1.8% 52 21 $30,680
11-9021 Construction Managers 2.4% 31 8 $103,834
49-9012 Control and Valve Installers and Repairers, Except
Mechanical Door -0.6% 0 2 $57,346
13-1051 Cost Estimators 2.9% 24 14 $63,086
53-7021 Crane and Tower Operators 0.6% 1 4 $51,043
17-3019 Drafters, All Other 0.0% 0 0 $52,478
47-2081 Drywall and Ceiling Tile Installers 2.2% 6 8 $44,866
47-5021 Earth Drillers, Except Oil and Gas 1.3% 1 1 $43,160
17-3012 Electrical and Electronics Drafters 1.1% 2 3 $57,179
49-2095 Electrical and Electronics Repairers, Powerhouse,
Substation,
and Relay 0.5% 2 7 $68,307
49-9051 Electrical Power-Line Installers and Repairers 0.0% 0
10 $62,899
47-2111 Electricians 1.6% 29 46 $48,381
53-7032 Excavating and Loading Machine and Dragline
Operators 2.0% 6 8 $46,509
47-1011 First-Line Supervisors/Managers of Construction
Trades and
Extraction Workers 2.5% 55 46 $65,291
47-4041 Hazardous Materials Removal Workers 1.4% 2 4
$38,438
49-9021 Heating, Air Conditioning, and Refrigeration
Mechanics
and Installers 2.8% 34 19 $46,509
47-3019 Helpers, Construction Trades, All Other 2.0% 2 3
$27,789
47-3011 Helpers--Brickmasons, Blockmasons, Stonemasons,
and Tile and
Marble Setters 2.4% 2 2 $32,594
47-3012 Helpers--Carpenters 3.2% 6 4 $27,830
47-3013 Helpers--Electricians 1.9% 3 4 $29,370
49-9098 Helpers--Installation, Maintenance, and Repair
Workers 1.3% 5 18 $27,352
47-3015 Helpers--Pipelayers, Plumbers, Pipefitters, and
Steamfitters 3.6% 6 4 $26,187
47-4051 Highway Maintenance Workers 1.3% 0 1 $30,098
49-9031 Home Appliance Repairers -1.0% 0 3 $34,299
49-9799 Installation, Maintenance, and Repair Workers, All
Other 0.7% 3 7 $39,603
47-2132 Insulation Workers, Mechanical 2.2% 8 13 $45,094
17-1012 Landscape Architects 1.1% 1 2 $51,626
49-9071 Maintenance and Repair Workers, General 1.0% 34 62
$36,587
49-9011 Mechanical Door Repairers 1.7% 1 1 $36,941
17-3013 Mechanical Drafters 1.9% 5 4 $60,757
22 Delaware 2020
Occupation Projections by Career Cluster
SOC
Code Title of Occupation
Average
Annual
Growth
Rate
Average
Annual
Openings
due to
Growth
Average
Annual
Openings
due to
Replacements
2010 Average
Annual Wages
47-2073 Operating Engineers and Other Construction
Equipment Operators 1.4% 18 28 $41,038
47-2141 Painters, Construction and Maintenance 1.8% 18 21
$34,715
47-2071 Paving, Surfacing, and Tamping Equipment Operators
2.0% 5 4 $39,894
47-2072 Pile-Driver Operators 2.9% 0 0 $36,234
47-2151 Pipelayers 2.1% 3 4 $38,126
47-2152 Plumbers, Pipefitters, and Steamfitters 2.2% 39 47
$49,483
47-4061 Rail-Track Laying and Maintenance Equipment
Operators 0.1% 0 2 $47,819
47-2181 Roofers 1.2% 3 5 $38,750
49-2098 Security and Fire Alarm Systems Installers 2.5% 6 6
$53,643
47-4071 Septic Tank Servicers and Sewer Pipe Cleaners 2.0% 2
2 $37,898
47-2211 Sheet Metal Workers 1.3% 8 10 $48,984
47-2022 Stonemasons 3.7% 1 1 $43,618
47-2221 Structural Iron and Steel Workers 1.6% 4 5 $42,723
51-2041 Structural Metal Fabricators and Fitters 1.6% 4 4
$42,016
17-1022 Surveyors 1.6% 2 3 $70,845
Arts, Audio/Visual and Communications
25-4011 Archivists 0.2% 0 1 $42,682
27-1011 Art Directors 0.8% 1 1 $83,179
27-4011 Audio and Video Equipment Technicians 1.5% 2 3
$44,866
25-9011 Audio-Visual Collections Specialists 0.6% 0 1 $37,149
27-4012 Broadcast Technicians 2.3% 1 1 $46,571
27-1021 Commercial and Industrial Designers -0.9% 0 1
$62,442
23-2091 Court Reporters 1.6% 1 1 $53,040
25-4012 Curators 1.5% 1 2 $52,166
43-9031 Desktop Publishers -1.1% 0 1 $36,525
27-3041 Editors 0.8% 2 7 $61,672
49-2097 Electronic Home Entertainment Equipment Installers
and Repairers 0.4% 0 4 $32,926
27-1024 Graphic Designers 1.2% 7 16 $48,402
25-4013 Museum Technicians and Conservators 0.2% 0 1
$39,499
27-2041 Music Directors and Composers 0.0% 0 1 $81,578
27-4021 Photographers 0.7% 2 2 $32,843
51-5111 Prepress Technicians and Workers -1.9% 0 2 $41,018
51-5113 Print Binding and Finishing Workers -0.9% 0 3
$32,178
51-5112 Printing Press Operators and Job Printers -0.4% 0 5
$43,014
27-3031 Public Relations Specialists 1.4% 15 25 $58,968
27-3011 Radio and Television Announcers 2.3% 1 1 $42,578
27-3022 Reporters and Correspondents -0.7% 0 3 $36,920
27-1027 Set and Exhibit Designers 1.4% 0 0 $46,862
Occupation & Industry Projections 23
Occupation Projections by Career Cluster
SOC
Code Title of Occupation
Average
Annual
Growth
Rate
Average
Annual
Openings
due to
Growth
Average
Annual
Openings
due to
Replacements
2010 Average
Annual Wages
27-3042 Technical Writers 1.7% 2 2 $62,587
49-2022 Telecommunications Equipment Installers and
Repairers, Except
Line Installers 1.9% 9 7 $52,395
49-9052 Telecommunications Line Installers and Repairers
1.4% 20 25 $55,494
43-2021 Telephone Operators -1.2% 0 2 $28,246
27-3043 Writers and Authors 1.5% 4 6 $59,363
Business Management and Administration
13-2011 Accountants and Auditors 0.8% 40 102 $66,040
11-3011 Administrative Services Managers 0.6% 5 19 $95,680
43-3021 Billing and Posting Clerks and Machine Operators
1.2% 28 37 $34,632
13-2031 Budget Analysts 1.0% 2 3 $63,419
13-1199 Business Operations Specialists, All Other 0.9% 17 36
$64,834
11-1011 Chief Executives 0.7% 3 10 $219,232
11-3111 Compensation and Benefits Managers -0.8% 0 4
$102,898
13-1141 Compensation, Benefits, and Job Analysis Specialists -
0.2% 0 5 $66,310
43-5021 Couriers and Messengers -0.4% 0 5 $27,227
43-4051 Customer Service Representatives 1.0% 82 217
$39,229
43-9021 Data Entry Keyers -1.4% 0 19 $27,040
43-6011 Executive Secretaries and Administrative Assistants
0.3% 7 35 $49,358
43-4071 File Clerks -1.2% 0 19 $27,539
43-1011 First-Line Supervisors/Managers of Office and
Administrative
Support Workers 0.8% 41 128 $52,312
11-1021 General and Operations Managers 1.0% 48 80 $132,496
43-4161 Human Resources Assistants, Except Payroll and
Timekeeping 0.4% 2 11 $35,797
11-3121 Human Resources Managers 0.4% 1 6 $126,069
13-1078 Human Resources, Labor Relations, and Training
Specialists,
All Other 0.9% 14 26 $60,528
43-4199 Information and Record Clerks, All Other 0.1% 0 9
$41,080
43-4111 Interviewers, Except Eligibility and Loan 1.3% 8 12
$33,675
43-9051 Mail Clerks and Mail Machine Operators, Except
Postal Service 1.1% 5 8 $23,816
13-1111 Management Analysts 0.8% 16 33 $80,954
11-9199 Managers, All Other 0.0% 0 26 $122,533
43-5041 Meter Readers, Utilities -0.5% 0 4 $43,493
43-9799 Office and Administrative Support Workers, All Other
1.4% 7 11 $33,426
43-9061 Office Clerks, General 1.1% 106 169 $27,165
43-9071 Office Machine Operators, Except Computer -1.5% 0 9
$26,603
43-4151 Order Clerks 0.8% 4 14 $30,014
43-9081 Proofreaders and Copy Markers 0.5% 0 0 $36,338
11-2031 Public Relations Managers 0.1% 0 7 $136,531
43-4171 Receptionists and Information Clerks 1.6% 58 99
$24,898
24 Delaware 2020
Occupation Projections by Career Cluster
SOC
Code Title of Occupation
Average
Annual
Growth
Rate
Average
Annual
Openings
due to
Growth
Average
Annual
Openings
due to
Replacements
2010 Average
Annual Wages
43-6014 Secretaries, Except Legal, Medical, and Executive -
0.1% 0 78 $35,443
43-2011 Switchboard Operators, Including Answering Service -
2.6% 0 6 $26,000
13-2082 Tax Preparers 0.1% 0 8 $42,827
11-3131 Training and Development Managers -0.2% 0 3
$131,310
13-1151 Training and Development Specialists 0.7% 6 15
$61,256
43-9022 Word Processors and Typists -1.5% 0 2 $35,526
Education and Training
25-3011 Adult Literacy, Remedial Education, and GED
Teachers
and Instructors 1.0% 3 5 $50,502
11-9039 Education Administrators, All Other 1.5% 1 1 $65,894
11-9032 Education Administrators, Elementary and Secondary
School 0.5% 3 17 $102,308
11-9031 Education Administrators, Preschool and Child Care
Center/Program 1.2% 4 8 $51,064
25-9099 Education, Training, and Library Workers, All Other
0.3% 0 3 $43,264
21-1012 Educational, Vocational, and School Counselors 1.3%
13 20 $57,699
25-2021 Elementary School Teachers, Except Special Education
1.1% 43 79 $54,702
21-1091 Health Educators 3.2% 7 4 $59,592
25-9031 Instructional Coordinators 1.4% 6 9 $62,005
25-2012 Kindergarten Teachers, Except Special Education 1.2%
5 10 $52,521
25-4021 Librarians 0.5% 3 12 $60,778
43-4121 Library Assistants, Clerical 1.0% 3 13 $20,800
25-4031 Library Technicians 0.8% 2 11 $35,714
25-2022 Middle School Teachers, Except Special and
Vocational Education 1.1% 30 55 $54,226
25-2011 Preschool Teachers, Except Special Education 1.1% 23
49 $24,690
25-2031 Secondary School Teachers, Except Special and
Vocational Education 0.2% 8 83 $55,483
25-3021 Self-Enrichment Education Teachers 1.6% 8 7 $46,654
25-2053 Special Education Teachers, Middle School 1.4% 4 9
$55,672
25-2041 Special Education Teachers, Preschool, Kindergarten,
and
Elementary School 1.4% 26 51 $48,092
25-2054 Special Education Teachers, Secondary School 0.3% 1
6 $61,231
25-9041 Teacher Assistants 1.0% 22 48 $27,920
25-3999 Teachers and Instructors, All Other 0.9% 10 16
$44,047
25-1194 Vocational Education Teachers, Postsecondary 0.9% 3
5 $47,757
Finance
43-3011 Bill and Account Collectors 0.5% 10 37 $33,405
43-3031 Bookkeeping, Accounting, and Auditing Clerks 0.9%
57 67 $35,755
43-4011 Brokerage Clerks -0.3% 0 4 $43,576
13-1031 Claims Adjusters, Examiners, and Investigators 0.7% 6
22 $63,024
13-2041 Credit Analysts 0.8% 10 25 $63,877
Occupation & Industry Projections 25
Occupation Projections by Career Cluster
SOC
Code Title of Occupation
Average
Annual
Growth
Rate
Average
Annual
Openings
due to
Growth
Average
Annual
Openings
due to
Replacements
2010 Average
Annual Wages
43-4041 Credit Authorizers, Checkers, and Clerks -0.3% 0 24
$39,291
13-2051 Financial Analysts 0.8% 17 41 $84,178
11-3031 Financial Managers 0.1% 2 43 $134,784
43-9041 Insurance Claims and Policy Processing Clerks 1.1%
10 25 $36,608
41-3021 Insurance Sales Agents 2.6% 36 28 $55,162
13-2053 Insurance Underwriters 0.8% 3 12 $60,403
13-2071 Loan Counselors 0.4% 1 5 $39,104
43-4131 Loan Interviewers and Clerks -1.3% 0 20 $37,336
13-2072 Loan Officers 0.6% 5 19 $60,237
43-4141 New Accounts Clerks -0.4% 0 9 $34,029
43-3051 Payroll and Timekeeping Clerks 1.3% 5 8 $38,605
13-2052 Personal Financial Advisors 2.6% 27 11 $82,930
13-2081 Tax Examiners, Collectors, and Revenue Agents 0.6%
2 5 $52,832
43-3071 Tellers -0.6% 0 76 $25,189
23-2093 Title Examiners, Abstractors, and Searchers -0.8% 0 1
$39,603
Government and Public Administration
13-1041 Compliance Officers, Except Agriculture,
Construction, Health and
Safety, and Transportation 1.4% 16 13 $57,970
43-4031 Court, Municipal, and License Clerks 0.6% 4 20
$32,510
11-9161 Emergency Management Directors 0.6% 0 0 $63,981
13-2061 Financial Examiners 0.7% 1 4 $83,283
11-9151 Social and Community Service Managers 1.4% 11 16
$61,048
19-3051 Urban and Regional Planners 0.7% 1 5 $60,611
Health Sciences
29-1061 Anesthesiologists 1.7% 2 2 $209,518
29-1181 Audiologists 2.0% 1 0 $62,046
29-2031 Cardiovascular Technologists and Technicians 2.4% 6
4 $53,102
29-1011 Chiropractors 2.1% 4 3 $103,314
31-9091 Dental Assistants 1.8% 15 16 $35,922
29-2021 Dental Hygienists 2.3% 15 12 $71,261
29-1021 Dentists, General 1.4% 6 13 $195,312
29-2032 Diagnostic Medical Sonographers 3.3% 8 3 $61,360
29-2051 Dietetic Technicians 1.3% 2 2 $27,373
29-1031 Dietitians and Nutritionists 1.8% 3 6 $57,429
29-2041 Emergency Medical Technicians and Paramedics 2.1%
22 19 $38,189
29-1062 Family and General Practitioners 1.8% 10 11 $156,582
29-1199 Health Diagnosing and Treating Practitioners, All
Other 1.8% 0 0 $70,678
29-2799 Health Technologists and Technicians, All Other 2.0%
5 5 $40,955
26 Delaware 2020
Occupation Projections by Career Cluster
SOC
Code Title of Occupation
Average
Annual
Growth
Rate
Average
Annual
Openings
due to
Growth
Average
Annual
Openings
due to
Replacements
2010 Average
Annual Wages
29-9799 Healthcare Practitioners and Technical Workers, All
Other,
Including Genetic Counselors 0.5% 0 2 $65,125
31-9799 Healthcare Support Workers, All Other 0.9% 3 4
$36,296
31-1011 Home Health Aides 2.6% 62 27 $24,419
29-1063 Internists, General 1.8% 5 5 $205,962
29-2061 Licensed Practical and Licensed Vocational Nurses
1.9% 48 62 $47,798
31-9011 Massage Therapists 3.0% 6 3 $57,824
29-2012 Medical and Clinical Laboratory Technicians 1.2% 4 6
$45,302
29-2011 Medical and Clinical Laboratory Technologists 0.4% 2
8 $60,674
11-9111 Medical and Health Services Managers 1.8% 18 23
$101,566
31-9092 Medical Assistants 2.0% 30 21 $29,994
31-9093 Medical Equipment Preparers 1.4% 3 3 $33,509
29-2071 Medical Records and Health Information Technicians
1.6% 8 9 $33,322
43-6013 Medical Secretaries 2.5% 119 57 $31,824
31-9094 Medical Transcriptionists -0.5% 0 3 $36,338
29-2033 Nuclear Medicine Technologists 1.4% 2 2 $68,099
31-1012 Nursing Aides, Orderlies, and Attendants 1.8% 108 71
$27,934
29-1064 Obstetricians and Gynecologists 1.7% 2 2 $222,186
29-9011 Occupational Health and Safety Specialists 1.1% 5 16
$62,275
29-9012 Occupational Health and Safety Technicians 2.0% 0 0
$39,146
31-2011 Occupational Therapist Assistants 2.1% 2 1 $56,139
29-1122 Occupational Therapists 2.2% 8 7 $69,805
29-2081 Opticians, Dispensing 1.3% 4 5 $33,405
29-1041 Optometrists 2.2% 3 4 $80,662
29-1065 Pediatricians, General 1.8% 2 2 $134,222
29-1051 Pharmacists 1.8% 13 16 $117,000
31-9095 Pharmacy Aides 0.8% 0 0 $19,406
29-2052 Pharmacy Technicians 2.5% 32 20 $27,539
31-2022 Physical Therapist Aides 3.1% 6 2 $25,626
31-2021 Physical Therapist Assistants 2.7% 5 2 $53,976
29-1123 Physical Therapists 2.9% 21 7 $86,362
29-1071 Physician Assistants 2.0% 7 6 $92,248
29-1069 Physicians and Surgeons, All Other 1.6% 21 24
$180,627
29-1081 Podiatrists 1.6% 2 2 $145,184
31-1013 Psychiatric Aides 1.6% 2 1 $31,138
29-1066 Psychiatrists 1.5% 2 2 $153,296
29-1124 Radiation Therapists 1.2% 1 1 $84,635
29-2037 Radiologic Technologists and Technicians 2.2% 26 16
$61,464
29-1125 Recreational Therapists 1.3% 1 2 $37,981
Occupation & Industry Projections 27
Occupation Projections by Career Cluster
SOC
Code Title of Occupation
Average
Annual
Growth
Rate
Average
Annual
Openings
due to
Growth
Average
Annual
Openings
due to
Replacements
2010 Average
Annual Wages
29-1111 Registered Nurses 2.2% 250 189 $70,928
29-1126 Respiratory Therapists 2.6% 12 8 $59,758
29-1127 Speech-Language Pathologists 2.0% 9 7 $75,858
29-1067 Surgeons 1.8% 5 6 $224,286
29-2055 Surgical Technologists 1.5% 5 6 $41,371
29-1128 Therapists, All Other 3.7% 4 2 $48,443
Hospitality and Tourism
39-3091 Amusement and Recreation Attendants 1.2% 9 41
$18,866
35-3011 Bartenders 0.8% 15 62 $24,336
35-1011 Chefs and Head Cooks 0.2% 0 3 $49,088
35-3021 Combined Food Preparation and Serving Workers,
Including
Fast Food 1.4% 145 267 $17,763
35-2011 Cooks, Fast Food -0.3% 0 18 $19,219
35-2012 Cooks, Institution and Cafeteria -0.2% 0 47 $28,288
35-2014 Cooks, Restaurant 1.3% 53 85 $23,608
35-2015 Cooks, Short Order 0.4% 0 3 $23,483
35-3022 Counter Attendants, Cafeteria, Food Concession, and
Coffee Shop 0.8% 12 111 $19,781
35-9011 Dining Room and Cafeteria Attendants and Bartender
Helpers 1.1% 12 37 $18,013
35-9021 Dishwashers 0.7% 11 76 $18,782
39-3099 Entertainment Attendants and Related Workers, All
Other 0.8% 1 3 $22,090
35-1012 First-Line Supervisors/Managers of Food Preparation
and
Serving Workers 1.0% 29 60 $35,610
37-1011 First-Line Supervisors/Managers of Housekeeping and
Janitorial Workers -0.1% 0 7 $37,440
39-1021 First-Line Supervisors/Managers of Personal Service
Workers 1.1% 12 26 $37,315
35-9099 Food Preparation and Serving Related Workers, All
Other -1.1% 0 5 $20,613
35-2021 Food Preparation Workers 1.2% 20 60 $20,717
35-3041 Food Servers, Nonrestaurant 1.1% 5 13 $21,174
11-9051 Food Service Managers 1.8% 7 7 $68,016
39-3012 Gaming and Sports Book Writers and Runners 1.2% 2 5
$36,795
39-1011 Gaming Supervisors 1.6% 0 0 $51,043
35-9031 Hosts and Hostesses, Restaurant, Lounge, and Coffee
Shop 0.4% 6 93 $18,117
43-4081 Hotel, Motel, and Resort Desk Clerks 0.7% 6 29
$21,237
37-2011 Janitors and Cleaners, Except Maids and Housekeeping
Cleaners 0.8% 69 149 $24,357
11-9081 Lodging Managers 0.6% 1 4 $75,462
37-2012 Maids and Housekeeping Cleaners 0.9% 25 46 $19,802
13-1121 Meeting and Convention Planners 1.1% 3 5 $48,797
39-1012 Slot Key Persons -1.2% 0 0 $38,522
28 Delaware 2020
Occupation Projections by Career Cluster
SOC
Code Title of Occupation
Average
Annual
Growth
Rate
Average
Annual
Openings
due to
Growth
Average
Annual
Openings
due to
Replacements
2010 Average
Annual Wages
41-3041 Travel Agents 0.7% 1 2 $33,301
27-2023 Umpires, Referees, and Other Sports Officials 0.6% 2 7
$25,355
39-3031 Ushers, Lobby Attendants, and Ticket Takers 0.0% 0
16 $18,325
35-3031 Waiters and Waitresses 0.9% 68 364 $21,403
Human Services
39-9011 Child Care Workers 1.5% 39 76 $19,302
21-1021 Child, Family, and School Social Workers 1.4% 14 23
$39,333
19-3031 Clinical, Counseling, and School Psychologists 2.0%
10 14 $75,254
21-1798 Community and Social Service Specialists, All Other
1.7% 8 9 $33,925
39-3092 Costume Attendants 0.0% 0 1 $29,120
39-9031 Fitness Trainers and Aerobics Instructors 1.3% 30 36
$30,618
39-4021 Funeral Attendants 1.1% 2 7 $30,118
39-4831 Funeral Service Managers, Directors, Morticians, and
Undertakers 2.1% 2 2 $70,034
39-5012 Hairdressers, Hairstylists, and Cosmetologists 2.3% 52
38 $29,515
51-6011 Laundry and Dry-Cleaning Workers 0.1% 1 16 $20,592
39-3093 Locker Room, Coatroom, and Dressing Room
Attendants 0.6% 0 1 $21,050
39-5092 Manicurists and Pedicurists 2.7% 8 5 $24,898
21-1013 Marriage and Family Therapists 0.7% 2 5 $51,896
21-1022 Medical and Public Health Social Workers 1.5% 15 21
$44,304
21-1023 Mental Health and Substance Abuse Social Workers
2.0% 11 12 $39,562
21-1014 Mental Health Counselors 2.6% 6 4 $38,043
39-9021 Personal and Home Care Aides 2.0% 13 5 $20,842
39-9032 Recreation Workers 1.6% 16 15 $25,293
21-1015 Rehabilitation Counselors 1.3% 7 11 $33,904
39-9041 Residential Advisors 2.1% 2 2 $20,571
39-5093 Shampooers -0.3% 0 8 $17,930
21-1093 Social and Human Service Assistants 1.4% 11 16
$29,120
21-1029 Social Workers, All Other 0.5% 1 3 $56,680
21-1011 Substance Abuse and Behavioral Disorder Counselors
1.5% 3 4 $34,861
Information Technology
11-3021 Computer and Information Systems Managers 0.4% 6
24 $130,541
15-1799 Computer Occupations, All Other 0.4% 1 4 $69,909
43-9011 Computer Operators -0.7% 0 5 $39,354
15-1131 Computer Programmers 0.2% 3 29 $78,853
15-1150 Computer Support Specialists 1.1% 24 55 $51,314
15-1121 Computer Systems Analysts 1.1% 34 56 $80,038
49-2011 Computer, Automated Teller, and Office Machine
Repairers -0.1% 0 6 $31,762
Occupation & Industry Projections 29
Occupation Projections by Career Cluster
SOC
Code Title of Occupation
Average
Annual
Growth
Rate
Average
Annual
Openings
due to
Growth
Average
Annual
Openings
due to
Replacements
2010 Average
Annual Wages
15-1141 Database Administrators 1.6% 10 10 $82,014
15-1179 Information Security Analysts, Web Developers, and
Computer
Network Architects 0.7% 8 15 $82,493
15-1142 Network and Computer Systems Architects and
Administrators 2.3% 21 14 $68,640
15-1132 Software Developers, Applications 1.4% 28 19 $84,635
15-1133 Software Developers, Systems Software 1.0% 13 13
$98,114
Law, Public Safety and Security
23-1021 Administrative Law Judges, Adjudicators, and Hearing
Officers -0.2% 0 2 $64,168
33-9011 Animal Control Workers 2.7% 8 6 $34,819
23-1022 Arbitrators, Mediators, and Conciliators 0.8% 0 1
$40,622
33-9091 Crossing Guards 0.3% 1 7 $28,870
33-2011 Fire Fighters 0.8% 3 10 $43,680
33-2021 Fire Inspectors and Investigators 0.9% 1 2 $47,320
33-1012 First-Line Supervisors/Managers of Police and
Detectives 0.4% 1 10 $87,838
33-1099 First-Line Supervisors/Managers, Protective Service
Workers,
All Other 0.9% 3 11 $43,888
33-9031 Gaming Surveillance Officers and Gaming
Investigators 1.2% 1 1 $28,933
23-1023 Judges, Magistrate Judges, and Magistrates 0.9% 2 3
$130,187
23-1012 Judicial Law Clerks 0.4% 1 3 $39,603
23-1011 Lawyers 0.1% 2 58 $151,757
43-6012 Legal Secretaries -0.5% 0 15 $50,274
23-2099 Legal Support Workers, All Other 0.2% 0 3 $48,110
33-9092 Lifeguards, Ski Patrol, and Other Recreational
Protective
Service Workers 1.2% 10 50 $19,906
23-2011 Paralegals and Legal Assistants 0.8% 10 17 $51,210
33-3041 Parking Enforcement Workers 0.6% 0 1 $33,862
33-3051 Police and Sheriff's Patrol Officers 0.7% 12 48 $58,219
43-5031 Police, Fire, and Ambulance Dispatchers 0.9% 2 4
$39,437
33-9021 Private Detectives and Investigators 1.4% 1 1 $58,074
21-1092 Probation Officers and Correctional Treatment
Specialists 2.1% 15 14 $46,010
33-9099 Protective Service Workers, All Other 1.2% 2 13
$28,621
33-9032 Security Guards 1.5% 51 52 $26,146
Manufacturing
51-3011 Bakers -0.1% 0 8 $24,419
51-7011 Cabinetmakers and Bench Carpenters -0.5% 0 8
$34,902
51-9191 Cementing and Gluing Machine Operators and Tenders
-1.3% 0 0 $27,165
51-9011 Chemical Equipment Operators and Tenders -1.1% 0 8
$53,976
51-8091 Chemical Plant and System Operators -1.6% 0 4
$57,158
30 Delaware 2020
Occupation Projections by Career Cluster
SOC
Code Title of Occupation
Average
Annual
Growth
Rate
Average
Annual
Openings
due to
Growth
Average
Annual
Openings
due to
Replacements
2010 Average
Annual Wages
17-3022 Civil Engineering Technicians 0.3% 1 8 $40,643
51-9121 Coating, Painting, and Spraying Machine Setters,
Operators,
and Tenders 0.9% 0 1 $42,286
51-4011 Computer-Controlled Machine Tool Operators, Metal
and Plastic 1.4% 1 2 $34,507
51-9021 Crushing, Grinding, and Polishing Machine Setters,
Operators,
and Tenders 0.9% 1 3 $24,461
51-9031 Cutters and Trimmers, Hand -0.6% 0 0 $29,786
51-9032 Cutting and Slicing Machine Setters, Operators, and
Tenders -0.9% 0 4 $32,656
51-4031 Cutting, Punching, and Press Machine Setters,
Operators, and
Tenders, Metal and Plastic -0.7% 0 2 $32,115
51-4032 Drilling and Boring Machine Tool Setters, Operators,
and Tenders,
Metal and Plastic -1.3% 0 0 $29,099
49-2092 Electric Motor, Power Tool, and Related Repairers
0.9% 0 0 $39,832
17-3023 Electrical and Electronic Engineering Technicians
1.0% 3 6 $46,675
49-2094 Electrical and Electronics Repairers, Commercial and
Industrial Equipment 0.9% 3 8 $61,672
51-4021 Extruding and Drawing Machine Setters, Operators,
and Tenders,
Metal and Plastic 2.8% 11 7 $29,598
51-9041 Extruding, Forming, Pressing, and Compacting
Machine Setters,
Operators, and Tenders -1.7% 0 6 $35,339
49-1011 First-Line Supervisors/Managers of Mechanics,
Installers,
and Repairers 0.8% 9 33 $64,126
51-1011 First-Line Supervisors/Managers of Production and
Operating Workers 0.5% 8 18 $59,155
51-3092 Food Batchmakers -0.3% 0 1 $26,354
51-3093 Food Cooking Machine Operators and Tenders -0.2% 0
2 $22,422
51-9051 Furnace, Kiln, Oven, Drier, and Kettle Operators and
Tenders 0.0% 0 1 $46,363
51-7021 Furniture Finishers 2.6% 1 1 $36,712
51-8092 Gas Plant Operators -1.0% 0 1 $64,792
51-4033 Grinding, Lapping, Polishing, and Buffing Machine
Tool Setters,
Operators, and Tenders, Metal and Plastic 0.9% 1 1 $30,930
51-9198 Helpers--Production Workers 1.3% 11 13 $22,360
17-3026 Industrial Engineering Technicians 0.7% 1 2 $48,755
49-9041 Industrial Machinery Mechanics 1.2% 9 13 $51,813
11-3051 Industrial Production Managers 1.0% 4 9 $103,064
51-9061 Inspectors, Testers, Sorters, Samplers, and Weighers
1.3% 15 25 $36,566
51-4041 Machinists 1.3% 7 9 $46,800
17-3027 Mechanical Engineering Technicians 0.5% 1 3 $50,170
51-9082 Medical Appliance Technicians 0.2% 0 2 $32,074
49-9062 Medical Equipment Repairers 2.1% 3 3 $47,299
49-9044 Millwrights 0.2% 0 3 $48,194
Occupation & Industry Projections 31
Occupation Projections by Career Cluster
SOC
Code Title of Occupation
Average
Annual
Growth
Rate
Average
Annual
Openings
due to
Growth
Average
Annual
Openings
due to
Replacements
2010 Average
Annual Wages
51-9023 Mixing and Blending Machine Setters, Operators, and
Tenders 3.9% 7 4 $41,080
51-4072 Molding, Coremaking, and Casting Machine Setters,
Operators,
and Tenders, Metal and Plastic 0.6% 0 2 $31,533
51-4081 Multiple Machine Tool Setters, Operators, and
Tenders, Metal
and Plastic 1.4% 2 3 $31,658
51-4012 Numerical Tool and Process Control Programmers
0.6% 0 0 $42,661
51-9083 Ophthalmic Laboratory Technicians 1.6% 0 1 $31,283
51-9122 Painters, Transportation Equipment 0.6% 1 3 $43,576
51-9196 Paper Goods Machine Setters, Operators, and Tenders -
1.6% 0 0 $32,365
51-8013 Power Plant Operators -0.5% 0 6 $68,307
49-9069 Precision Instrument and Equipment Repairers, All
Other 0.2% 0 2 $50,086
51-9399 Production Workers, All Other 0.0% 0 4 $28,288
13-1023 Purchasing Agents, Except Wholesale, Retail, and
Farm Products 0.2% 1 19 $67,454
51-9012 Separating, Filtering, Clarifying, Precipitating, and
Still Machine
Setters, Operators, and Tenders 0.2% 0 2 $34,320
51-6031 Sewing Machine Operators -0.6% 0 1 $25,750
51-6041 Shoe and Leather Workers and Repairers 0.0% 0 1
$45,760
51-8021 Stationary Engineers and Boiler Operators 0.3% 0 1
$56,035
51-2092 Team Assemblers 0.6% 6 17 $28,434
51-6093 Upholsterers 0.0% 0 2 $32,864
51-8031 Water and Liquid Waste Treatment Plant and System
Operators 1.8% 6 8 $42,390
51-4121 Welders, Cutters, Solderers, and Brazers 2.3% 13 13
$42,349
51-7042 Woodworking Machine Setters, Operators, and
Tenders,
Except Sawing -1.0% 0 0 $27,082
Marketing, Sales and Service
41-3011 Advertising Sales Agents 1.2% 3 7 $53,456
13-2021 Appraisers and Assessors of Real Estate 0.6% 1 3
$63,461
41-2011 Cashiers 0.7% 90 552 $20,363
41-2021 Counter and Rental Clerks 1.0% 14 32 $28,038
41-9011 Demonstrators and Product Promoters 1.3% 4 8
$25,438
53-3031 Driver/Sales Workers 0.9% 12 26 $26,811
41-1012 First-Line Supervisors/Managers of Non-Retail Sales
Workers 0.3% 3 22 $79,310
41-1011 First-Line Supervisors/Managers of Retail Sales
Workers 0.6% 33 118 $42,411
27-1023 Floral Designers -1.0% 0 4 $24,960
27-1025 Interior Designers 1.6% 2 4 $46,384
13-1161 Market Research Analysts and Marketing Specialists
0.4% 8 48 $77,771
11-2021 Marketing Managers -0.2% 0 28 $139,422
27-1026 Merchandise Displayers and Window Trimmers 0.9% 3
10 $26,416
53-6021 Parking Lot Attendants 0.1% 0 12 $20,509
32 Delaware 2020
Occupation Projections by Career Cluster
SOC
Code Title of Occupation
Average
Annual
Growth
Rate
Average
Annual
Openings
due to
Growth
Average
Annual
Openings
due to
Replacements
2010 Average
Annual Wages
41-2022 Parts Salespersons 1.1% 8 26 $27,914
43-3061 Procurement Clerks 0.2% 0 10 $35,173
11-9141 Property, Real Estate, and Community Association
Managers 0.8% 5 12 $76,398
11-3061 Purchasing Managers -0.1% 0 5 $110,802
41-9021 Real Estate Brokers 1.1% 1 2 $76,627
41-9022 Real Estate Sales Agents 2.4% 38 31 $60,320
41-2031 Retail Salespersons 1.1% 174 446 $24,357
41-9799 Sales and Related Workers, All Other 1.6% 8 12
$45,781
41-9031 Sales Engineers 1.0% 1 3 $99,050
11-2022 Sales Managers 0.3% 2 20 $141,773
41-3099 Sales Representatives, Services, All Other 1.8% 47 71
$64,147
41-4012 Sales Representatives, Wholesale and Manufacturing,
Except
Technical and Scientific Products 1.3% 34 61 $61,922
41-4011 Sales Representatives, Wholesale and Manufacturing,
Technical
and Scientific Products 1.7% 30 39 $89,794
53-6031 Service Station Attendants 1.1% 1 3 $19,843
43-5081 Stock Clerks and Order Fillers -0.4% 0 114 $22,942
41-9041 Telemarketers 0.1% 1 9 $28,746
13-1022 Wholesale and Retail Buyers, Except Farm Products
1.4% 3 6 $49,442
Science, Technology, Engineering and Mathematics
15-2011 Actuaries 2.6% 4 7 $102,378
19-1021 Biochemists and Biophysicists 2.1% 3 3 $94,786
19-4021 Biological Technicians 0.2% 0 8 $42,744
19-4031 Chemical Technicians 0.6% 4 9 $53,102
19-2031 Chemists 0.0% 0 62 $87,360
15-1111 Computer and Information Research Scientists 1.6% 1
2 $85,717
19-3011 Economists 0.0% 0 1 $71,947
17-2071 Electrical Engineers 0.6% 6 21 $87,027
11-9041 Engineering Managers 0.4% 2 8 $132,434
19-4091 Environmental Science and Protection Technicians,
Including Health 1.5% 2 5 $35,610
19-2041 Environmental Scientists and Specialists, Including
Health 1.4% 6 12 $59,842
19-2042 Geoscientists, Except Hydrologists and Geographers
2.1% 1 1 $79,040
17-2111 Health and Safety Engineers, Except Mining Safety
Engineers
and Inspectors 2.1% 1 1 $81,224
19-2043 Hydrologists 1.9% 0 1 $59,384
17-2112 Industrial Engineers 0.6% 3 14 $88,046
19-2032 Materials Scientists 0.8% 1 3 $89,003
17-2141 Mechanical Engineers 1.4% 8 18 $80,579
Occupation & Industry Projections 33
Occupation Projections by Career Cluster
SOC
Code Title of Occupation
Average
Annual
Growth
Rate
Average
Annual
Openings
due to
Growth
Average
Annual
Openings
due to
Replacements
2010 Average
Annual Wages
19-1022 Microbiologists 0.8% 1 2 $61,672
15-2031 Operations Research Analysts 0.8% 2 7 $68,661
19-2012 Physicists 1.8% 0 1 $82,118
19-4061 Social Science Research Assistants 1.1% 1 4 $33,238
43-9111 Statistical Assistants 0.9% 0 0 $45,802
15-2041 Statisticians 0.1% 0 5 $82,909
17-3031 Surveying and Mapping Technicians 0.8% 1 2 $41,579
43-5111 Weighers, Measurers, Checkers, and Samplers,
Recordkeeping 1.3% 2 7 $28,226
Transportation, Distribution and Logistics
49-3011 Aircraft Mechanics and Service Technicians 0.2% 1 9
$58,469
53-3011 Ambulance Drivers and Attendants, Except Emergency
Medical Technicians 2.3% 3 2 $24,648
49-3021 Automotive Body and Related Repairers 0.7% 2 8
$40,872
49-3023 Automotive Service Technicians and Mechanics 0.9%
20 58 $39,936
49-3031 Bus and Truck Mechanics and Diesel Engine
Specialists 1.1% 6 10 $44,346
53-3022 Bus Drivers, School 1.2% 22 32 $26,437
53-3021 Bus Drivers, Transit and Intercity 0.6% 1 3 $28,330
53-5021 Captains, Mates, and Pilots of Water Vessels 1.2% 0 1
$81,536
43-5011 Cargo and Freight Agents 1.5% 0 1 $43,618
53-2012 Commercial Pilots 3.1% 3 4 $83,465
53-7011 Conveyor Operators and Tenders 1.4% 0 0 $33,904
43-5032 Dispatchers, Except Police, Fire, and Ambulance 2.8%
27 16 $43,014
49-2096 Electronic Equipment Installers and Repairers, Motor
Vehicles -0.3% 0 1 $30,472
53-1021 First-Line Supervisors/Managers of Helpers, Laborers,
and
Material Movers, Hand 2.0% 11 10 $48,651
53-1031 First-Line Supervisors/Managers of Transportation and
Material-
Moving Machine and Vehicle Operators 1.0% 6 11 $55,661
53-7051 Industrial Truck and Tractor Operators 0.9% 10 28
$30,493
53-7062 Laborers and Freight, Stock, and Material Movers,
Hand 1.1% 66 175 $25,688
13-1081 Logisticians 1.9% 10 9 $78,520
49-3042 Mobile Heavy Equipment Mechanics, Except Engines
1.5% 8 13 $44,262
53-3099 Motor Vehicle Operators, All Other 0.8% 4 8 $29,058
49-3051 Motorboat Mechanics 1.5% 1 2 $35,797
49-3053 Outdoor Power Equipment and Other Small Engine
Mechanics 1.5% 2 2 $37,170
51-9111 Packaging and Filling Machine Operators and Tenders
0.7% 9 21 $31,533
53-7064 Packers and Packagers, Hand 0.7% 12 46 $26,437
43-5051 Postal Service Clerks -4.7% 0 5 $52,499
43-5052 Postal Service Mail Carriers 0.5% 6 32 $49,483
34 Delaware 2020
Occupation Projections by Career Cluster
SOC
Code Title of Occupation
Average
Annual
Growth
Rate
Average
Annual
Openings
due to
Growth
Average
Annual
Openings
due to
Replacements
2010 Average
Annual Wages
43-5053 Postal Service Mail Sorters, Processors, and Processing
Machine Operators -4.7% 0 2 $49,982
11-9131 Postmasters and Mail Superintendents -1.3% 0 1
$70,262
43-5061 Production, Planning, and Expediting Clerks 0.6% 5 19
$47,320
53-7081 Refuse and Recyclable Material Collectors 2.2% 12 15
$34,632
53-5011 Sailors and Marine Oilers 1.0% 0 1 $32,781
43-5071 Shipping, Receiving, and Traffic Clerks -0.2% 0 42
$30,098
53-7121 Tank Car, Truck, and Ship Loaders 0.0% 0 13 $56,888
53-3041 Taxi Drivers and Chauffeurs 1.2% 8 8 $27,872
49-3093 Tire Repairers and Changers 1.0% 2 6 $24,627
53-6051 Transportation Inspectors 1.5% 2 3 $38,792
53-6099 Transportation Workers, All Other 2.1% 1 1 $25,979
11-3071 Transportation, Storage, and Distribution Managers
0.0% 0 9 $119,662
53-3032 Truck Drivers, Heavy and Tractor-Trailer 1.7% 70 75
$41,163
53-3033 Truck Drivers, Light or Delivery Services 0.7% 18 52
$35,256
Occupation & Industry Projections 35
Industry Projections
Besides projected demographic
trends, the biggest determinant of
employment growth rates is the
position of the base year in the
business cycle. The projection year in
long-term projections is so far into
the future that it must be assumed the
economy will be at full employment
then, but we always have more
information about the base year.
This is the primary reason for the
increase in projected growth rates in
this set of projections, as compared
to the 2008-2018 projections. In
2008, average annual employment
was near a business cycle peak
(large job losses did not begin until
the end of 2008). The 0.7 percent
average annual growth rate projected
through 2018, relatively low by recent
standards, reflected that fact, along
with a projected decline in the rate
of population growth. For this set
of projections, the projections of
working-age population growth are
similar, but the base year of 2010
found employment at a cyclical low.
The 1.1 percent projected annual
growth in employment through
2020 reflects an expected cyclical
boost in job growth, with a period of
above-normal job growth sometime
during the recovery. At the present
time (May 2012), that has not yet
happened. If it turns out that all of
the jobs lost during the recession
were structural, and no period of
above-normal growth is forthcoming,
then the average annual job growth
through the projection period will
probably be closer to 0.7 percent.
This business cycle effect is even more
pronounced in particular industries.
Construction, which is projected to
grow faster than any other major
industry sector, is a prime example.
There are 5,510 net new jobs
projected in Construction through
2020, an annual average growth rate
of 2.5%, more than double the overall
projected average gain. If this many
jobs are added, it would still leave
the number of jobs in Construction
4,500 below the peak hit in 2006.
The projected growth comes from
an expected return to more normal
job numbers. In 2002, prior to the
building boom, Construction jobs
made up 5.4 percent of the total jobs
in the state. By 2006, that had risen to
6.4 percent. In our current base year
of 2010, Construction has only 4.5
percent of the state’s total jobs; our
projection is for that to
rise to 5.2 percent
by 2020.
By contrast, the
business cycle appears
to have little effect
on Health Care and
Social Assistance
(particularly the health
care components),
currently Delaware’s
largest industry by
employment, and
the industry with the
greatest projected
number of new jobs,
by far. Over 13,000 net
new jobs are projected
for this industry by
2020; better than
one in every four
new jobs in the state
are projected to be
in Health Care and
Social Assistance. This
industry has exhibited
steady growth for
over 20 years, and as the baby boom
generation increases its demands on
the health care system, continued
employment growth in Health Care
and Social Assistance is as safe a bet as
there is in these projections.
Construction is projected to
grow faster than any other major
industry between 2010 and 2020.
Industry Sector Net Job Growth
Health Care and Social Assistance 13,140
Construction 5,510
Retail Trade 4,460
Administrative and Waste Services 3,990
Accommodation and Food Services 3,350
Professional and Technical Services 3,120
Educational Services 2,720
Self-Employed Workers, Primary Job 2,400
Other Services, except Public Administration 2,150
Wholesale Trade 2,000
Transportation and Warehousing 1,370
Manufacturing 1,170
Government 1,120
Arts, Entertainment, and Recreation 1,110
Finance and Insurance 1,030
Information 800
Real Estate and Rental And Leasing 660
Mining 0
Agriculture, Forestry, and Fishing -20
Utilities -70
Management of Companies and Enterprises -1,620
Projected Net Job Growth by
Industry Sector, 2020
36 Delaware 2020
Industry Projections
Retail Trade, Delaware’s second-
largest major industry sector in
terms of employment, is projected
to grow at a slightly slower rate than
the overall economy. Some of the
sub-sectors, such as furniture and
home furnishing stores and building
materials and garden supply stores,
are projected to grow faster, due to
business cycle effects. Health and
personal care stores are projected to
grow at an above-average pace due
primarily to demographic factors.
Finance and Insurance is Delaware’s
third-largest employer and
largest generator of value-added,
contributing 37 percent of the
state’s GDP in 2010. We project
that employment will grow by about
1,000 jobs by 2020, a rate of growth
only about one-quarter that of the
overall economy. Projected job losses
at banks (Credit intermediation and
related activities) largely offset the
gains projected for securities and
investment firms and in insurance.
Although small in magnitude,
the projected job growth in
Manufacturing is a major change
in this round of projections. Except
for a brief period in the late 1990’s,
jobs in Manufacturing in Delaware
have been steadily declining for over
20 years. That appears to finally be
Construction
Health Care and Social Assistance
Administrative and Waste Services
Wholesale Trade
Information
Professional and Technical Services
Arts, Entertainment, and Recreation
Real Estate and Rental and Leasing
Transportation and Warehousing
Other Services, except Public Administration
Accommodation and Food Services
Retail Trade
Educational Services
Manufacturing
Government
Finance and Insurance
Agriculture, Forestry, and Fishing
Utilities
Management of Companies and Enterprises
Projected Annual Rate of Growth by Industry Sector, 2010–
2020
-2.0% -1.5% -1.0% -0.5% 0.0% 0.5% 1.0% 1.5% 2.0% 2.5%
3.0%
reversing, and we project a modest
increase of nearly 1,200 jobs in
Manufacturing by 2020.
The biggest job losses projected
in any major industry sector are
in Management of Companies and
Enterprises, where 1,620 fewer jobs
are expected by 2020. This industry
consists of holding companies and
establishments whose main purpose
is to manage their firm’s overall
operations. In Delaware, it contains
a few large employers and many
holding companies with generally a
single employee. The reliance on just
a few major employers causes this
sector’s employment to be volatile, as
those firms’ fortunes wax and wane.
37Occupation & Industry Projections
NAICS Industry 2010 2020
2010–2020
Change
2010–2020
Annual
Growth
Table 3: Industry Projections
Total Employment, All Jobs 431,670 480,120 48,450 1.1%
Total Self-Employed and Unpaid Family Workers,
Primary Job 19,840 22,300 2,460 1.2%
Self-Employed Workers, Primary Job 19,600 22,000 2,400 1.2%
Unpaid Family Workers, Primary Job 240 300 60 2.3%
11 Agriculture, Forestry, Fishing 4,220 4,200 -20 -0.0%
111 Crop production 2,460 2,400 -60 -0.2%
112 Animal production 1,590 1,600 10 0.1%
115 Support activities for agriculture and forestry 170 200 30
1.6%
21 Mining 0 0
22 Utilities 2,090 2,020 -70 -0.3%
23 Construction 19,290 24,800 5,510 2.5%
236 Construction of buildings 4,810 6,700 1,890 3.4%
237 Heavy and civil engineering construction 2,580 3,100 520
1.9%
238 Specialty trade contractors 11,900 15,000 3,100 2.3%
31–33 Manufacturing 26,140 27,310 1,170 0.4%
311 Food manufacturing 8,840 9,000 160 0.2%
312 Beverage and tobacco product manufacturing 200 300 100
4.1%
313 Textile mills 600 550 -50 -0.9%
314 Textile product mills 100 80 -20 -2.2%
315 Apparel manufacturing 170 150 -20 -1.2%
321 Wood product manufacturing 310 280 -30 -1.0%
322 Paper manufacturing 860 740 -120 -1.5%
323 Printing and related support activities 670 600 -70 -1.1%
324 Petroleum and coal products manufacturing 290 700 410
9.2%
325 Chemical manufacturing 3,280 3,000 -280 -0.9%
326 Plastics and rubber products manufacturing 1,390 1,250 -
140 -1.1%
327 Nonmetallic mineral product manufacturing 630 750 120
1.8%
331 Primary metal manufacturing 560 530 -30 -0.5%
332 Fabricated metal product manufacturing 1,450 1,500 50
0.3%
333 Machinery manufacturing 590 700 110 1.7%
334 Computer and electronic product manufacturing 3,020
3,300 280 0.9%
335 Electrical equipment and appliance mfg. 630 1,000 370
4.7%
336 Transportation equipment manufacturing 740 1,200 460
5.0%
337 Furniture and related product manufacturing 760 680 -80 -
1.1%
339 Miscellaneous manufacturing 1,050 1,000 -50 -0.5%
Delaware 2020
NAICS Industry 2010 2020
2010–2020
Change
2010–2020
Annual
Growth
Industry Projections
38
42 Wholesale Trade 12,500 14,500 2,000 1.5%
423 Merchant wholesalers, durable goods 4,500 5,200 700 1.5%
424 Merchant wholesalers, nondurable goods 5,500 6,000 500
0.9%
425 Electronic markets and agents and brokers 2,500 3,300 800
2.8%
44-45 Retail Trade 49,890 54,350 4,460 0.9%
441 Motor vehicle and parts dealers 6,270 7,000 730 1.1%
Occupation & Industry ProjectionsOffice of Occupational .docx

More Related Content

Similar to Occupation & Industry ProjectionsOffice of Occupational .docx

Research Brief_Middle Skills_reduced size PDF
Research Brief_Middle Skills_reduced size PDFResearch Brief_Middle Skills_reduced size PDF
Research Brief_Middle Skills_reduced size PDFColby Spencer Cesaro
 
Salary survey c level-2021
Salary survey c level-2021Salary survey c level-2021
Salary survey c level-2021Kristina Florya
 
Hays Global Skills Index 2012
Hays Global Skills Index 2012Hays Global Skills Index 2012
Hays Global Skills Index 2012Hays
 
2010 PLS Career Summit: Eric Winegardner, VP of Client Adoptions, Monster.com
2010 PLS Career Summit: Eric Winegardner, VP of Client Adoptions, Monster.com2010 PLS Career Summit: Eric Winegardner, VP of Client Adoptions, Monster.com
2010 PLS Career Summit: Eric Winegardner, VP of Client Adoptions, Monster.comPearson North America
 
Cost benefit analysis
Cost benefit analysisCost benefit analysis
Cost benefit analysisYeonKyung Lee
 
DCR Trendline May 2015
DCR Trendline May 2015DCR Trendline May 2015
DCR Trendline May 2015ss
 
Econimicdownturnee Persp
Econimicdownturnee PerspEconimicdownturnee Persp
Econimicdownturnee Perspshrm
 
2012 Employer Health Benefits Chart Pack
2012 Employer Health Benefits Chart Pack2012 Employer Health Benefits Chart Pack
2012 Employer Health Benefits Chart PackKFF
 
DCR TrendLine February 2015 - Non Employee Workforce Insight
DCR TrendLine February 2015 - Non Employee Workforce InsightDCR TrendLine February 2015 - Non Employee Workforce Insight
DCR TrendLine February 2015 - Non Employee Workforce Insightss
 
DCR Trendline October 2014 - Non Employee Workforce Insight
DCR Trendline October 2014 - Non Employee Workforce InsightDCR Trendline October 2014 - Non Employee Workforce Insight
DCR Trendline October 2014 - Non Employee Workforce Insightss
 
HR-Salary_Guide_2015_Digital
HR-Salary_Guide_2015_DigitalHR-Salary_Guide_2015_Digital
HR-Salary_Guide_2015_DigitalLindsay Schultz
 
Education and Workforce Development in the Early 21st Century
Education and Workforce Development in the Early 21st CenturyEducation and Workforce Development in the Early 21st Century
Education and Workforce Development in the Early 21st Centuryheldrichcenter
 
Employment guide for students and jobseekers
Employment guide for students and jobseekersEmployment guide for students and jobseekers
Employment guide for students and jobseekersPoL Sangalang
 
Creating Jobs In Ghana UKFIET OXCON 2009 (education, skills, jobs, developmen...
Creating Jobs In Ghana UKFIET OXCON 2009 (education, skills, jobs, developmen...Creating Jobs In Ghana UKFIET OXCON 2009 (education, skills, jobs, developmen...
Creating Jobs In Ghana UKFIET OXCON 2009 (education, skills, jobs, developmen...RECOUP
 

Similar to Occupation & Industry ProjectionsOffice of Occupational .docx (20)

Local Insights - Statewide, Winter 2014
Local Insights - Statewide, Winter 2014Local Insights - Statewide, Winter 2014
Local Insights - Statewide, Winter 2014
 
Research Brief_Middle Skills_reduced size PDF
Research Brief_Middle Skills_reduced size PDFResearch Brief_Middle Skills_reduced size PDF
Research Brief_Middle Skills_reduced size PDF
 
2015usualweekly$CPS
2015usualweekly$CPS2015usualweekly$CPS
2015usualweekly$CPS
 
Salary survey c level-2021
Salary survey c level-2021Salary survey c level-2021
Salary survey c level-2021
 
Hays Global Skills Index 2012
Hays Global Skills Index 2012Hays Global Skills Index 2012
Hays Global Skills Index 2012
 
2010 PLS Career Summit: Eric Winegardner, VP of Client Adoptions, Monster.com
2010 PLS Career Summit: Eric Winegardner, VP of Client Adoptions, Monster.com2010 PLS Career Summit: Eric Winegardner, VP of Client Adoptions, Monster.com
2010 PLS Career Summit: Eric Winegardner, VP of Client Adoptions, Monster.com
 
Cost benefit analysis
Cost benefit analysisCost benefit analysis
Cost benefit analysis
 
Pay trends 2015
Pay trends 2015Pay trends 2015
Pay trends 2015
 
DCR Trendline May 2015
DCR Trendline May 2015DCR Trendline May 2015
DCR Trendline May 2015
 
Econimicdownturnee Persp
Econimicdownturnee PerspEconimicdownturnee Persp
Econimicdownturnee Persp
 
2012 Employer Health Benefits Chart Pack
2012 Employer Health Benefits Chart Pack2012 Employer Health Benefits Chart Pack
2012 Employer Health Benefits Chart Pack
 
DCR TrendLine February 2015 - Non Employee Workforce Insight
DCR TrendLine February 2015 - Non Employee Workforce InsightDCR TrendLine February 2015 - Non Employee Workforce Insight
DCR TrendLine February 2015 - Non Employee Workforce Insight
 
DCR Trendline October 2014 - Non Employee Workforce Insight
DCR Trendline October 2014 - Non Employee Workforce InsightDCR Trendline October 2014 - Non Employee Workforce Insight
DCR Trendline October 2014 - Non Employee Workforce Insight
 
API_SG17
API_SG17API_SG17
API_SG17
 
19
1919
19
 
19
1919
19
 
HR-Salary_Guide_2015_Digital
HR-Salary_Guide_2015_DigitalHR-Salary_Guide_2015_Digital
HR-Salary_Guide_2015_Digital
 
Education and Workforce Development in the Early 21st Century
Education and Workforce Development in the Early 21st CenturyEducation and Workforce Development in the Early 21st Century
Education and Workforce Development in the Early 21st Century
 
Employment guide for students and jobseekers
Employment guide for students and jobseekersEmployment guide for students and jobseekers
Employment guide for students and jobseekers
 
Creating Jobs In Ghana UKFIET OXCON 2009 (education, skills, jobs, developmen...
Creating Jobs In Ghana UKFIET OXCON 2009 (education, skills, jobs, developmen...Creating Jobs In Ghana UKFIET OXCON 2009 (education, skills, jobs, developmen...
Creating Jobs In Ghana UKFIET OXCON 2009 (education, skills, jobs, developmen...
 

More from hopeaustin33688

This modules animation What Is Communication provides background .docx
This modules animation What Is Communication provides background .docxThis modules animation What Is Communication provides background .docx
This modules animation What Is Communication provides background .docxhopeaustin33688
 
▪Nursing Theory PowerPoint Presentation.This is a group project .docx
▪Nursing Theory PowerPoint Presentation.This is a group project .docx▪Nursing Theory PowerPoint Presentation.This is a group project .docx
▪Nursing Theory PowerPoint Presentation.This is a group project .docxhopeaustin33688
 
••You are required to write a story; explaining and analyzing .docx
••You are required to write a story; explaining and analyzing .docx••You are required to write a story; explaining and analyzing .docx
••You are required to write a story; explaining and analyzing .docxhopeaustin33688
 
•Required to read American Mashup A Popular Culture Reader. Ed. A.docx
•Required to read American Mashup A Popular Culture Reader. Ed. A.docx•Required to read American Mashup A Popular Culture Reader. Ed. A.docx
•Required to read American Mashup A Popular Culture Reader. Ed. A.docxhopeaustin33688
 
• ntercultural Activity Presentation Final SubmissionResourc.docx
• ntercultural Activity Presentation Final SubmissionResourc.docx• ntercultural Activity Presentation Final SubmissionResourc.docx
• ntercultural Activity Presentation Final SubmissionResourc.docxhopeaustin33688
 
•Read Chapter 15 from your textbookEthical Controversy Ident.docx
•Read Chapter 15 from your textbookEthical Controversy Ident.docx•Read Chapter 15 from your textbookEthical Controversy Ident.docx
•Read Chapter 15 from your textbookEthical Controversy Ident.docxhopeaustin33688
 
·    ResearchWorks Cited Page (minimum of 5 reputable resources.docx
·    ResearchWorks Cited Page (minimum of 5 reputable resources.docx·    ResearchWorks Cited Page (minimum of 5 reputable resources.docx
·    ResearchWorks Cited Page (minimum of 5 reputable resources.docxhopeaustin33688
 
‘The Other Side of Immigration’ Questions1. What does one spea.docx
‘The Other Side of Immigration’ Questions1. What does one spea.docx‘The Other Side of Immigration’ Questions1. What does one spea.docx
‘The Other Side of Immigration’ Questions1. What does one spea.docxhopeaustin33688
 
•Topic What is an ethical leader and how do ethical leaders differ .docx
•Topic What is an ethical leader and how do ethical leaders differ .docx•Topic What is an ethical leader and how do ethical leaders differ .docx
•Topic What is an ethical leader and how do ethical leaders differ .docxhopeaustin33688
 
·Term Paper International TerrorismDue Week 10 and worth .docx
·Term Paper International TerrorismDue Week 10 and worth .docx·Term Paper International TerrorismDue Week 10 and worth .docx
·Term Paper International TerrorismDue Week 10 and worth .docxhopeaustin33688
 
•Prepare a 4-5 page draft Code of Ethics paper sharing the following.docx
•Prepare a 4-5 page draft Code of Ethics paper sharing the following.docx•Prepare a 4-5 page draft Code of Ethics paper sharing the following.docx
•Prepare a 4-5 page draft Code of Ethics paper sharing the following.docxhopeaustin33688
 
·Sketch the context for, define, and tell the significanceafter.docx
·Sketch the context for, define, and tell the significanceafter.docx·Sketch the context for, define, and tell the significanceafter.docx
·Sketch the context for, define, and tell the significanceafter.docxhopeaustin33688
 
• Each thread is 650 words• Each thread and reply references at le.docx
• Each thread is 650 words• Each thread and reply references at le.docx• Each thread is 650 words• Each thread and reply references at le.docx
• Each thread is 650 words• Each thread and reply references at le.docxhopeaustin33688
 
ØFind a Food borne epidemicIllness that occurred in the U.S. in.docx
ØFind a Food borne epidemicIllness that occurred in the U.S. in.docxØFind a Food borne epidemicIllness that occurred in the U.S. in.docx
ØFind a Food borne epidemicIllness that occurred in the U.S. in.docxhopeaustin33688
 
Organizational BehaviorDisney Animation - John LasseterThe case focu.docx
Organizational BehaviorDisney Animation - John LasseterThe case focu.docxOrganizational BehaviorDisney Animation - John LasseterThe case focu.docx
Organizational BehaviorDisney Animation - John LasseterThe case focu.docxhopeaustin33688
 
Organizational Behavior15th EdPersonality and ValuesCopy.docx
Organizational Behavior15th EdPersonality and ValuesCopy.docxOrganizational Behavior15th EdPersonality and ValuesCopy.docx
Organizational Behavior15th EdPersonality and ValuesCopy.docxhopeaustin33688
 
Organizational Behavior Case Study on LeadershipName Tan Yee .docx
Organizational Behavior Case Study on LeadershipName Tan Yee .docxOrganizational Behavior Case Study on LeadershipName Tan Yee .docx
Organizational Behavior Case Study on LeadershipName Tan Yee .docxhopeaustin33688
 
ORGANIZATIONAL ASSESSMENT WORKSHEETOrganizational ProfileT.docx
ORGANIZATIONAL ASSESSMENT WORKSHEETOrganizational ProfileT.docxORGANIZATIONAL ASSESSMENT WORKSHEETOrganizational ProfileT.docx
ORGANIZATIONAL ASSESSMENT WORKSHEETOrganizational ProfileT.docxhopeaustin33688
 
Organisations and LeadershipOrganisational BehaviourDeve.docx
Organisations and LeadershipOrganisational BehaviourDeve.docxOrganisations and LeadershipOrganisational BehaviourDeve.docx
Organisations and LeadershipOrganisational BehaviourDeve.docxhopeaustin33688
 
Organizational Behavior15th EdEmotions and MoodsCopyrigh.docx
Organizational Behavior15th EdEmotions and MoodsCopyrigh.docxOrganizational Behavior15th EdEmotions and MoodsCopyrigh.docx
Organizational Behavior15th EdEmotions and MoodsCopyrigh.docxhopeaustin33688
 

More from hopeaustin33688 (20)

This modules animation What Is Communication provides background .docx
This modules animation What Is Communication provides background .docxThis modules animation What Is Communication provides background .docx
This modules animation What Is Communication provides background .docx
 
▪Nursing Theory PowerPoint Presentation.This is a group project .docx
▪Nursing Theory PowerPoint Presentation.This is a group project .docx▪Nursing Theory PowerPoint Presentation.This is a group project .docx
▪Nursing Theory PowerPoint Presentation.This is a group project .docx
 
••You are required to write a story; explaining and analyzing .docx
••You are required to write a story; explaining and analyzing .docx••You are required to write a story; explaining and analyzing .docx
••You are required to write a story; explaining and analyzing .docx
 
•Required to read American Mashup A Popular Culture Reader. Ed. A.docx
•Required to read American Mashup A Popular Culture Reader. Ed. A.docx•Required to read American Mashup A Popular Culture Reader. Ed. A.docx
•Required to read American Mashup A Popular Culture Reader. Ed. A.docx
 
• ntercultural Activity Presentation Final SubmissionResourc.docx
• ntercultural Activity Presentation Final SubmissionResourc.docx• ntercultural Activity Presentation Final SubmissionResourc.docx
• ntercultural Activity Presentation Final SubmissionResourc.docx
 
•Read Chapter 15 from your textbookEthical Controversy Ident.docx
•Read Chapter 15 from your textbookEthical Controversy Ident.docx•Read Chapter 15 from your textbookEthical Controversy Ident.docx
•Read Chapter 15 from your textbookEthical Controversy Ident.docx
 
·    ResearchWorks Cited Page (minimum of 5 reputable resources.docx
·    ResearchWorks Cited Page (minimum of 5 reputable resources.docx·    ResearchWorks Cited Page (minimum of 5 reputable resources.docx
·    ResearchWorks Cited Page (minimum of 5 reputable resources.docx
 
‘The Other Side of Immigration’ Questions1. What does one spea.docx
‘The Other Side of Immigration’ Questions1. What does one spea.docx‘The Other Side of Immigration’ Questions1. What does one spea.docx
‘The Other Side of Immigration’ Questions1. What does one spea.docx
 
•Topic What is an ethical leader and how do ethical leaders differ .docx
•Topic What is an ethical leader and how do ethical leaders differ .docx•Topic What is an ethical leader and how do ethical leaders differ .docx
•Topic What is an ethical leader and how do ethical leaders differ .docx
 
·Term Paper International TerrorismDue Week 10 and worth .docx
·Term Paper International TerrorismDue Week 10 and worth .docx·Term Paper International TerrorismDue Week 10 and worth .docx
·Term Paper International TerrorismDue Week 10 and worth .docx
 
•Prepare a 4-5 page draft Code of Ethics paper sharing the following.docx
•Prepare a 4-5 page draft Code of Ethics paper sharing the following.docx•Prepare a 4-5 page draft Code of Ethics paper sharing the following.docx
•Prepare a 4-5 page draft Code of Ethics paper sharing the following.docx
 
·Sketch the context for, define, and tell the significanceafter.docx
·Sketch the context for, define, and tell the significanceafter.docx·Sketch the context for, define, and tell the significanceafter.docx
·Sketch the context for, define, and tell the significanceafter.docx
 
• Each thread is 650 words• Each thread and reply references at le.docx
• Each thread is 650 words• Each thread and reply references at le.docx• Each thread is 650 words• Each thread and reply references at le.docx
• Each thread is 650 words• Each thread and reply references at le.docx
 
ØFind a Food borne epidemicIllness that occurred in the U.S. in.docx
ØFind a Food borne epidemicIllness that occurred in the U.S. in.docxØFind a Food borne epidemicIllness that occurred in the U.S. in.docx
ØFind a Food borne epidemicIllness that occurred in the U.S. in.docx
 
Organizational BehaviorDisney Animation - John LasseterThe case focu.docx
Organizational BehaviorDisney Animation - John LasseterThe case focu.docxOrganizational BehaviorDisney Animation - John LasseterThe case focu.docx
Organizational BehaviorDisney Animation - John LasseterThe case focu.docx
 
Organizational Behavior15th EdPersonality and ValuesCopy.docx
Organizational Behavior15th EdPersonality and ValuesCopy.docxOrganizational Behavior15th EdPersonality and ValuesCopy.docx
Organizational Behavior15th EdPersonality and ValuesCopy.docx
 
Organizational Behavior Case Study on LeadershipName Tan Yee .docx
Organizational Behavior Case Study on LeadershipName Tan Yee .docxOrganizational Behavior Case Study on LeadershipName Tan Yee .docx
Organizational Behavior Case Study on LeadershipName Tan Yee .docx
 
ORGANIZATIONAL ASSESSMENT WORKSHEETOrganizational ProfileT.docx
ORGANIZATIONAL ASSESSMENT WORKSHEETOrganizational ProfileT.docxORGANIZATIONAL ASSESSMENT WORKSHEETOrganizational ProfileT.docx
ORGANIZATIONAL ASSESSMENT WORKSHEETOrganizational ProfileT.docx
 
Organisations and LeadershipOrganisational BehaviourDeve.docx
Organisations and LeadershipOrganisational BehaviourDeve.docxOrganisations and LeadershipOrganisational BehaviourDeve.docx
Organisations and LeadershipOrganisational BehaviourDeve.docx
 
Organizational Behavior15th EdEmotions and MoodsCopyrigh.docx
Organizational Behavior15th EdEmotions and MoodsCopyrigh.docxOrganizational Behavior15th EdEmotions and MoodsCopyrigh.docx
Organizational Behavior15th EdEmotions and MoodsCopyrigh.docx
 

Recently uploaded

internship ppt on smartinternz platform as salesforce developer
internship ppt on smartinternz platform as salesforce developerinternship ppt on smartinternz platform as salesforce developer
internship ppt on smartinternz platform as salesforce developerunnathinaik
 
भारत-रोम व्यापार.pptx, Indo-Roman Trade,
भारत-रोम व्यापार.pptx, Indo-Roman Trade,भारत-रोम व्यापार.pptx, Indo-Roman Trade,
भारत-रोम व्यापार.pptx, Indo-Roman Trade,Virag Sontakke
 
POINT- BIOCHEMISTRY SEM 2 ENZYMES UNIT 5.pptx
POINT- BIOCHEMISTRY SEM 2 ENZYMES UNIT 5.pptxPOINT- BIOCHEMISTRY SEM 2 ENZYMES UNIT 5.pptx
POINT- BIOCHEMISTRY SEM 2 ENZYMES UNIT 5.pptxSayali Powar
 
Roles & Responsibilities in Pharmacovigilance
Roles & Responsibilities in PharmacovigilanceRoles & Responsibilities in Pharmacovigilance
Roles & Responsibilities in PharmacovigilanceSamikshaHamane
 
Full Stack Web Development Course for Beginners
Full Stack Web Development Course  for BeginnersFull Stack Web Development Course  for Beginners
Full Stack Web Development Course for BeginnersSabitha Banu
 
Types of Journalistic Writing Grade 8.pptx
Types of Journalistic Writing Grade 8.pptxTypes of Journalistic Writing Grade 8.pptx
Types of Journalistic Writing Grade 8.pptxEyham Joco
 
KSHARA STURA .pptx---KSHARA KARMA THERAPY (CAUSTIC THERAPY)————IMP.OF KSHARA ...
KSHARA STURA .pptx---KSHARA KARMA THERAPY (CAUSTIC THERAPY)————IMP.OF KSHARA ...KSHARA STURA .pptx---KSHARA KARMA THERAPY (CAUSTIC THERAPY)————IMP.OF KSHARA ...
KSHARA STURA .pptx---KSHARA KARMA THERAPY (CAUSTIC THERAPY)————IMP.OF KSHARA ...M56BOOKSTORE PRODUCT/SERVICE
 
Alper Gobel In Media Res Media Component
Alper Gobel In Media Res Media ComponentAlper Gobel In Media Res Media Component
Alper Gobel In Media Res Media ComponentInMediaRes1
 
Biting mechanism of poisonous snakes.pdf
Biting mechanism of poisonous snakes.pdfBiting mechanism of poisonous snakes.pdf
Biting mechanism of poisonous snakes.pdfadityarao40181
 
Presiding Officer Training module 2024 lok sabha elections
Presiding Officer Training module 2024 lok sabha electionsPresiding Officer Training module 2024 lok sabha elections
Presiding Officer Training module 2024 lok sabha electionsanshu789521
 
History Class XII Ch. 3 Kinship, Caste and Class (1).pptx
History Class XII Ch. 3 Kinship, Caste and Class (1).pptxHistory Class XII Ch. 3 Kinship, Caste and Class (1).pptx
History Class XII Ch. 3 Kinship, Caste and Class (1).pptxsocialsciencegdgrohi
 
Capitol Tech U Doctoral Presentation - April 2024.pptx
Capitol Tech U Doctoral Presentation - April 2024.pptxCapitol Tech U Doctoral Presentation - April 2024.pptx
Capitol Tech U Doctoral Presentation - April 2024.pptxCapitolTechU
 
Computed Fields and api Depends in the Odoo 17
Computed Fields and api Depends in the Odoo 17Computed Fields and api Depends in the Odoo 17
Computed Fields and api Depends in the Odoo 17Celine George
 
Incoming and Outgoing Shipments in 1 STEP Using Odoo 17
Incoming and Outgoing Shipments in 1 STEP Using Odoo 17Incoming and Outgoing Shipments in 1 STEP Using Odoo 17
Incoming and Outgoing Shipments in 1 STEP Using Odoo 17Celine George
 
Software Engineering Methodologies (overview)
Software Engineering Methodologies (overview)Software Engineering Methodologies (overview)
Software Engineering Methodologies (overview)eniolaolutunde
 
Introduction to ArtificiaI Intelligence in Higher Education
Introduction to ArtificiaI Intelligence in Higher EducationIntroduction to ArtificiaI Intelligence in Higher Education
Introduction to ArtificiaI Intelligence in Higher Educationpboyjonauth
 

Recently uploaded (20)

internship ppt on smartinternz platform as salesforce developer
internship ppt on smartinternz platform as salesforce developerinternship ppt on smartinternz platform as salesforce developer
internship ppt on smartinternz platform as salesforce developer
 
भारत-रोम व्यापार.pptx, Indo-Roman Trade,
भारत-रोम व्यापार.pptx, Indo-Roman Trade,भारत-रोम व्यापार.pptx, Indo-Roman Trade,
भारत-रोम व्यापार.pptx, Indo-Roman Trade,
 
POINT- BIOCHEMISTRY SEM 2 ENZYMES UNIT 5.pptx
POINT- BIOCHEMISTRY SEM 2 ENZYMES UNIT 5.pptxPOINT- BIOCHEMISTRY SEM 2 ENZYMES UNIT 5.pptx
POINT- BIOCHEMISTRY SEM 2 ENZYMES UNIT 5.pptx
 
TataKelola dan KamSiber Kecerdasan Buatan v022.pdf
TataKelola dan KamSiber Kecerdasan Buatan v022.pdfTataKelola dan KamSiber Kecerdasan Buatan v022.pdf
TataKelola dan KamSiber Kecerdasan Buatan v022.pdf
 
Roles & Responsibilities in Pharmacovigilance
Roles & Responsibilities in PharmacovigilanceRoles & Responsibilities in Pharmacovigilance
Roles & Responsibilities in Pharmacovigilance
 
Full Stack Web Development Course for Beginners
Full Stack Web Development Course  for BeginnersFull Stack Web Development Course  for Beginners
Full Stack Web Development Course for Beginners
 
Types of Journalistic Writing Grade 8.pptx
Types of Journalistic Writing Grade 8.pptxTypes of Journalistic Writing Grade 8.pptx
Types of Journalistic Writing Grade 8.pptx
 
KSHARA STURA .pptx---KSHARA KARMA THERAPY (CAUSTIC THERAPY)————IMP.OF KSHARA ...
KSHARA STURA .pptx---KSHARA KARMA THERAPY (CAUSTIC THERAPY)————IMP.OF KSHARA ...KSHARA STURA .pptx---KSHARA KARMA THERAPY (CAUSTIC THERAPY)————IMP.OF KSHARA ...
KSHARA STURA .pptx---KSHARA KARMA THERAPY (CAUSTIC THERAPY)————IMP.OF KSHARA ...
 
Alper Gobel In Media Res Media Component
Alper Gobel In Media Res Media ComponentAlper Gobel In Media Res Media Component
Alper Gobel In Media Res Media Component
 
Biting mechanism of poisonous snakes.pdf
Biting mechanism of poisonous snakes.pdfBiting mechanism of poisonous snakes.pdf
Biting mechanism of poisonous snakes.pdf
 
Presiding Officer Training module 2024 lok sabha elections
Presiding Officer Training module 2024 lok sabha electionsPresiding Officer Training module 2024 lok sabha elections
Presiding Officer Training module 2024 lok sabha elections
 
History Class XII Ch. 3 Kinship, Caste and Class (1).pptx
History Class XII Ch. 3 Kinship, Caste and Class (1).pptxHistory Class XII Ch. 3 Kinship, Caste and Class (1).pptx
History Class XII Ch. 3 Kinship, Caste and Class (1).pptx
 
Capitol Tech U Doctoral Presentation - April 2024.pptx
Capitol Tech U Doctoral Presentation - April 2024.pptxCapitol Tech U Doctoral Presentation - April 2024.pptx
Capitol Tech U Doctoral Presentation - April 2024.pptx
 
OS-operating systems- ch04 (Threads) ...
OS-operating systems- ch04 (Threads) ...OS-operating systems- ch04 (Threads) ...
OS-operating systems- ch04 (Threads) ...
 
Computed Fields and api Depends in the Odoo 17
Computed Fields and api Depends in the Odoo 17Computed Fields and api Depends in the Odoo 17
Computed Fields and api Depends in the Odoo 17
 
Incoming and Outgoing Shipments in 1 STEP Using Odoo 17
Incoming and Outgoing Shipments in 1 STEP Using Odoo 17Incoming and Outgoing Shipments in 1 STEP Using Odoo 17
Incoming and Outgoing Shipments in 1 STEP Using Odoo 17
 
Software Engineering Methodologies (overview)
Software Engineering Methodologies (overview)Software Engineering Methodologies (overview)
Software Engineering Methodologies (overview)
 
9953330565 Low Rate Call Girls In Rohini Delhi NCR
9953330565 Low Rate Call Girls In Rohini  Delhi NCR9953330565 Low Rate Call Girls In Rohini  Delhi NCR
9953330565 Low Rate Call Girls In Rohini Delhi NCR
 
Introduction to ArtificiaI Intelligence in Higher Education
Introduction to ArtificiaI Intelligence in Higher EducationIntroduction to ArtificiaI Intelligence in Higher Education
Introduction to ArtificiaI Intelligence in Higher Education
 
Model Call Girl in Tilak Nagar Delhi reach out to us at 🔝9953056974🔝
Model Call Girl in Tilak Nagar Delhi reach out to us at 🔝9953056974🔝Model Call Girl in Tilak Nagar Delhi reach out to us at 🔝9953056974🔝
Model Call Girl in Tilak Nagar Delhi reach out to us at 🔝9953056974🔝
 

Occupation & Industry ProjectionsOffice of Occupational .docx

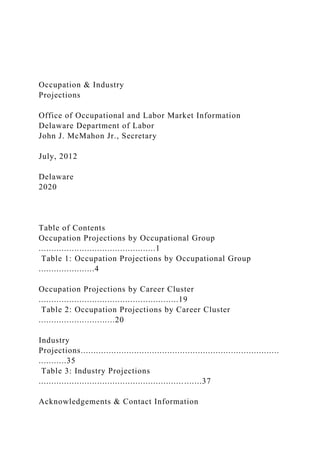
  • 1. Occupation & Industry Projections Office of Occupational and Labor Market Information Delaware Department of Labor John J. McMahon Jr., Secretary July, 2012 Delaware 2020 Table of Contents Occupation Projections by Occupational Group ..............................................1 Table 1: Occupation Projections by Occupational Group ......................4 Occupation Projections by Career Cluster .......................................................19 Table 2: Occupation Projections by Career Cluster ..............................20 Industry Projections.............................................................................. ...........35 Table 3: Industry Projections ................................................................37 Acknowledgements & Contact Information
  • 2. ................................................... 40 Delaware 2020 Introduction Every two years, the federal Bureau of Labor Statistics produces industry and occupation forecasts for a period ten years into the future and the states are asked to do the same for their respective economies. This publication presents Delaware’s efforts for the period 2010 to 2020. It supersedes the last such set of projections, which were generated for the 2008-2018 period and published in October, 2010. Delaware is projected to have 48,450 more jobs in 2020 than in 2010, for an average annual growth rate of 1.07 percent. Health Care and Social Assistance is expected to create far and away the greatest number of jobs, with projected growth of 13,140 jobs. More than one-quarter of the net new jobs in Delaware are projected to come in this industry. Already the state’s biggest industry in terms of employment, it will be even more dominant by 2020. Some of the projected job growth comes from the cyclical nature of the economy. Delaware’s economy hit bottom early in 2010, and the base year of 2010 average annual employment represents the low point of the Great Recession. For the projection year of 2020, the assumption is that the economy will be at full employment (this is the Occupation & Industry Projections only theoretically sound assumption eight years in advance), so the return of many of the jobs lost during the recession is added to the expected growth trend. In other words, most of the projected job growth is due to normally expected
  • 3. population and economic growth, but some is from the expected return of unemployment in the state to more normal levels. Another change in this publication is in the education and training requirements of the occupations. In previous editions, occupations were assigned one of eleven education or training levels, which represented the expected attainment to be considered competent in the field. For this edition, the US Bureau of Labor Statistics (BLS) has separated the single education/training category into three distinct categories for each occupation: typical entry level education, work experience in a related occupation, and typical on-the-job training. To comply with national standards, we have adopted the new BLS categories for use in this publication. It should be noted that while the education category represents the BLS assessment of current typical educational requirements for entry into an occupation, those requirements are subject to change. When they do change, they almost always increase. Occupation & Industry Projections 1 Occupation Projections by Occupational Group Occupations With the Most Annual Openings, 2010–2020 In this section, we present job projections and associated data for 495 specific occupations in Delaware, listed by major occupational group. The data elements provided for each occupation are: the Standard Occupational Classification (SOC)
  • 4. code, an estimate of the total number of filled jobs in the state in 2010, the projection of total filled jobs in 2020, the wage category, job availability, and usual education, experience, and training requirements. In the following section we present these same occupations arranged by the 16 career clusters used by state educators. There you will find the forecasted annual growth rate, annual openings due to growth, annual openings due to net replacement, and the 2010 estimated average annual wage for each occupation. Estimates of past employment levels and projections of future employment levels do not refer to the demand for workers, nor to the supply of workers. They refer to the equilibrium point where the supply and demand for labor are equal, that is, filled jobs. Labor demand and labor supply each have many possible employment levels, depending on the wage level. The wage level adjusts until the supply and demand for any given occupation are the same – that point is the employment estimate or projection for that occupation. Any forecast a decade into the future that predicts shortages or surpluses ignores this fact and is not well grounded in
  • 5. economic theory. Cashiers Retail Salespersons Registered Nurses Waiters and Waitresses Combined Food Preparation/Serving Workers, Inc Fast Food Customer Service Representatives Office Clerks, General Laborers and Freight, Stock, & Material Movers, Hand Janitors and Cleaners, Exc Maids & Housekeeping Cleaners Meat, Poultry, and Fish Cutters and Trimmers Nursing Aides, Orderlies, and Attendants Medical Secretaries First-Line Supers/Mngrs of Office & Admin Support Workers Receptionists and Information Clerks First-Line Supervisors/Managers of Retail Sales Workers Truck Drivers, Heavy & Tractor-Trailer Accountants and Auditors
  • 6. Cooks, Restaurant 0 100 200 300 400 500 600 700 Openings due to growth Openings due to replacements 2 Delaware 2020 Wage Category Abbreviation 2010 Average Annual Wage Low Low Below $29,300 Below Average -Avg. $29,300 to $38,700 Average Avg. $38,701 to $50,080 Above Average +Avg. $50,081 to $66,000 High High Above $66,000 Wage Categories Category Annual Openings Due to Growth Number of Occupations in each Category Poor 0 137 Fair 1 to 3 143 Good 4 to 14 134
  • 7. Excellent (Excl) 15 or more 81 Job Availability Categories For ease of comparison, this first section presents occupational wages by wage categories. To create the categories, we divided the 493 occupations for which we have wage estimates (two agricultural occupations, Animal Breeders and Farmers, are not covered by our wage surveys) into quintiles. There are 98 occupations in the Low and High categories, and 99 occupations in each of the three middle categories. These categories are based on the 2010 average annual wage for each occupation. Of course, it should be recognized that some people working in each occupation were paid less than the average, and some were paid more than the average, and that those just entering an occupation should expect to be paid less than this amount. More detailed wage distributions for each of these occupations, including estimates for entry- and experienced level wages, can be obtained by contacting our office. The lowest-paying 98 occupations (Low) paid below $29,300 per year. The next lowest-paying 99 occupations, those in the Below Average category (-Avg.), had average wages between $29,300 and $38,700 per year. The middle category, Average (Avg.) paid from $38,700 to $50,080. The second highest-paying category, Above Average (+Avg.), had average wages from $50,081 to $66,000, while the 98 highest-paying occupations (High) had average annual wages exceeding $66,000. The placement of occupations into job availability categories is based on the expected annual openings solely due to growth. An occupation with no expected growth would still be expected to generate openings
  • 8. due to replacement of those who leave employment, but overall job availability would still be considered poor compared to occupations with openings due to both growth and replacement. It is through actual expansion of employment within an occupation that potential entrants will find the most opportunity. New Jobs Created by Level of Education, 2010–2020 Bachelor’s Degree or Higher More than High School, Less than Bachelor’s On-the-Job Training 20% 17% 63% The rest of the data refer to education, experience, and training requirements. In the past, one variable was used to describe all three; the current standard is for separate measures for each. There are eight levels of education, which are intended to describe the typical education level of someone entering the occupation. The education categories range from less than high school (<HS), high school diploma or equivalent (HS), postsecondary vocational training (VocEd), associate’s degree (Assoc),
  • 9. bachelor’s degree (Bach), and master’s degree (Mast) through doctoral or professional degree (PhD/prof ). Some occupations typically require experience working in a related field. The work experience measure captures this as one of four possible values: none, less than one year (<1), from one to five years (1-5), and over five years (5+). The on-the-job training field has six possible measures for the There are four categories of job availability: Poor, with no openings due to growth projected; Fair, with from 1 to 3 annual openings due to growth projected; Good, with from 4 to 14 such openings; and Excellent (Excl), with 15 or more annual openings due to growth projected. There are 81 occupations with Excellent job availability, 134 in the Good category, 143 with Fair job availability prospects, and 137 in the Poor category. Occupation & Industry Projections 3 Projected Openings and Growth by Education Level, 2010–2020 Education Total Openings 2010–2020 Percent of Total Openings New Jobs
  • 10. Annual Percent Growth 2011 Unemployment Rate Ph.D./Professional 3,985 2.6% 1,625 1.2% 0.4% Master’s 2,480 1.6% 959 1.4% 3.0% Bachelor’s 24,201 15.7% 7,478 0.9% 4.2% Associate’s 9,515 6.2% 4,741 1.7% 4.6% Some College 899 0.6% 284 1.2% 7.8% Vocational Education 7,244 4.7% 3,608 1.7% Not Available High School Graduate 58,837 38.2% 19,871 1.0% 8.3% Less than HS 46,998 30.5% 12,000 1.0% 12.0% typical amount of training required to be considered competent in the occupation. These range from none, short-term on-the-job training of one month or less (STOJT), moderate- term on-the-job training of from one month to one year (MOJT), long-term on-the-job training of over one year (LTOJT), and apprenticeship (App) through internship or residency (Int). Those interested in further details of the new education, experience, and training requirements should go to: www.bls.gov/emp/ep_education_tech.htm Do cto
  • 11. ra l o r p ro fes sio na l d eg re e Ma ste r’s de gr ee Ba ch elo r’s de gr
  • 13. S ch oo l d ipl om a Le ss th an H igh S ch oo l Wages by Level of Education, 2010 $160,000 $140,000 $120,000 $100,000 $80,000
  • 15. Wage Cat. Job Avail. Educ. Work Exp. Job Training 11-0000 Management Occupations 11-2021 Marketing Managers 950 931 High Poor Bach 1-5 None 11-2022 Sales Managers 691 710 High Fair Bach 1-5 None 11-2031 Public Relations Managers 231 233 High Poor Bach 1- 5 None 11-3011 Administrative Services Managers 776 824 High Good HS 1-5 None 11-3021 Computer and Information Systems Managers 1,598 1,656 High Good Bach 5+ None 11-3031 Financial Managers 2,367 2,382 High Fair Bach 5+ None 11-3051 Industrial Production Managers 379 418 High Good Bach 1-5 None 11-3061 Purchasing Managers 152 151 High Poor Bach 5+ None 11-3071 Transportation, Storage, and Distribution Managers 363 364 High Poor HS 5+ None 11-3111 Compensation and Benefits Managers 163 150 High Poor Bach 1-5 None 11-3121 Human Resources Managers 256 267 High Fair Bach 1- 5 None 11-3131 Training and Development Managers 131 128 High Poor Bach 1-5 None 11-9013 Farmers, Ranchers, and Other Agricultural Managers
  • 16. 2,592 2,425 NA Poor HS 5+ None 11-9021 Construction Managers 1,157 1,469 High Excl Assoc 5+ None 11-9031 Education Administrators, Preschool and Child Care Center/Program 296 332 +Avg Good Bach 1-5 None 11-9032 Education Administrators, Elementary and Secondary School 605 638 High Fair Mast 1-5 None 11-9039 Education Administrators, All Other 45 52 +Avg Fair Bach 1-5 None 11-9041 Engineering Managers 437 454 High Fair Bach 5+ None 11-9051 Food Service Managers 389 463 High Good HS 1-5 None 11-9081 Lodging Managers 135 144 High Fair HS 1-5 None 11-9111 Medical and Health Services Managers 928 1,112 High Excl Bach 0 None 11-9131 Postmasters and Mail Superintendents 48 42 High Poor HS 1-5 MOJT 11-9141 Property, Real Estate, and Community Association Managers 591 642 High Good HS 1-5 None 11-9151 Social and Community Service Managers 718 829 +Avg Good Bach 1-5 None 11-9161 Emergency Management Directors 15 16 +Avg Poor Bach 1-5 LTOJT 11-9199 Managers, All Other 1,159 1,159 High Poor HS 1-5 None 11-1011 Chief Executives 395 424 High Fair Bach 5+ None 11-1021 General and Operations Managers 4,318 4,793 High Excl Assoc 1-5 None 13-0000 Business and Financial Operations Occupations 13-1022 Wholesale and Retail Buyers, Except Farm Products 254 291 Avg Fair HS 0 LTOJT
  • 17. 13-1023 Purchasing Agents, Except Wholesale, Retail, and Farm Products 694 707 High Fair HS 0 LTOJT 13-1031 Claims Adjusters, Examiners, and Investigators 846 906 +Avg Good HS 0 LTOJT 13-1041 Compliance Officers, Except Agriculture, Construction, Health and Safety, and Transportation 1,089 1,256 +Avg Excl Bach 0 MOJT Table 1: Occupation Projections by Occupational Group Occupation & Industry Projections 5 Occupation Projections by Occupational Group SOC Code Title of Occupation 2010 Est. Empl 2020 Proj. Empl. Wage Cat. Job Avail. Educ.
  • 18. Work Exp. Job Training 13-1051 Cost Estimators 720 955 +Avg Excl Bach 0 None 13-1078 Human Resources, Labor Relations, and Training Specialists, All Other 1,564 1,706 +Avg Good Bach 0 None 13-1081 Logisticians 484 585 High Good Bach 1-5 None 13-1111 Management Analysts 2,011 2,177 High Excl Bach 1-5 None 13-1121 Meeting and Convention Planners 258 287 Avg Fair Bach <1 None 13-1141 Compensation, Benefits, and Job Analysis Specialists 324 319 High Poor Bach 0 None 13-1151 Training and Development Specialists 893 962 +Avg Good Bach 0 None 13-1161 Market Research Analysts and Marketing Specialists 1,796 1,875 High Good Bach 0 None 13-1199 Business Operations Specialists, All Other 1,890 2,062 +Avg Excl HS <1 LTOJT 13-2011 Accountants and Auditors 4,755 5,156 High Excl Bach 0 None 13-2021 Appraisers and Assessors of Real Estate 157 166 +Avg Fair HS 0 App 13-2031 Budget Analysts 155 172 +Avg Fair Bach 0 None 13-2041 Credit Analysts 1,182 1,285 +Avg Good Bach 0 None 13-2051 Financial Analysts 1,948 2,120 High Excl Bach 0 None 13-2052 Personal Financial Advisors 930 1,199 High Excl Bach 0 None 13-2053 Insurance Underwriters 369 400 +Avg Fair Bach 0 MOJT 13-2061 Financial Examiners 168 180 High Fair Bach 0 MOJT
  • 19. 13-2071 Loan Counselors 201 210 Avg Fair Bach 0 MOJT 13-2072 Loan Officers 735 783 +Avg Good HS 0 MOJT 13-2081 Tax Examiners, Collectors, and Revenue Agents 225 239 +Avg Fair Bach 0 MOJT 13-2082 Tax Preparers 341 344 Avg Poor HS 0 MOJT 15-0000 Computer and Mathematical Occupations 15-1111 Computer and Information Research Scientists 81 95 High Fair PhD/prof 0 None 15-1121 Computer Systems Analysts 2,976 3,315 High Excl Bach 0 None 15-1131 Computer Programmers 1,232 1,263 High Fair Bach 0 None 15-1132 Software Developers, Applications 1,867 2,148 High Excl Bach 0 None 15-1133 Software Developers, Systems Software 1,260 1,394 High Good Bach 0 None 15-1141 Database Administrators 575 673 High Good Bach 1-5 None 15-1142 Network and Computer Systems Architects and Administrators 854 1,069 High Excl Bach 0 None 15-1150 Computer Support Specialists 2,084 2,329 +Avg Excl HS 0 MOJT 15-1179 Information Security Analysts, Web Developers, and Computer Network Architects 1,033 1,111 High Good Bach 1-5 None 15-1799 Computer Occupations, All Other 186 194 High Fair Bach 0 None 15-2011 Actuaries 122 158 High Good Bach 0 LTOJT 15-2031 Operations Research Analysts 208 225 High Fair Bach 0 None 15-2041 Statisticians 85 86 High Poor Mast 0 None 17-0000 Architecture and Engineering Occupations
  • 20. 17-1011 Architects, Except Landscape and Naval 115 138 High Fair Bach 0 Int/res 17-1012 Landscape Architects 106 118 +Avg Fair Bach 0 Int/res 6 Delaware 2020 Occupation Projections by Occupational Group SOC Code Title of Occupation 2010 Est. Empl 2020 Proj. Empl. Wage Cat. Job Avail. Educ. Work Exp. Job Training 17-1022 Surveyors 124 145 High Fair Bach 0 None 17-2051 Civil Engineers 1,019 1,148 High Good Bach 0 None
  • 21. 17-2071 Electrical Engineers 880 935 High Good Bach 0 None 17-2081 Environmental Engineers 143 153 High Fair Bach 0 None 17-2111 Health and Safety Engineers, Except Mining Safety Engineers and Inspectors 64 79 High Fair Bach 0 None 17-2112 Industrial Engineers 620 655 High Fair Bach 0 None 17-2141 Mechanical Engineers 569 652 High Good Bach 0 None 17-3011 Architectural and Civil Drafters 317 308 +Avg Poor Assoc 0 None 17-3012 Electrical and Electronics Drafters 154 171 +Avg Fair Assoc 0 None 17-3013 Mechanical Drafters 226 273 +Avg Good Assoc 0 None 17-3019 Drafters, All Other 16 16 +Avg Poor Assoc 0 None 17-3022 Civil Engineering Technicians 411 423 Avg Fair Assoc 0 None 17-3023 Electrical and Electronic Engineering Technicians 317 349 Avg Fair Assoc 0 None 17-3025 Environmental Engineering Technicians 31 36 +Avg Fair Assoc 0 None 17-3026 Industrial Engineering Technicians 120 129 Avg Fair Assoc 0 None 17-3027 Mechanical Engineering Technicians 156 164 +Avg Fair Assoc 0 None 17-3031 Surveying and Mapping Technicians 127 137 Avg Fair HS 0 MOJT 19-0000 Life, Physical, and Social Science Occupations 19-1013 Soil and Plant Scientists 74 85 +Avg Fair Bach 0 None 19-1021 Biochemists and Biophysicists 115 141 High Fair PhD/prof 0 None 19-1022 Microbiologists 107 116 +Avg Fair Bach 0 None 19-1023 Zoologists and Wildlife Biologists 13 12 High Poor Bach 0 None 19-1029 Biological Scientists, All Other 25 26 High Poor PhD/prof 0 None
  • 22. 19-1031 Conservation Scientists 29 30 +Avg Poor Bach 0 None 19-1032 Foresters 15 15 +Avg Poor Bach 0 None 19-2012 Physicists 21 25 High Poor PhD/prof 0 None 19-2031 Chemists 1,905 1,904 High Poor Bach 0 None 19-2032 Materials Scientists 87 94 High Fair Bach 0 None 19-2041 Environmental Scientists and Specialists, Including Health 401 460 +Avg Good Bach 0 None 19-2042 Geoscientists, Except Hydrologists and Geographers 40 49 High Fair Bach 0 None 19-2043 Hydrologists 29 35 +Avg Poor Mast 0 None 19-3011 Economists 44 44 High Poor Bach 0 None 19-3031 Clinical, Counseling, and School Psychologists 450 547 High Good PhD/prof 0 Int/res 19-3051 Urban and Regional Planners 196 211 +Avg Fair Mast 0 None 19-4021 Biological Technicians 225 230 Avg Poor Bach 0 None 19-4031 Chemical Technicians 617 655 +Avg Good Assoc 0 MOJT 19-4061 Social Science Research Assistants 100 112 -Avg Fair Assoc 0 None 19-4091 Environmental Science and Protection Technicians, Including Health 124 144 -Avg Fair Assoc 0 MOJT Occupation & Industry Projections 7 Occupation Projections by Occupational Group SOC Code Title of Occupation 2010 Est.
  • 23. Empl 2020 Proj. Empl. Wage Cat. Job Avail. Educ. Work Exp. Job Training 21-0000 Community and Social Service Occupations 21-1011 Substance Abuse and Behavioral Disorder Counselors 185 214 -Avg Fair HS 0 MOJT 21-1012 Educational, Vocational, and School Counselors 919 1,048 +Avg Good Mast 0 None 21-1013 Marriage and Family Therapists 223 238 +Avg Fair Mast 0 Int/res 21-1014 Mental Health Counselors 191 247 -Avg Good Mast 0 Int/res 21-1015 Rehabilitation Counselors 501 571 -Avg Good Mast 0 None 21-1021 Child, Family, and School Social Workers 970 1,113 Avg Good Bach 0 None 21-1022 Medical and Public Health Social Workers 892 1,040 Avg Excl Mast 0 None 21-1023 Mental Health and Substance Abuse Social Workers 499 606 Avg Good Bach 0 None
  • 24. 21-1029 Social Workers, All Other 115 121 +Avg Fair Bach 0 None 21-1091 Health Educators 187 256 +Avg Good Bach 0 None 21-1092 Probation Officers and Correctional Treatment Specialists 656 805 Avg Excl Bach 0 STOJT 21-1093 Social and Human Service Assistants 731 842 Low Good HS 0 STOJT 21-1798 Community and Social Service Specialists, All Other 410 485 -Avg Good Bach 0 None 23-0000 Legal Occupations 23-1011 Lawyers 3,037 3,058 High Fair PhD/prof 0 None 23-1012 Judicial Law Clerks 201 209 Avg Fair PhD/prof 0 None 23-1021 Administrative Law Judges, Adjudicators, and Hearing Officers 89 87 +Avg Poor Bach 1-5 MOJT 23-1022 Arbitrators, Mediators, and Conciliators 47 51 Avg Poor Bach 1-5 MOJT 23-1023 Judges, Magistrate Judges, and Magistrates 161 176 High Fair PhD/prof 5+ STOJT 23-2011 Paralegals and Legal Assistants 1,215 1,313 +Avg Good Assoc 0 None 23-2091 Court Reporters 76 89 +Avg Fair VocEd 0 STOJT 23-2093 Title Examiners, Abstractors, and Searchers 41 38 Avg Poor HS 0 STOJT 23-2099 Legal Support Workers, All Other 179 183 Avg Poor HS 0 STOJT 25-0000 Education, Training, and Library Occupations 25-1194 Vocational Education Teachers, Postsecondary 332 363 Avg Fair Bach 1-5 None 25-2011 Preschool Teachers, Except Special Education 1,890 2,117 Low Excl Assoc 0 None 25-2012 Kindergarten Teachers, Except Special Education 374
  • 25. 422 +Avg Good Bach 0 Int/res 25-2021 Elementary School Teachers, Except Special Education 3,604 4,032 +Avg Excl Bach 0 Int/res 25-2022 Middle School Teachers, Except Special and Vocational Education 2,499 2,797 +Avg Excl Bach 0 Int/res 25-2031 Secondary School Teachers, Except Special and Vocational Education 3,025 3,101 +Avg Good Bach 0 Int/res 25-2041 Special Education Teachers, Preschool, Kindergarten, and Elementary School 1,718 1,981 Avg Excl Bach 0 Int/res 25-2053 Special Education Teachers, Middle School 298 344 +Avg Good Bach 0 Int/res 25-2054 Special Education Teachers, Secondary School 220 227 +Avg Fair Bach 0 Int/res Occupation Projections by Occupational Group SOC Code Title of Occupation 2010 Est. Empl 2020 Proj. Empl. Wage Cat.
  • 26. Job Avail. Educ. Work Exp. Job Training 8 Delaware 2020 25-3011 Adult Literacy, Remedial Education, and GED Teachers and Instructors 307 338 +Avg Fair Bach 0 Int/res 25-3021 Self-Enrichment Education Teachers 456 534 Avg Good HS 1-5 None 25-3999 Teachers and Instructors, All Other 1,046 1,149 Avg Good Bach 0 None 25-4011 Archivists 44 45 Avg Poor Bach 0 None 25-4012 Curators 51 59 +Avg Fair Mast 0 None 25-4013 Museum Technicians and Conservators 46 47 Avg Poor Bach 0 None 25-4021 Librarians 482 509 +Avg Fair Mast 0 None 25-4031 Library Technicians 265 288 -Avg Fair VocEd 0 None 25-9011 Audio-Visual Collections Specialists 34 36 -Avg Poor Bach 1-5 None 25-9031 Instructional Coordinators 421 485 +Avg Good Mast 5+ None 25-9041 Teacher Assistants 2,148 2,370 Low Excl HS 0 STOJT 25-9099 Education, Training, and Library Workers, All Other 149 154 Avg Poor Bach 0 None 27-0000 Arts, Design, Entertainment, Sports, and Media Occupations
  • 27. 27-1011 Art Directors 60 65 High Fair Bach 1-5 None 27-1021 Commercial and Industrial Designers 24 22 +Avg Poor Bach 0 None 27-1023 Floral Designers 134 121 Low Poor HS 0 STOJT 27-1024 Graphic Designers 506 572 Avg Good Bach 0 None 27-1025 Interior Designers 119 139 Avg Fair Bach 0 None 27-1026 Merchandise Displayers and Window Trimmers 328 360 Low Fair HS 0 MOJT 27-1027 Set and Exhibit Designers 13 15 Avg Poor Bach 0 None 27-2023 Umpires, Referees, and Other Sports Officials 263 280 Low Fair HS 0 LTOJT 27-2041 Music Directors and Composers 27 27 High Poor Bach 1-5 None 27-3011 Radio and Television Announcers 43 54 Avg Fair Bach 0 None 27-3022 Reporters and Correspondents 77 72 -Avg Poor Bach 0 None 27-3031 Public Relations Specialists 946 1,092 +Avg Excl Bach 0 MOJT 27-3041 Editors 232 250 +Avg Fair Bach 1-5 None 27-3042 Technical Writers 114 135 +Avg Fair Bach 1-5 STOJT 27-3043 Writers and Authors 234 271 +Avg Good Bach 0 LTOJT 27-4011 Audio and Video Equipment Technicians 97 113 Avg Fair VocEd 0 MOJT 27-4012 Broadcast Technicians 35 44 Avg Fair Assoc 0 STOJT 27-4021 Photographers 220 237 -Avg Fair HS 0 LTOJT 29-0000 Healthcare Practitioners and Technical Occupations 29-1011 Chiropractors 161 199 High Good PhD/prof 0 None 29-1021 Dentists, General 433 496 High Good PhD/prof 0 Int/res 29-1031 Dietitians and Nutritionists 156 187 +Avg Fair Bach 0 Int/res 29-1041 Optometrists 112 139 High Fair PhD/prof 0 None
  • 28. 29-1051 Pharmacists 645 773 High Good PhD/prof 0 None 29-1061 Anesthesiologists 125 148 High Fair PhD/prof 0 Int/res 29-1062 Family and General Practitioners 533 639 High Good PhD/prof 0 Int/res Occupation Projections by Occupational Group SOC Code Title of Occupation 2010 Est. Empl 2020 Proj. Empl. Wage Cat. Job Avail. Educ. Work Exp. Job Training Occupation & Industry Projections 9 29-1063 Internists, General 249 297 High Good PhD/prof 0
  • 29. Int/res 29-1064 Obstetricians and Gynecologists 85 101 High Fair PhD/prof 0 Int/res 29-1065 Pediatricians, General 124 148 High Fair PhD/prof 0 Int/res 29-1066 Psychiatrists 100 116 High Fair PhD/prof 0 Int/res 29-1067 Surgeons 278 332 High Good PhD/prof 0 Int/res 29-1069 Physicians and Surgeons, All Other 1,199 1,406 High Excl PhD/prof 0 Int/res 29-1071 Physician Assistants 321 391 High Good Mast 0 None 29-1081 Podiatrists 97 114 High Fair PhD/prof 0 Int/res 29-1111 Registered Nurses 10,426 12,928 High Excl Assoc 0 None 29-1122 Occupational Therapists 356 441 High Good Mast 0 None 29-1123 Physical Therapists 631 841 High Excl PhD/prof 0 None 29-1124 Radiation Therapists 49 55 High Fair Assoc 0 None 29-1125 Recreational Therapists 65 74 -Avg Fair Bach 0 None 29-1126 Respiratory Therapists 399 514 +Avg Good Assoc 0 None 29-1127 Speech-Language Pathologists 380 465 High Good Mast 0 None 29-1128 Therapists, all other 102 147 Avg Good Mast 0 None 29-1131 Veterinarians 196 246 High Good PhD/prof 0 None 29-1181 Audiologists 28 34 +Avg Fair PhD/prof 0 None 29-1199 Health Diagnosing & Treating Practitioners, All Other 26 31 High Poor Mast 0 None 29-2011 Medical and Clinical Laboratory Technologists 403 421 +Avg Fair Bach 0 None 29-2012 Medical and Clinical Laboratory Technicians 308 347 Avg Good Assoc 0 None 29-2021 Dental Hygienists 572 720 High Excl Assoc 0 None 29-2031 Cardiovascular Technologists and Technicians 245 310 +Avg Good Assoc 0 None 29-2032 Diagnostic Medical Sonographers 207 287 +Avg Good
  • 30. Assoc 0 None 29-2033 Nuclear Medicine Technologists 97 112 High Fair Assoc 0 None 29-2037 Radiologic Technologists and Technicians 1,061 1,318 +Avg Excl Assoc 0 None 29-2041 Emergency Medical Technicians and Paramedics 947 1,168 -Avg Excl VocEd 0 None 29-2051 Dietetic Technicians 121 138 Low Fair HS 0 MOJT 29-2052 Pharmacy Technicians 1,160 1,483 Low Excl HS 0 MOJT 29-2055 Surgical Technologists 324 376 Avg Good VocEd 0 None 29-2056 Veterinary Technologists and Technicians 257 297 - Avg Good Assoc 0 None 29-2061 Licensed Practical and Licensed Vocational Nurses 2,341 2,818 Avg Excl VocEd 0 None 29-2071 Medical Records and Health Information Technicians 448 523 -Avg Good VocEd 0 None 29-2081 Opticians, Dispensing 267 303 -Avg Good HS 0 LTOJT 29-2799 Health Technologists and Technicians, All Other 241 294 Avg Good VocEd 0 STOJT 29-9011 Occupational Health and Safety Specialists 459 512 +Avg Good Bach 0 MOJT 29-9012 Occupational Health and Safety Technicians 14 17 Avg Poor HS 0 MOJT 29-9799 Healthcare Practitioners and Technical Workers, All Other, including genetic counselors 57 60 +Avg Poor Bach 0 None Occupation Projections by Occupational Group SOC Code Title of Occupation
  • 31. 2010 Est. Empl 2020 Proj. Empl. Wage Cat. Job Avail. Educ. Work Exp. Job Training 10 Delaware 2020 31-0000 Healthcare Support Occupations 31-1011 Home Health Aides 2,108 2,722 Low Excl <HS 0 STOJT 31-1012 Nursing Aides, Orderlies, and Attendants 5,533 6,609 Low Excl VocEd 0 None 31-1013 Psychiatric Aides 104 122 -Avg Fair HS 0 STOJT 31-2011 Occupational Therapist Assistants 78 96 +Avg Fair Assoc 0 None 31-2021 Physical Therapist Assistants 161 210 +Avg Good Assoc 0 None 31-2022 Physical Therapist Aides 164 222 Low Good HS 0 MOJT
  • 32. 31-9011 Massage Therapists 185 248 +Avg Good VocEd 0 None 31-9091 Dental Assistants 765 914 -Avg Excl VocEd 0 None 31-9092 Medical Assistants 1,380 1,680 -Avg Excl HS 0 MOJT 31-9093 Medical Equipment Preparers 200 229 -Avg Fair HS 0 MOJT 31-9094 Medical Transcriptionists 181 173 -Avg Poor VocEd 0 None 31-9095 Pharmacy Aides 34 37 Low Poor HS 0 STOJT 31-9096 Veterinary Assistants & Laboratory Animal Caretakers 242 246 Low Poor HS 0 STOJT 31-9799 Healthcare Support Workers, All Other 287 314 -Avg Fair HS 0 STOJT 33-0000 Protective Service Occupations 33-1012 First-Line Supervisors/Managers of Police and Detectives 276 286 High Fair HS 1-5 MOJT 33-1099 First-Line Supervisors/Managers, Protective Service Workers, All Other 325 356 Avg Fair HS 1-5 None 33-2011 Fire Fighters 379 411 Avg Fair VocEd 0 LTOJT 33-2021 Fire Inspectors and Investigators 88 96 Avg Fair HS 5+ MOJT 33-3041 Parking Enforcement Workers 33 35 -Avg Poor HS 0 STOJT 33-3051 Police and Sheriff's Patrol Officers 1,628 1,749 +Avg Good HS 0 MOJT 33-9011 Animal Control Workers 242 317 -Avg Good HS 0 MOJT 33-9021 Private Detectives and Investigators 39 45 +Avg Fair HS 1-5 MOJT 33-9031 Gaming Surveillance Officers and Gaming Investigators 57 64 Low Fair HS 0 STOJT 33-9032 Security Guards 3,288 3,800 Low Excl HS 0 STOJT 33-9091 Crossing Guards 309 318 Low Fair HS 0 STOJT
  • 33. 33-9092 Lifeguards, Ski Patrol, and Other Recreational Protective Service Workers 782 883 Low Good HS 0 STOJT 33-9099 Protective Service Workers, All Other 200 225 Low Fair HS 0 STOJT 35-0000 Food Preparation and Serving-Related Occupations 35-1011 Chefs and Head Cooks 165 169 Avg Poor HS 1-5 None 35-1012 First-Line Supervisors/Managers of Food Preparation and Serving Workers 2,821 3,108 -Avg Excl HS 1-5 None 35-2011 Cooks, Fast Food 836 809 Low Poor <HS 0 STOJT 35-2012 Cooks, Institution and Cafeteria 2,228 2,188 Low Poor <HS 0 STOJT 35-2014 Cooks, Restaurant 3,975 4,503 Low Excl <HS <1 MOJT 35-2015 Cooks, Short Order 132 138 Low Poor <HS 0 STOJT Occupation Projections by Occupational Group SOC Code Title of Occupation 2010 Est. Empl 2020 Proj. Empl. Wage Cat.
  • 34. Job Avail. Educ. Work Exp. Job Training Occupation & Industry Projections 11 35-2021 Food Preparation Workers 1,662 1,866 Low Excl <HS 0 STOJT 35-3011 Bartenders 1,770 1,925 Low Excl <HS 0 STOJT 35-3021 Combined Food Preparation and Serving Workers, Including Fast Food 9,574 11,022 Low Excl <HS 0 STOJT 35-3022 Counter Attendants, Cafeteria, Food Concession, and Coffee Shop 1,530 1,654 Low Good <HS 0 STOJT 35-3031 Waiters and Waitresses 7,285 7,959 Low Excl <HS 0 STOJT 35-3041 Food Servers, Nonrestaurant 451 504 Low Good <HS 0 STOJT 35-9011 Dining Room and Cafeteria Attendants and Bartender Helpers 1,005 1,120 Low Good <HS 0 STOJT 35-9021 Dishwashers 1,670 1,783 Low Good <HS 0 STOJT 35-9031 Hosts and Hostesses, Restaurant, Lounge, and Coffee Shop 1,331 1,392 Low Good <HS 0 None 35-9099 Food Preparation / Serving Related Workers, All Other 104 93 Low Poor <HS 0 STOJT 37-0000 Building and Grounds Cleaning and Maintenance
  • 35. Occupations 37-1011 First-Line Supervisors/Managers of Housekeeping and Janitorial Workers 503 500 -Avg Poor HS 1-5 None 37-1012 First-Line Supervisors/Managers of Landscaping, Lawn Service, and Groundskeeping Workers 440 538 +Avg Good HS 1-5 None 37-2011 Janitors and Cleaners, Except Maids and Housekeeping Cleaners 7,912 8,604 Low Excl <HS 0 STOJT 37-2012 Maids and Housekeeping Cleaners 2,708 2,962 Low Excl <HS 0 STOJT 37-2021 Pest Control Workers 180 221 -Avg Good HS 0 MOJT 37-3011 Landscaping and Groundskeeping Workers 3,212 3,956 Low Excl <HS 0 STOJT 37-3012 Pesticide Handlers, Sprayers, and Applicators, Vegetation 161 173 -Avg Fair HS 0 MOJT 37-3019 Grounds Maintenance Workers, All Other 22 23 +Avg Poor <HS 0 STOJT 39-0000 Personal Care and Service Occupations 39-1011 Gaming Supervisors 17 20 +Avg Poor HS 1-5 None 39-1012 Slot Key Persons 27 24 -Avg Poor HS 1-5 None 39-1021 First-Line Supervisors/Managers of Personal Service Workers 1,052 1,171 -Avg Good HS 1-5 None 39-2011 Animal Trainers 155 168 Avg Fair HS 0 MOJT 39-2021 Nonfarm Animal Caretakers 871 965 Low Good <HS 0 STOJT 39-3012 Gaming and Sports Book Writers and Runners 123 138 -Avg Fair HS 0 STOJT 39-3031 Ushers, Lobby Attendants, and Ticket Takers 274 275 Low Poor <HS 0 STOJT 39-3091 Amusement and Recreation Attendants 721 815 Low
  • 36. Good <HS 0 STOJT 39-3092 Costume Attendants 12 12 Low Poor HS 0 STOJT 39-3093 Locker Room, Coatroom, and Dressing Room Attendants 15 16 Low Poor HS 0 STOJT 39-3099 Entertainment Attendants and Related Workers, All Other 58 63 Low Fair HS 0 STOJT 39-4021 Funeral Attendants 149 166 -Avg Fair HS 0 STOJT Occupation Projections by Occupational Group SOC Code Title of Occupation 2010 Est. Empl 2020 Proj. Empl. Wage Cat. Job Avail. Educ. Work Exp. Job
  • 37. Training 12 Delaware 2020 39-4831 Funeral Service Managers, Directors, Morticians, and Undertakers 111 136 High Fair Assoc 0 App 39-5012 Hairdressers, Hairstylists, and Cosmetologists 2,012 2,527 -Avg Excl VocEd 0 None 39-5092 Manicurists and Pedicurists 271 353 Low Good VocEd 0 None 39-5093 Shampooers 416 403 Low Poor <HS 0 STOJT 39-9011 Child Care Workers 2,418 2,806 Low Excl HS 0 STOJT 39-9021 Personal and Home Care Aides 583 713 Low Good <HS 0 STOJT 39-9031 Fitness Trainers and Aerobics Instructors 2,238 2,542 - Avg Excl HS 0 STOJT 39-9032 Recreation Workers 936 1,093 Low Excl Bach 0 None 39-9041 Residential Advisors 65 80 Low Fair HS <1 STOJT 41-0000 Sales and Related Occupations 41-1011 First-Line Supervisors/Managers of Retail Sales Workers 5,036 5,362 Avg Excl HS 1-5 None 41-1012 First-Line Supervisors/Managers of Non-Retail Sales Workers 863 889 High Fair HS 5+ None 41-2011 Cashiers 12,168 13,068 Low Excl <HS 0 STOJT 41-2021 Counter and Rental Clerks 1,393 1,537 Low Good <HS 0 STOJT 41-2022 Parts Salespersons 724 808 Low Good <HS 0 MOJT 41-2031 Retail Salespersons 15,169 16,909 Low Excl <HS 0 STOJT 41-3011 Advertising Sales Agents 235 264 +Avg Fair HS 0 MOJT 41-3021 Insurance Sales Agents 1,231 1,596 +Avg Excl HS 0
  • 38. MOJT 41-3041 Travel Agents 159 171 -Avg Fair HS 0 MOJT 41-3099 Sales Representatives, Services, All Other 2,404 2,878 +Avg Excl HS 0 STOJT 41-4011 Sales Representatives, Wholesale and Manufacturing, Technical and Scientific Products 1,674 1,972 High Excl Bach 0 MOJT 41-4012 Sales Representatives, Wholesale and Manufacturing, Except Technical and Scientific Products 2,608 2,954 +Avg Excl HS 0 MOJT 41-9011 Demonstrators and Product Promoters 289 330 Low Good HS 0 STOJT 41-9021 Real Estate Brokers 102 114 High Fair HS 1-5 None 41-9022 Real Estate Sales Agents 1,380 1,756 +Avg Excl HS 0 LTOJT 41-9031 Sales Engineers 76 84 High Fair Bach 0 MOJT 41-9041 Telemarketers 410 416 Low Fair <HS 0 STOJT 41-9799 Sales and Related Workers, All Other 480 565 Avg Good HS 0 MOJT 43-0000 Office and Administrative Support Occupations 43-1011 First-Line Supervisors/Managers of Office and Administrative Support Workers 4,797 5,213 +Avg Excl HS 1-5 None 43-2011 Switchboard Operators, Including Answering Service 319 245 Low Poor HS 0 STOJT 43-2021 Telephone Operators 68 60 Low Poor HS 0 STOJT 43-3011 Bill and Account Collectors 1,904 2,003 -Avg Good HS 0 MOJT 43-3021 Billing and Posting Clerks and Machine Operators 2,129 2,410 -Avg Excl HS 0 STOJT 43-3031 Bookkeeping, Accounting, and Auditing Clerks 6,105 6,675 -Avg Excl HS 0 MOJT
  • 39. Occupation Projections by Occupational Group SOC Code Title of Occupation 2010 Est. Empl 2020 Proj. Empl. Wage Cat. Job Avail. Educ. Work Exp. Job Training Occupation & Industry Projections 13 43-3051 Payroll and Timekeeping Clerks 386 440 -Avg Good HS 0 MOJT 43-3061 Procurement Clerks 247 252 -Avg Poor HS 0 MOJT 43-3071 Tellers 1,858 1,750 Low Poor HS 0 STOJT 43-4011 Brokerage Clerks 152 147 Avg Poor HS 0 MOJT
  • 40. 43-4031 Court, Municipal, and License Clerks 705 745 -Avg Good HS 0 MOJT 43-4041 Credit Authorizers, Checkers, and Clerks 870 843 Avg Poor HS 0 STOJT 43-4051 Customer Service Representatives 7,623 8,447 Avg Excl HS 0 STOJT 43-4071 File Clerks 726 642 Low Poor HS 0 STOJT 43-4081 Hotel, Motel, and Resort Desk Clerks 727 782 Low Good HS 0 STOJT 43-4111 Interviewers, Except Eligibility and Loan 587 668 - Avg Good HS 0 STOJT 43-4121 Library Assistants, Clerical 294 324 Low Fair HS 0 STOJT 43-4131 Loan Interviewers and Clerks 1,060 932 -Avg Poor HS 0 STOJT 43-4141 New Accounts Clerks 333 319 -Avg Poor HS 0 STOJT 43-4151 Order Clerks 509 551 -Avg Good HS 0 STOJT 43-4161 Human Resources Assistants, Except Payroll and Timekeeping 401 419 -Avg Fair HS 0 STOJT 43-4171 Receptionists and Information Clerks 3,265 3,840 Low Excl HS 0 STOJT 43-4199 Information and Record Clerks, All Other 315 317 Avg Poor HS 0 STOJT 43-5011 Cargo and Freight Agents 32 37 Avg Poor HS 0 STOJT 43-5021 Couriers and Messengers 199 192 Low Poor HS 0 STOJT 43-5031 Police, Fire, and Ambulance Dispatchers 200 219 Avg Fair HS 0 MOJT 43-5032 Dispatchers, Except Police, Fire, and Ambulance 842 1,110 Avg Excl HS 0 MOJT 43-5041 Meter Readers, Utilities 136 129 Avg Poor HS 0 STOJT 43-5051 Postal Service Clerks 222 137 +Avg Poor HS 0 STOJT 43-5052 Postal Service Mail Carriers 992 1,047 Avg Good HS 0 STOJT
  • 41. 43-5053 Postal Service Mail Sorters, Processors, and Processing Machine Operators 444 274 Avg Poor HS 0 STOJT 43-5061 Production, Planning, and Expediting Clerks 740 788 Avg Good HS 0 MOJT 43-5071 Shipping, Receiving, and Traffic Clerks 1,639 1,612 - Avg Poor HS 0 STOJT 43-5081 Stock Clerks and Order Fillers 4,573 4,413 Low Poor <HS 0 STOJT 43-5111 Weighers, Measurers, Checkers, and Samplers, Recordkeeping 182 207 Low Fair HS 0 STOJT 43-6011 Executive Secretaries and Administrative Assistants 2,614 2,682 Avg Good HS 1-5 None 43-6012 Legal Secretaries 1,132 1,078 +Avg Poor HS 0 MOJT 43-6013 Medical Secretaries 4,267 5,453 -Avg Excl HS 0 MOJT 43-6014 Secretaries, Except Legal, Medical, and Executive 5,793 5,729 -Avg Poor HS 0 STOJT 43-9011 Computer Operators 552 517 Avg Poor HS 0 MOJT 43-9021 Data Entry Keyers 1,071 930 Low Poor HS 0 MOJT 43-9022 Word Processors and Typists 253 218 -Avg Poor HS 0 STOJT 43-9031 Desktop Publishers 58 52 -Avg Poor Assoc 0 STOJT 43-9041 Insurance Claims and Policy Processing Clerks 827 922 -Avg Good HS 0 MOJT Occupation Projections by Occupational Group SOC Code Title of Occupation 2010 Est.
  • 42. Empl 2020 Proj. Empl. Wage Cat. Job Avail. Educ. Work Exp. Job Training 14 Delaware 2020 43-9051 Mail Clerks and Mail Machine Operators, Except Postal Service 417 467 Low Good HS 0 STOJT 43-9061 Office Clerks, General 9,558 10,618 Low Excl HS 0 STOJT 43-9071 Office Machine Operators, Except Computer 310 266 Low Poor HS 0 STOJT 43-9081 Proofreaders and Copy Markers 19 20 -Avg Poor Bach 0 MOJT 43-9111 Statistical Assistants 22 24 Avg Poor Bach 0 None 43-9799 Office and Administrative Support Workers, All Other 510 585 -Avg Good HS 0 STOJT 45-0000 Farming, Fishing, and Forestry Occupations 45-1011 First-Line Supervisors/Managers of Farming, Fishing,
  • 43. and Forestry Workers 172 172 Avg Poor HS 1-5 None 45-2021 Animal Breeders 14 13 NA Poor HS 1-5 STOJT 45-2091 Agricultural Equipment Operators 210 211 -Avg Poor <HS <1 STOJT 45-2092 Farmworkers and Laborers, Crop, Nursery, and Greenhouse 1,878 1,871 Low Poor <HS 0 STOJT 45-2093 Farmworkers, Farm and Ranch Animals 462 483 Low Fair <HS 0 STOJT 47-0000 Construction and Extraction Occupations 47-1011 First-Line Supervisors/Managers of Construction Trades and Extraction Workers 1,984 2,537 +Avg Excl HS 5+ None 47-2011 Boilermakers 34 36 +Avg Poor HS 0 App 47-2021 Brickmasons and Blockmasons 310 364 Avg Good HS 0 App 47-2022 Stonemasons 27 39 Avg Fair HS 0 App 47-2031 Carpenters 2,414 3,106 Avg Excl HS 0 App 47-2051 Cement Masons and Concrete Finishers 327 422 Avg Good <HS 0 MOJT 47-2061 Construction Laborers 2,599 3,119 -Avg Excl <HS 0 STOJT 47-2071 Paving, Surfacing, and Tamping Equipment Operators 213 260 Avg Good HS 0 MOJT 47-2072 Pile-Driver Operators 12 16 -Avg Poor HS 0 MOJT 47-2073 Operating Engineers and Other Construction Equipment Operators 1,222 1,407 Avg Excl HS 0 MOJT 47-2081 Drywall and Ceiling Tile Installers 272 337 Avg Good <HS 0 MOJT 47-2111 Electricians 1,700 1,990 Avg Excl HS 0 App 47-2132 Insulation Workers, Mechanical 334 417 Avg Good HS 0 App 47-2141 Painters, Construction and Maintenance 953 1,137 -
  • 44. Avg Excl <HS 0 MOJT 47-2151 Pipelayers 148 182 -Avg Fair HS 0 STOJT 47-2152 Plumbers, Pipefitters, and Steamfitters 1,615 2,007 Avg Excl HS 0 App 47-2181 Roofers 232 261 Avg Fair <HS 0 MOJT 47-2211 Sheet Metal Workers 563 641 Avg Good HS 0 App 47-2221 Structural Iron and Steel Workers 230 269 Avg Good HS 0 App 47-3011 Helpers--Brickmasons, Blockmasons, Stonemasons, and Tile and Marble Setters 60 76 -Avg Fair <HS 0 STOJT 47-3012 Helpers--Carpenters 164 224 Low Good <HS 0 STOJT 47-3013 Helpers--Electricians 135 163 -Avg Fair HS 0 STOJT Occupation Projections by Occupational Group SOC Code Title of Occupation 2010 Est. Empl 2020 Proj. Empl. Wage Cat. Job Avail. Educ.
  • 45. Work Exp. Job Training Occupation & Industry Projections 15 47-3015 Helpers--Pipelayers, Plumbers, Pipefitters, and Steamfitters 134 190 Low Good HS 0 STOJT 47-3019 Helpers, Construction Trades, All Other 102 124 Low Fair <HS 0 STOJT 47-4011 Construction and Building Inspectors 426 498 Avg Good HS 5+ MOJT 47-4041 Hazardous Materials Removal Workers 133 153 -Avg Fair HS 0 MOJT 47-4051 Highway Maintenance Workers 28 32 -Avg Poor HS 0 MOJT 47-4061 Rail-Track Laying and Maintenance Equipment Operators 77 78 Avg Poor HS 0 MOJT 47-4071 Septic Tank Servicers and Sewer Pipe Cleaners 64 78 - Avg Fair <HS 0 MOJT 47-4799 Construction and Related Workers, All Other 48 54 - Avg Poor HS 0 MOJT 47-5021 Earth Drillers, Except Oil and Gas 42 48 Avg Fair HS 0 MOJT 49-0000 Installation, Maintenance, and Repair Occupations 49-1011 First-Line Supervisors/Managers of Mechanics, Installers, and Repairers 1,239 1,338 +Avg Good HS 1-5 None 49-2011 Computer, Automated Teller, and Office Machine Repairers 264 262 -Avg Poor VocEd 0 None
  • 46. 49-2022 Telecommunications Equipment Installers and Repairers, Except Line Installers 451 542 +Avg Good VocEd 0 MOJT 49-2092 Electric Motor, Power Tool, and Related Repairers 11 12 Avg Poor VocEd 0 LTOJT 49-2094 Electrical and Electronics Repairers, Commercial and Industrial Equipment 324 355 +Avg Fair VocEd 0 LTOJT 49-2095 Electrical and Electronics Repairers, Powerhouse, Substation, and Relay 270 284 High Fair VocEd 0 LTOJT 49-2096 Electronic Equipment Installers and Repairers, Motor Vehicles 33 32 -Avg Poor VocEd 0 STOJT 49-2097 Electronic Home Entertainment Equipment Installers and Repairers 155 162 -Avg Poor VocEd 0 None 49-2098 Security and Fire Alarm Systems Installers 224 286 +Avg Good HS 0 MOJT 49-3011 Aircraft Mechanics and Service Technicians 301 308 +Avg Fair VocEd 0 None 49-3021 Automotive Body and Related Repairers 331 354 Avg Fair HS 0 MOJT 49-3023 Automotive Service Technicians and Mechanics 2,262 2,462 Avg Excl HS 0 LTOJT 49-3031 Bus and Truck Mechanics and Diesel Engine Specialists 454 507 Avg Good HS 0 LTOJT 49-3041 Farm Equipment Mechanics 76 92 -Avg Fair HS 0 LTOJT 49-3042 Mobile Heavy Equipment Mechanics, Except Engines 502 584 Avg Good HS 0 LTOJT 49-3051 Motorboat Mechanics 88 102 -Avg Fair HS 0 LTOJT 49-3053 Outdoor Power Equipment and Other Small
  • 47. Engine Mechanics 92 107 -Avg Fair HS 0 MOJT 49-3093 Tire Repairers and Changers 247 273 Low Fair HS 0 MOJT 49-9011 Mechanical Door Repairers 33 39 -Avg Fair HS 0 MOJT 49-9012 Control and Valve Installers and Repairers, Except Mechanical Door 127 120 +Avg Poor HS 0 MOJT Occupation Projections by Occupational Group SOC Code Title of Occupation 2010 Est. Empl 2020 Proj. Empl. Wage Cat. Job Avail. Educ. Work Exp. Job Training
  • 48. 16 Delaware 2020 49-9021 Heating, Air Conditioning, and Refrigeration Mechanics and Installers 1,075 1,414 Avg Excl VocEd 0 LTOJT 49-9031 Home Appliance Repairers 153 139 -Avg Poor HS 0 MOJT 49-9041 Industrial Machinery Mechanics 695 784 +Avg Good HS 0 LTOJT 49-9044 Millwrights 122 125 Avg Poor HS 0 LTOJT 49-9051 Electrical Power-Line Installers and Repairers 286 287 +Avg Poor HS 0 LTOJT 49-9052 Telecommunications Line Installers and Repairers 1,361 1,559 +Avg Excl HS 0 LTOJT 49-9062 Medical Equipment Repairers 120 148 Avg Fair Assoc 0 MOJT 49-9069 Precision Instrument and Equipment Repairers, All Other 64 65 +Avg Poor Assoc 0 LTOJT 49-9071 Maintenance and Repair Workers, General 3,346 3,686 -Avg Excl HS 0 MOJT 49-9091 Coin, Vending, and Amusement Machine Servicers and Repairers 174 219 -Avg Good HS 0 STOJT 49-9098 Helpers--Installation, Maintenance, and Repair Workers 385 437 Low Good HS 0 MOJT 49-9799 Installation, Maintenance, and Repair Workers, All Other 391 421 Avg Fair HS 0 MOJT 51-0000 Production Occupations 51-1011 First-Line Supervisors/Managers of Production and Operating Workers 1,417 1,493 +Avg Good VocEd 1-5 None
  • 49. 51-2041 Structural Metal Fabricators and Fitters 208 243 Avg Good HS 0 MOJT 51-2092 Team Assemblers 872 926 Low Good HS 0 MOJT 51-3011 Bakers 294 292 Low Poor <HS 0 LTOJT 51-3021 Butchers and Meat Cutters 191 208 -Avg Fair <HS 0 LTOJT 51-3022 Meat, Poultry, and Fish Cutters and Trimmers 4,879 5,278 Low Excl <HS 0 STOJT 51-3092 Food Batchmakers 35 34 Low Poor HS <1 STOJT 51-3093 Food Cooking Machine Operators and Tenders 53 52 Low Poor HS <1 STOJT 51-4011 Computer-Controlled Machine Tool Operators, Metal and Plastic 97 112 -Avg Fair HS 0 MOJT 51-4012 Numerical Tool and Process Control Programmers 15 16 Avg Poor HS 0 MOJT 51-4021 Extruding and Drawing Machine Setters, Operators, and Tenders, Metal and Plastic 355 467 -Avg Good HS 0 MOJT 51-4031 Cutting, Punching, and Press Machine Setters, Operators, and Tenders, Metal and Plastic 234 219 -Avg Poor HS 0 MOJT 51-4032 Drilling and Boring Machine Tool Setters, Operators, and Tenders, Metal and Plastic 40 35 Low Poor HS 0 MOJT 51-4033 Grinding, Lapping, Polishing, and Buffing Machine Tool Setters, Operators, and Tenders, Metal and Plastic 73 80 -Avg Fair HS 0 MOJT 51-4041 Machinists 475 542 Avg Good HS 0 LTOJT 51-4072 Molding, Coremaking, and Casting Machine Setters, Operators, and Tenders, Metal and Plastic 87 92 -Avg Poor HS 0 MOJT
  • 50. 51-4081 Multiple Machine Tool Setters, Operators, and Tenders, Metal and Plastic 170 195 -Avg Fair HS 0 MOJT Occupation Projections by Occupational Group SOC Code Title of Occupation 2010 Est. Empl 2020 Proj. Empl. Wage Cat. Job Avail. Educ. Work Exp. Job Training Occupation & Industry Projections 17 51-4121 Welders, Cutters, Solderers, and Brazers 501 627 Avg Good HS <1 MOJT
  • 51. 51-5111 Prepress Technicians and Workers 64 53 Avg Poor VocEd 0 None 51-5112 Printing Press Operators and Job Printers 274 263 Avg Poor HS 0 MOJT 51-5113 PrInt Binding and Finishing Workers 83 76 -Avg Poor HS 0 STOJT 51-6011 Laundry and Dry-Cleaning Workers 873 880 Low Fair <HS 0 STOJT 51-6031 Sewing Machine Operators 133 125 Low Poor <HS 0 STOJT 51-6041 Shoe and Leather Workers and Repairers 29 29 Avg Poor HS 0 MOJT 51-6093 Upholsterers 81 81 -Avg Poor HS 0 MOJT 51-7011 Cabinetmakers and Bench Carpenters 324 307 -Avg Poor HS 0 MOJT 51-7021 Furniture Finishers 27 35 -Avg Fair HS 0 STOJT 51-7042 Woodworking Machine Setters, Operators, and Tenders, Except Sawing 42 38 Low Poor HS 0 STOJT 51-8013 Power Plant Operators 166 158 High Poor HS 0 LTOJT 51-8021 Stationary Engineers and Boiler Operators 63 65 +Avg Poor HS 0 LTOJT 51-8031 Water and Liquid Waste Treatment Plant and System Operators 324 388 Avg Good HS 0 LTOJT 51-8091 Chemical Plant and System Operators 111 94 +Avg Poor HS 0 LTOJT 51-8092 Gas Plant Operators 20 18 +Avg Poor HS 0 LTOJT 51-9011 Chemical Equipment Operators and Tenders 514 459 +Avg Poor HS 0 MOJT 51-9012 Separating, Filtering, Clarifying, Precipitating, and Still Machine Setters, Operators, and Tenders 126 129 -Avg Poor HS 0 MOJT 51-9021 Crushing, Grinding, and Polishing Machine Setters,
  • 52. Operators, and Tenders 107 117 Low Fair HS 0 MOJT 51-9023 Mixing and Blending Machine Setters, Operators, and Tenders 144 211 Avg Good HS 0 MOJT 51-9031 Cutters and Trimmers, Hand 18 17 -Avg Poor <HS 0 STOJT 51-9032 Cutting and Slicing Machine Setters, Operators, and Tenders 165 151 -Avg Poor HS 0 STOJT 51-9041 Extruding, Forming, Pressing, and Compacting Machine Setters, Operators, and Tenders 245 206 -Avg Poor HS 0 MOJT 51-9051 Furnace, Kiln, Oven, Drier, and Kettle Operators and Tenders 25 25 Avg Poor HS 0 MOJT 51-9061 Inspectors, Testers, Sorters, Samplers, and Weighers 1,129 1,284 -Avg Excl HS 0 MOJT 51-9082 Medical Appliance Technicians 49 50 -Avg Poor HS 0 LTOJT 51-9083 Ophthalmic Laboratory Technicians 17 20 -Avg Poor HS 0 MOJT 51-9111 Packaging and Filling Machine Operators and Tenders 1,269 1,363 -Avg Good HS 0 MOJT 51-9121 Coating, Painting, and Spraying Machine Setters, Operators, and Tenders 31 34 Avg Poor HS 0 MOJT 51-9122 Painters, Transportation Equipment 139 147 Avg Fair HS 0 MOJT 51-9191 Cementing and Gluing Machine Operators and Tenders 33 29 Low Poor HS 0 MOJT 51-9196 Paper Goods Machine Setters, Operators, and Tenders 46 39 -Avg Poor HS 0 MOJT 51-9198 Helpers--Production Workers 763 869 Low Good <HS
  • 53. 0 STOJT 51-9399 Production Workers, All Other 173 173 Low Poor HS 0 MOJT Occupation Projections by Occupational Group SOC Code Title of Occupation 2010 Est. Empl 2020 Proj. Empl. Wage Cat. Job Avail. Educ. Work Exp. Job Training 18 Delaware 2020 53-0000 Transportation and Material Moving Occupations 53-1021 First-Line Supervisors/Managers of Helpers, Laborers,
  • 54. and Material Movers, Hand 468 570 Avg Good HS 1-5 None 53-1031 First-Line Supervisors/Managers of Transportation and Material-Moving Machine and Vehicle Operators 549 607 +Avg Good HS 1-5 None 53-2012 Commercial Pilots 93 126 High Fair VocEd 0 None 53-3011 Ambulance Drivers and Attendants, Except Emergency Medical Technicians 123 155 Low Fair HS 0 MOJT 53-3021 Bus Drivers, Transit and Intercity 150 160 Low Fair HS 0 MOJT 53-3022 Bus Drivers, School 1,675 1,895 Low Excl HS 0 MOJT 53-3031 Driver/Sales Workers 1,296 1,419 Low Good HS 0 STOJT 53-3032 Truck Drivers, Heavy and Tractor-Trailer 3,781 4,473 Avg Excl HS 1-5 STOJT 53-3033 Truck Drivers, Light or Delivery Services 2,639 2,822 -Avg Excl HS 0 STOJT 53-3041 Taxi Drivers and Chauffeurs 628 707 Low Good <HS 0 STOJT 53-3099 Motor Vehicle Operators, All Other 391 425 Low Good HS 0 STOJT 53-5011 Sailors and Marine Oilers 20 22 -Avg Poor <HS 0 STOJT 53-5021 Captains, Mates, and Pilots of Water Vessels 33 37 High Poor Bach 0 None 53-6021 Parking Lot Attendants 407 412 Low Poor <HS 0 STOJT 53-6031 Service Station Attendants 93 104 Low Fair <HS 0 STOJT 53-6051 Transportation Inspectors 117 136 Avg Fair HS 0 STOJT 53-6099 Transportation Workers, All Other 38 47 Low Fair HS 0 STOJT 53-7011 Conveyor Operators and Tenders 13 15 -Avg Poor <HS
  • 55. 0 STOJT 53-7021 Crane and Tower Operators 131 139 +Avg Fair <HS 1- 5 LTOJT 53-7032 Excavating and Loading Machine and Dragline Operators 261 318 Avg Good <HS 1-5 MOJT 53-7051 Industrial Truck and Tractor Operators 984 1,079 -Avg Good <HS <1 STOJT 53-7062 Laborers and Freight, Stock, and Material Movers, Hand 5,479 6,136 Low Excl <HS 0 STOJT 53-7064 Packers and Packagers, Hand 1,607 1,725 Low Good <HS 0 STOJT 53-7081 Refuse and Recyclable Material Collectors 496 614 - Avg Good <HS 0 STOJT 53-7121 Tank Car, Truck, and Ship Loaders 433 431 +Avg Poor <HS 0 STOJT 19Occupation & Industry Projections Career Cluster Average Wage 2010 Rank Total Openings Rank Percent Total Openings New Jobs Ann. Pct. Growth Agriculture, Food, & Natural Resources $28,426 15th 5,567
  • 56. 10th 3.8% 1,585 3.3% Architecture & Construction $48,244 10th 11,212 5th 7.7% 5,458 11.4% Arts, A/V Technology & Communications $51,886 8th 1,900 15th 1.3% 666 1.4% Business Management & Administration $53,227 7th 17,771 3rd 12.2% 5,012 10.5% Education & Training $49,107 9th 7,511 7th 5.2% 2,277 4.8% Finance $55,595 5th 6,729 8th 4.6% 1,899 4.0% Government & Public Administration $54,207 6th 916 16th 0.6% 343 0.7% Health Science $61,231 4th 17,264 4th 11.9% 9,645 20.2% Hospitality & Tourism $23,349 16th 21,661 2nd 14.9% 5,153 10.8% Human Services $30,926 14th 5,834 9th 4.0% 2,500 5.2% Information Technology $80,562 1st 3,974 13th 2.7% 1,466 3.1% Law, Public Safety & Security $65,020 3rd 4,575 11th 3.1% 1,261 2.6% Manufacturing $46,145 11th 4,304 12th 3.0% 1,267 2.7% Marketing, Sales & Service $38,865 12th 22,708 1st 15.6% 5,267 11.0%
  • 57. Science, Technology, Engineering & Mathematics $78,735 2nd 2,549 14th 1.8% 494 1.0% Transportation, Distribution & Logistics $37,353 13th 11,041 6th 7.6% 3,483 7.3% Wages, Projected Openings, and Growth by Career Cluster, 2010–2020 Occupation Projections by Career Cluster This section contains occupations grouped by career clusters. The US Department of Education developed these 16 groupings as a way to link school and work, helping students to choose a curriculum which is best suited to their career plans. The occupations listed here are the same ones displayed in the previous section; they are simply organized differently. Occupations are arranged alphabetically within each of the 16 career clusters. For each occupation, we provide its SOC code, forecasted average annual growth rate from 2010 to 2020, average annual openings due to growth for that period, average annual openings due to net replacement of workers (the total expected job openings in an average year would be the sum of these two numbers), and the estimated 2010 average annual wage. The SOC code can be used to refer back to the
  • 58. previous section to find the usual education, experience, and training requirements for the occupation. The Marketing, Sales & Service cluster is expected to generate the most job openings, more than 22,700, while the Government and Public Administration cluster is expected to generate the fewest, at just over 900. This is not to say that government as an employer will grow the slowest (total government employment is actually expected to grow at the same pace as the overall average); the great majority of jobs in government are to be found in other career clusters (for example, public school teachers are in the Education and Training cluster, while computer programmers who work for a government agency would be found in the Information Technology cluster). Information Technology is the highest- paying cluster; its occupations paid an average wage of $80,562 in 2010. Hospitality and Tourism had the lowest average wage; this cluster’s occupations paid an average $23,349 in 2010. Averages for all 16 career clusters can be found in the table below, along with their ranking among the 16 clusters.
  • 59. 20 Delaware 2020 SOC Code Title of Occupation Average Annual Growth Rate Average Annual Openings due to Growth Average Annual Openings due to Replacements 2010 Average Annual Wages Table 2: Occupation Projections by Career Cluster Agriculture, Food and Natural Resources 45-2091 Agricultural Equipment Operators 0.0% 0 6 $29,765 45-2021 Animal Breeders -0.7% 0 0 NA
  • 60. 39-2011 Animal Trainers 0.8% 1 2 $40,269 19-1029 Biological Scientists, All Other 0.4% 0 1 $66,331 51-3021 Butchers and Meat Cutters 0.9% 2 6 $33,779 19-1031 Conservation Scientists 0.3% 0 0 $63,794 17-3025 Environmental Engineering Technicians 1.5% 1 1 $53,498 17-2081 Environmental Engineers 0.7% 1 3 $76,606 49-3041 Farm Equipment Mechanics 1.9% 2 2 $34,570 11-9013 Farmers, Ranchers, and Other Agricultural Managers - 0.7% 0 50 NA 45-2092 Farmworkers and Laborers, Crop, Nursery, and Greenhouse 0.0% 0 57 $26,416 45-2093 Farmworkers, Farm and Ranch Animals 0.4% 2 14 $23,650 45-1011 First-Line Supervisors/Managers of Farming, Fishing, and Forestry Workers 0.0% 0 5 $50,066 37-1012 First-Line Supervisors/Managers of Landscaping, Lawn Service, and Groundskeeping Workers 2.0% 10 6 $51,376 19-1032 Foresters 0.0% 0 0 $50,523 37-3019 Grounds Maintenance Workers, All Other 0.4% 0 0 $51,189 37-3011 Landscaping and Groundskeeping Workers 2.1% 75 57 $24,960 51-3022 Meat, Poultry, and Fish Cutters and Trimmers 0.8% 40 142 $22,776 39-2021 Nonfarm Animal Caretakers 1.0% 9 19 $23,982 37-2021 Pest Control Workers 2.1% 4 8 $34,653 37-3012 Pesticide Handlers, Sprayers, and Applicators, Vegetation 0.7% 1 3 $36,982 19-1013 Soil and Plant Scientists 1.4% 1 3 $51,750 29-1131 Veterinarians 2.3% 5 4 $112,070 31-9096 Veterinary Assistants and Laboratory Animal
  • 61. Caretakers 0.2% 0 4 $24,294 29-2056 Veterinary Technologists and Technicians 1.5% 4 4 $29,640 19-1023 Zoologists and Wildlife Biologists -0.8% 0 0 $83,866 Architecture and Construction 17-1011 Architects, Except Landscape and Naval 1.8% 2 2 $80,413 17-3011 Architectural and Civil Drafters -0.3% 0 6 $51,210 47-2011 Boilermakers 0.6% 0 1 $57,200 47-2021 Brickmasons and Blockmasons 1.6% 6 6 $45,739 47-2031 Carpenters 2.6% 69 51 $43,285 Occupation & Industry Projections 21 Occupation Projections by Career Cluster SOC Code Title of Occupation Average Annual Growth Rate Average Annual Openings due to Growth Average
  • 62. Annual Openings due to Replacements 2010 Average Annual Wages 47-2051 Cement Masons and Concrete Finishers 2.6% 10 5 $41,746 17-2051 Civil Engineers 1.2% 13 21 $76,773 49-9091 Coin, Vending, and Amusement Machine Servicers and Repairers 2.3% 4 3 $36,338 47-4011 Construction and Building Inspectors 1.6% 7 12 $47,424 47-4799 Construction and Related Workers, All Other 1.2% 0 2 $38,085 47-2061 Construction Laborers 1.8% 52 21 $30,680 11-9021 Construction Managers 2.4% 31 8 $103,834 49-9012 Control and Valve Installers and Repairers, Except Mechanical Door -0.6% 0 2 $57,346 13-1051 Cost Estimators 2.9% 24 14 $63,086 53-7021 Crane and Tower Operators 0.6% 1 4 $51,043 17-3019 Drafters, All Other 0.0% 0 0 $52,478 47-2081 Drywall and Ceiling Tile Installers 2.2% 6 8 $44,866 47-5021 Earth Drillers, Except Oil and Gas 1.3% 1 1 $43,160 17-3012 Electrical and Electronics Drafters 1.1% 2 3 $57,179 49-2095 Electrical and Electronics Repairers, Powerhouse, Substation, and Relay 0.5% 2 7 $68,307 49-9051 Electrical Power-Line Installers and Repairers 0.0% 0 10 $62,899 47-2111 Electricians 1.6% 29 46 $48,381
  • 63. 53-7032 Excavating and Loading Machine and Dragline Operators 2.0% 6 8 $46,509 47-1011 First-Line Supervisors/Managers of Construction Trades and Extraction Workers 2.5% 55 46 $65,291 47-4041 Hazardous Materials Removal Workers 1.4% 2 4 $38,438 49-9021 Heating, Air Conditioning, and Refrigeration Mechanics and Installers 2.8% 34 19 $46,509 47-3019 Helpers, Construction Trades, All Other 2.0% 2 3 $27,789 47-3011 Helpers--Brickmasons, Blockmasons, Stonemasons, and Tile and Marble Setters 2.4% 2 2 $32,594 47-3012 Helpers--Carpenters 3.2% 6 4 $27,830 47-3013 Helpers--Electricians 1.9% 3 4 $29,370 49-9098 Helpers--Installation, Maintenance, and Repair Workers 1.3% 5 18 $27,352 47-3015 Helpers--Pipelayers, Plumbers, Pipefitters, and Steamfitters 3.6% 6 4 $26,187 47-4051 Highway Maintenance Workers 1.3% 0 1 $30,098 49-9031 Home Appliance Repairers -1.0% 0 3 $34,299 49-9799 Installation, Maintenance, and Repair Workers, All Other 0.7% 3 7 $39,603 47-2132 Insulation Workers, Mechanical 2.2% 8 13 $45,094 17-1012 Landscape Architects 1.1% 1 2 $51,626 49-9071 Maintenance and Repair Workers, General 1.0% 34 62 $36,587 49-9011 Mechanical Door Repairers 1.7% 1 1 $36,941 17-3013 Mechanical Drafters 1.9% 5 4 $60,757
  • 64. 22 Delaware 2020 Occupation Projections by Career Cluster SOC Code Title of Occupation Average Annual Growth Rate Average Annual Openings due to Growth Average Annual Openings due to Replacements 2010 Average Annual Wages 47-2073 Operating Engineers and Other Construction Equipment Operators 1.4% 18 28 $41,038 47-2141 Painters, Construction and Maintenance 1.8% 18 21 $34,715 47-2071 Paving, Surfacing, and Tamping Equipment Operators
  • 65. 2.0% 5 4 $39,894 47-2072 Pile-Driver Operators 2.9% 0 0 $36,234 47-2151 Pipelayers 2.1% 3 4 $38,126 47-2152 Plumbers, Pipefitters, and Steamfitters 2.2% 39 47 $49,483 47-4061 Rail-Track Laying and Maintenance Equipment Operators 0.1% 0 2 $47,819 47-2181 Roofers 1.2% 3 5 $38,750 49-2098 Security and Fire Alarm Systems Installers 2.5% 6 6 $53,643 47-4071 Septic Tank Servicers and Sewer Pipe Cleaners 2.0% 2 2 $37,898 47-2211 Sheet Metal Workers 1.3% 8 10 $48,984 47-2022 Stonemasons 3.7% 1 1 $43,618 47-2221 Structural Iron and Steel Workers 1.6% 4 5 $42,723 51-2041 Structural Metal Fabricators and Fitters 1.6% 4 4 $42,016 17-1022 Surveyors 1.6% 2 3 $70,845 Arts, Audio/Visual and Communications 25-4011 Archivists 0.2% 0 1 $42,682 27-1011 Art Directors 0.8% 1 1 $83,179 27-4011 Audio and Video Equipment Technicians 1.5% 2 3 $44,866 25-9011 Audio-Visual Collections Specialists 0.6% 0 1 $37,149 27-4012 Broadcast Technicians 2.3% 1 1 $46,571 27-1021 Commercial and Industrial Designers -0.9% 0 1 $62,442 23-2091 Court Reporters 1.6% 1 1 $53,040 25-4012 Curators 1.5% 1 2 $52,166 43-9031 Desktop Publishers -1.1% 0 1 $36,525 27-3041 Editors 0.8% 2 7 $61,672 49-2097 Electronic Home Entertainment Equipment Installers and Repairers 0.4% 0 4 $32,926 27-1024 Graphic Designers 1.2% 7 16 $48,402
  • 66. 25-4013 Museum Technicians and Conservators 0.2% 0 1 $39,499 27-2041 Music Directors and Composers 0.0% 0 1 $81,578 27-4021 Photographers 0.7% 2 2 $32,843 51-5111 Prepress Technicians and Workers -1.9% 0 2 $41,018 51-5113 Print Binding and Finishing Workers -0.9% 0 3 $32,178 51-5112 Printing Press Operators and Job Printers -0.4% 0 5 $43,014 27-3031 Public Relations Specialists 1.4% 15 25 $58,968 27-3011 Radio and Television Announcers 2.3% 1 1 $42,578 27-3022 Reporters and Correspondents -0.7% 0 3 $36,920 27-1027 Set and Exhibit Designers 1.4% 0 0 $46,862 Occupation & Industry Projections 23 Occupation Projections by Career Cluster SOC Code Title of Occupation Average Annual Growth Rate Average Annual Openings due to Growth
  • 67. Average Annual Openings due to Replacements 2010 Average Annual Wages 27-3042 Technical Writers 1.7% 2 2 $62,587 49-2022 Telecommunications Equipment Installers and Repairers, Except Line Installers 1.9% 9 7 $52,395 49-9052 Telecommunications Line Installers and Repairers 1.4% 20 25 $55,494 43-2021 Telephone Operators -1.2% 0 2 $28,246 27-3043 Writers and Authors 1.5% 4 6 $59,363 Business Management and Administration 13-2011 Accountants and Auditors 0.8% 40 102 $66,040 11-3011 Administrative Services Managers 0.6% 5 19 $95,680 43-3021 Billing and Posting Clerks and Machine Operators 1.2% 28 37 $34,632 13-2031 Budget Analysts 1.0% 2 3 $63,419 13-1199 Business Operations Specialists, All Other 0.9% 17 36 $64,834 11-1011 Chief Executives 0.7% 3 10 $219,232 11-3111 Compensation and Benefits Managers -0.8% 0 4 $102,898 13-1141 Compensation, Benefits, and Job Analysis Specialists - 0.2% 0 5 $66,310 43-5021 Couriers and Messengers -0.4% 0 5 $27,227 43-4051 Customer Service Representatives 1.0% 82 217 $39,229
  • 68. 43-9021 Data Entry Keyers -1.4% 0 19 $27,040 43-6011 Executive Secretaries and Administrative Assistants 0.3% 7 35 $49,358 43-4071 File Clerks -1.2% 0 19 $27,539 43-1011 First-Line Supervisors/Managers of Office and Administrative Support Workers 0.8% 41 128 $52,312 11-1021 General and Operations Managers 1.0% 48 80 $132,496 43-4161 Human Resources Assistants, Except Payroll and Timekeeping 0.4% 2 11 $35,797 11-3121 Human Resources Managers 0.4% 1 6 $126,069 13-1078 Human Resources, Labor Relations, and Training Specialists, All Other 0.9% 14 26 $60,528 43-4199 Information and Record Clerks, All Other 0.1% 0 9 $41,080 43-4111 Interviewers, Except Eligibility and Loan 1.3% 8 12 $33,675 43-9051 Mail Clerks and Mail Machine Operators, Except Postal Service 1.1% 5 8 $23,816 13-1111 Management Analysts 0.8% 16 33 $80,954 11-9199 Managers, All Other 0.0% 0 26 $122,533 43-5041 Meter Readers, Utilities -0.5% 0 4 $43,493 43-9799 Office and Administrative Support Workers, All Other 1.4% 7 11 $33,426 43-9061 Office Clerks, General 1.1% 106 169 $27,165 43-9071 Office Machine Operators, Except Computer -1.5% 0 9 $26,603 43-4151 Order Clerks 0.8% 4 14 $30,014 43-9081 Proofreaders and Copy Markers 0.5% 0 0 $36,338 11-2031 Public Relations Managers 0.1% 0 7 $136,531 43-4171 Receptionists and Information Clerks 1.6% 58 99 $24,898
  • 69. 24 Delaware 2020 Occupation Projections by Career Cluster SOC Code Title of Occupation Average Annual Growth Rate Average Annual Openings due to Growth Average Annual Openings due to Replacements 2010 Average Annual Wages 43-6014 Secretaries, Except Legal, Medical, and Executive - 0.1% 0 78 $35,443 43-2011 Switchboard Operators, Including Answering Service - 2.6% 0 6 $26,000
  • 70. 13-2082 Tax Preparers 0.1% 0 8 $42,827 11-3131 Training and Development Managers -0.2% 0 3 $131,310 13-1151 Training and Development Specialists 0.7% 6 15 $61,256 43-9022 Word Processors and Typists -1.5% 0 2 $35,526 Education and Training 25-3011 Adult Literacy, Remedial Education, and GED Teachers and Instructors 1.0% 3 5 $50,502 11-9039 Education Administrators, All Other 1.5% 1 1 $65,894 11-9032 Education Administrators, Elementary and Secondary School 0.5% 3 17 $102,308 11-9031 Education Administrators, Preschool and Child Care Center/Program 1.2% 4 8 $51,064 25-9099 Education, Training, and Library Workers, All Other 0.3% 0 3 $43,264 21-1012 Educational, Vocational, and School Counselors 1.3% 13 20 $57,699 25-2021 Elementary School Teachers, Except Special Education 1.1% 43 79 $54,702 21-1091 Health Educators 3.2% 7 4 $59,592 25-9031 Instructional Coordinators 1.4% 6 9 $62,005 25-2012 Kindergarten Teachers, Except Special Education 1.2% 5 10 $52,521 25-4021 Librarians 0.5% 3 12 $60,778 43-4121 Library Assistants, Clerical 1.0% 3 13 $20,800 25-4031 Library Technicians 0.8% 2 11 $35,714 25-2022 Middle School Teachers, Except Special and Vocational Education 1.1% 30 55 $54,226 25-2011 Preschool Teachers, Except Special Education 1.1% 23 49 $24,690 25-2031 Secondary School Teachers, Except Special and
  • 71. Vocational Education 0.2% 8 83 $55,483 25-3021 Self-Enrichment Education Teachers 1.6% 8 7 $46,654 25-2053 Special Education Teachers, Middle School 1.4% 4 9 $55,672 25-2041 Special Education Teachers, Preschool, Kindergarten, and Elementary School 1.4% 26 51 $48,092 25-2054 Special Education Teachers, Secondary School 0.3% 1 6 $61,231 25-9041 Teacher Assistants 1.0% 22 48 $27,920 25-3999 Teachers and Instructors, All Other 0.9% 10 16 $44,047 25-1194 Vocational Education Teachers, Postsecondary 0.9% 3 5 $47,757 Finance 43-3011 Bill and Account Collectors 0.5% 10 37 $33,405 43-3031 Bookkeeping, Accounting, and Auditing Clerks 0.9% 57 67 $35,755 43-4011 Brokerage Clerks -0.3% 0 4 $43,576 13-1031 Claims Adjusters, Examiners, and Investigators 0.7% 6 22 $63,024 13-2041 Credit Analysts 0.8% 10 25 $63,877 Occupation & Industry Projections 25 Occupation Projections by Career Cluster SOC Code Title of Occupation Average
  • 72. Annual Growth Rate Average Annual Openings due to Growth Average Annual Openings due to Replacements 2010 Average Annual Wages 43-4041 Credit Authorizers, Checkers, and Clerks -0.3% 0 24 $39,291 13-2051 Financial Analysts 0.8% 17 41 $84,178 11-3031 Financial Managers 0.1% 2 43 $134,784 43-9041 Insurance Claims and Policy Processing Clerks 1.1% 10 25 $36,608 41-3021 Insurance Sales Agents 2.6% 36 28 $55,162 13-2053 Insurance Underwriters 0.8% 3 12 $60,403 13-2071 Loan Counselors 0.4% 1 5 $39,104 43-4131 Loan Interviewers and Clerks -1.3% 0 20 $37,336 13-2072 Loan Officers 0.6% 5 19 $60,237 43-4141 New Accounts Clerks -0.4% 0 9 $34,029 43-3051 Payroll and Timekeeping Clerks 1.3% 5 8 $38,605 13-2052 Personal Financial Advisors 2.6% 27 11 $82,930
  • 73. 13-2081 Tax Examiners, Collectors, and Revenue Agents 0.6% 2 5 $52,832 43-3071 Tellers -0.6% 0 76 $25,189 23-2093 Title Examiners, Abstractors, and Searchers -0.8% 0 1 $39,603 Government and Public Administration 13-1041 Compliance Officers, Except Agriculture, Construction, Health and Safety, and Transportation 1.4% 16 13 $57,970 43-4031 Court, Municipal, and License Clerks 0.6% 4 20 $32,510 11-9161 Emergency Management Directors 0.6% 0 0 $63,981 13-2061 Financial Examiners 0.7% 1 4 $83,283 11-9151 Social and Community Service Managers 1.4% 11 16 $61,048 19-3051 Urban and Regional Planners 0.7% 1 5 $60,611 Health Sciences 29-1061 Anesthesiologists 1.7% 2 2 $209,518 29-1181 Audiologists 2.0% 1 0 $62,046 29-2031 Cardiovascular Technologists and Technicians 2.4% 6 4 $53,102 29-1011 Chiropractors 2.1% 4 3 $103,314 31-9091 Dental Assistants 1.8% 15 16 $35,922 29-2021 Dental Hygienists 2.3% 15 12 $71,261 29-1021 Dentists, General 1.4% 6 13 $195,312 29-2032 Diagnostic Medical Sonographers 3.3% 8 3 $61,360 29-2051 Dietetic Technicians 1.3% 2 2 $27,373 29-1031 Dietitians and Nutritionists 1.8% 3 6 $57,429 29-2041 Emergency Medical Technicians and Paramedics 2.1% 22 19 $38,189 29-1062 Family and General Practitioners 1.8% 10 11 $156,582 29-1199 Health Diagnosing and Treating Practitioners, All Other 1.8% 0 0 $70,678
  • 74. 29-2799 Health Technologists and Technicians, All Other 2.0% 5 5 $40,955 26 Delaware 2020 Occupation Projections by Career Cluster SOC Code Title of Occupation Average Annual Growth Rate Average Annual Openings due to Growth Average Annual Openings due to Replacements 2010 Average Annual Wages 29-9799 Healthcare Practitioners and Technical Workers, All
  • 75. Other, Including Genetic Counselors 0.5% 0 2 $65,125 31-9799 Healthcare Support Workers, All Other 0.9% 3 4 $36,296 31-1011 Home Health Aides 2.6% 62 27 $24,419 29-1063 Internists, General 1.8% 5 5 $205,962 29-2061 Licensed Practical and Licensed Vocational Nurses 1.9% 48 62 $47,798 31-9011 Massage Therapists 3.0% 6 3 $57,824 29-2012 Medical and Clinical Laboratory Technicians 1.2% 4 6 $45,302 29-2011 Medical and Clinical Laboratory Technologists 0.4% 2 8 $60,674 11-9111 Medical and Health Services Managers 1.8% 18 23 $101,566 31-9092 Medical Assistants 2.0% 30 21 $29,994 31-9093 Medical Equipment Preparers 1.4% 3 3 $33,509 29-2071 Medical Records and Health Information Technicians 1.6% 8 9 $33,322 43-6013 Medical Secretaries 2.5% 119 57 $31,824 31-9094 Medical Transcriptionists -0.5% 0 3 $36,338 29-2033 Nuclear Medicine Technologists 1.4% 2 2 $68,099 31-1012 Nursing Aides, Orderlies, and Attendants 1.8% 108 71 $27,934 29-1064 Obstetricians and Gynecologists 1.7% 2 2 $222,186 29-9011 Occupational Health and Safety Specialists 1.1% 5 16 $62,275 29-9012 Occupational Health and Safety Technicians 2.0% 0 0 $39,146 31-2011 Occupational Therapist Assistants 2.1% 2 1 $56,139 29-1122 Occupational Therapists 2.2% 8 7 $69,805 29-2081 Opticians, Dispensing 1.3% 4 5 $33,405 29-1041 Optometrists 2.2% 3 4 $80,662 29-1065 Pediatricians, General 1.8% 2 2 $134,222 29-1051 Pharmacists 1.8% 13 16 $117,000
  • 76. 31-9095 Pharmacy Aides 0.8% 0 0 $19,406 29-2052 Pharmacy Technicians 2.5% 32 20 $27,539 31-2022 Physical Therapist Aides 3.1% 6 2 $25,626 31-2021 Physical Therapist Assistants 2.7% 5 2 $53,976 29-1123 Physical Therapists 2.9% 21 7 $86,362 29-1071 Physician Assistants 2.0% 7 6 $92,248 29-1069 Physicians and Surgeons, All Other 1.6% 21 24 $180,627 29-1081 Podiatrists 1.6% 2 2 $145,184 31-1013 Psychiatric Aides 1.6% 2 1 $31,138 29-1066 Psychiatrists 1.5% 2 2 $153,296 29-1124 Radiation Therapists 1.2% 1 1 $84,635 29-2037 Radiologic Technologists and Technicians 2.2% 26 16 $61,464 29-1125 Recreational Therapists 1.3% 1 2 $37,981 Occupation & Industry Projections 27 Occupation Projections by Career Cluster SOC Code Title of Occupation Average Annual Growth Rate Average Annual Openings due to
  • 77. Growth Average Annual Openings due to Replacements 2010 Average Annual Wages 29-1111 Registered Nurses 2.2% 250 189 $70,928 29-1126 Respiratory Therapists 2.6% 12 8 $59,758 29-1127 Speech-Language Pathologists 2.0% 9 7 $75,858 29-1067 Surgeons 1.8% 5 6 $224,286 29-2055 Surgical Technologists 1.5% 5 6 $41,371 29-1128 Therapists, All Other 3.7% 4 2 $48,443 Hospitality and Tourism 39-3091 Amusement and Recreation Attendants 1.2% 9 41 $18,866 35-3011 Bartenders 0.8% 15 62 $24,336 35-1011 Chefs and Head Cooks 0.2% 0 3 $49,088 35-3021 Combined Food Preparation and Serving Workers, Including Fast Food 1.4% 145 267 $17,763 35-2011 Cooks, Fast Food -0.3% 0 18 $19,219 35-2012 Cooks, Institution and Cafeteria -0.2% 0 47 $28,288 35-2014 Cooks, Restaurant 1.3% 53 85 $23,608 35-2015 Cooks, Short Order 0.4% 0 3 $23,483 35-3022 Counter Attendants, Cafeteria, Food Concession, and Coffee Shop 0.8% 12 111 $19,781 35-9011 Dining Room and Cafeteria Attendants and Bartender Helpers 1.1% 12 37 $18,013
  • 78. 35-9021 Dishwashers 0.7% 11 76 $18,782 39-3099 Entertainment Attendants and Related Workers, All Other 0.8% 1 3 $22,090 35-1012 First-Line Supervisors/Managers of Food Preparation and Serving Workers 1.0% 29 60 $35,610 37-1011 First-Line Supervisors/Managers of Housekeeping and Janitorial Workers -0.1% 0 7 $37,440 39-1021 First-Line Supervisors/Managers of Personal Service Workers 1.1% 12 26 $37,315 35-9099 Food Preparation and Serving Related Workers, All Other -1.1% 0 5 $20,613 35-2021 Food Preparation Workers 1.2% 20 60 $20,717 35-3041 Food Servers, Nonrestaurant 1.1% 5 13 $21,174 11-9051 Food Service Managers 1.8% 7 7 $68,016 39-3012 Gaming and Sports Book Writers and Runners 1.2% 2 5 $36,795 39-1011 Gaming Supervisors 1.6% 0 0 $51,043 35-9031 Hosts and Hostesses, Restaurant, Lounge, and Coffee Shop 0.4% 6 93 $18,117 43-4081 Hotel, Motel, and Resort Desk Clerks 0.7% 6 29 $21,237 37-2011 Janitors and Cleaners, Except Maids and Housekeeping Cleaners 0.8% 69 149 $24,357 11-9081 Lodging Managers 0.6% 1 4 $75,462 37-2012 Maids and Housekeeping Cleaners 0.9% 25 46 $19,802 13-1121 Meeting and Convention Planners 1.1% 3 5 $48,797 39-1012 Slot Key Persons -1.2% 0 0 $38,522 28 Delaware 2020
  • 79. Occupation Projections by Career Cluster SOC Code Title of Occupation Average Annual Growth Rate Average Annual Openings due to Growth Average Annual Openings due to Replacements 2010 Average Annual Wages 41-3041 Travel Agents 0.7% 1 2 $33,301 27-2023 Umpires, Referees, and Other Sports Officials 0.6% 2 7 $25,355 39-3031 Ushers, Lobby Attendants, and Ticket Takers 0.0% 0 16 $18,325 35-3031 Waiters and Waitresses 0.9% 68 364 $21,403 Human Services
  • 80. 39-9011 Child Care Workers 1.5% 39 76 $19,302 21-1021 Child, Family, and School Social Workers 1.4% 14 23 $39,333 19-3031 Clinical, Counseling, and School Psychologists 2.0% 10 14 $75,254 21-1798 Community and Social Service Specialists, All Other 1.7% 8 9 $33,925 39-3092 Costume Attendants 0.0% 0 1 $29,120 39-9031 Fitness Trainers and Aerobics Instructors 1.3% 30 36 $30,618 39-4021 Funeral Attendants 1.1% 2 7 $30,118 39-4831 Funeral Service Managers, Directors, Morticians, and Undertakers 2.1% 2 2 $70,034 39-5012 Hairdressers, Hairstylists, and Cosmetologists 2.3% 52 38 $29,515 51-6011 Laundry and Dry-Cleaning Workers 0.1% 1 16 $20,592 39-3093 Locker Room, Coatroom, and Dressing Room Attendants 0.6% 0 1 $21,050 39-5092 Manicurists and Pedicurists 2.7% 8 5 $24,898 21-1013 Marriage and Family Therapists 0.7% 2 5 $51,896 21-1022 Medical and Public Health Social Workers 1.5% 15 21 $44,304 21-1023 Mental Health and Substance Abuse Social Workers 2.0% 11 12 $39,562 21-1014 Mental Health Counselors 2.6% 6 4 $38,043 39-9021 Personal and Home Care Aides 2.0% 13 5 $20,842 39-9032 Recreation Workers 1.6% 16 15 $25,293 21-1015 Rehabilitation Counselors 1.3% 7 11 $33,904 39-9041 Residential Advisors 2.1% 2 2 $20,571 39-5093 Shampooers -0.3% 0 8 $17,930 21-1093 Social and Human Service Assistants 1.4% 11 16 $29,120 21-1029 Social Workers, All Other 0.5% 1 3 $56,680 21-1011 Substance Abuse and Behavioral Disorder Counselors 1.5% 3 4 $34,861
  • 81. Information Technology 11-3021 Computer and Information Systems Managers 0.4% 6 24 $130,541 15-1799 Computer Occupations, All Other 0.4% 1 4 $69,909 43-9011 Computer Operators -0.7% 0 5 $39,354 15-1131 Computer Programmers 0.2% 3 29 $78,853 15-1150 Computer Support Specialists 1.1% 24 55 $51,314 15-1121 Computer Systems Analysts 1.1% 34 56 $80,038 49-2011 Computer, Automated Teller, and Office Machine Repairers -0.1% 0 6 $31,762 Occupation & Industry Projections 29 Occupation Projections by Career Cluster SOC Code Title of Occupation Average Annual Growth Rate Average Annual Openings due to Growth Average Annual
  • 82. Openings due to Replacements 2010 Average Annual Wages 15-1141 Database Administrators 1.6% 10 10 $82,014 15-1179 Information Security Analysts, Web Developers, and Computer Network Architects 0.7% 8 15 $82,493 15-1142 Network and Computer Systems Architects and Administrators 2.3% 21 14 $68,640 15-1132 Software Developers, Applications 1.4% 28 19 $84,635 15-1133 Software Developers, Systems Software 1.0% 13 13 $98,114 Law, Public Safety and Security 23-1021 Administrative Law Judges, Adjudicators, and Hearing Officers -0.2% 0 2 $64,168 33-9011 Animal Control Workers 2.7% 8 6 $34,819 23-1022 Arbitrators, Mediators, and Conciliators 0.8% 0 1 $40,622 33-9091 Crossing Guards 0.3% 1 7 $28,870 33-2011 Fire Fighters 0.8% 3 10 $43,680 33-2021 Fire Inspectors and Investigators 0.9% 1 2 $47,320 33-1012 First-Line Supervisors/Managers of Police and Detectives 0.4% 1 10 $87,838 33-1099 First-Line Supervisors/Managers, Protective Service Workers, All Other 0.9% 3 11 $43,888 33-9031 Gaming Surveillance Officers and Gaming Investigators 1.2% 1 1 $28,933 23-1023 Judges, Magistrate Judges, and Magistrates 0.9% 2 3
  • 83. $130,187 23-1012 Judicial Law Clerks 0.4% 1 3 $39,603 23-1011 Lawyers 0.1% 2 58 $151,757 43-6012 Legal Secretaries -0.5% 0 15 $50,274 23-2099 Legal Support Workers, All Other 0.2% 0 3 $48,110 33-9092 Lifeguards, Ski Patrol, and Other Recreational Protective Service Workers 1.2% 10 50 $19,906 23-2011 Paralegals and Legal Assistants 0.8% 10 17 $51,210 33-3041 Parking Enforcement Workers 0.6% 0 1 $33,862 33-3051 Police and Sheriff's Patrol Officers 0.7% 12 48 $58,219 43-5031 Police, Fire, and Ambulance Dispatchers 0.9% 2 4 $39,437 33-9021 Private Detectives and Investigators 1.4% 1 1 $58,074 21-1092 Probation Officers and Correctional Treatment Specialists 2.1% 15 14 $46,010 33-9099 Protective Service Workers, All Other 1.2% 2 13 $28,621 33-9032 Security Guards 1.5% 51 52 $26,146 Manufacturing 51-3011 Bakers -0.1% 0 8 $24,419 51-7011 Cabinetmakers and Bench Carpenters -0.5% 0 8 $34,902 51-9191 Cementing and Gluing Machine Operators and Tenders -1.3% 0 0 $27,165 51-9011 Chemical Equipment Operators and Tenders -1.1% 0 8 $53,976 51-8091 Chemical Plant and System Operators -1.6% 0 4 $57,158 30 Delaware 2020
  • 84. Occupation Projections by Career Cluster SOC Code Title of Occupation Average Annual Growth Rate Average Annual Openings due to Growth Average Annual Openings due to Replacements 2010 Average Annual Wages 17-3022 Civil Engineering Technicians 0.3% 1 8 $40,643 51-9121 Coating, Painting, and Spraying Machine Setters, Operators, and Tenders 0.9% 0 1 $42,286 51-4011 Computer-Controlled Machine Tool Operators, Metal and Plastic 1.4% 1 2 $34,507 51-9021 Crushing, Grinding, and Polishing Machine Setters,
  • 85. Operators, and Tenders 0.9% 1 3 $24,461 51-9031 Cutters and Trimmers, Hand -0.6% 0 0 $29,786 51-9032 Cutting and Slicing Machine Setters, Operators, and Tenders -0.9% 0 4 $32,656 51-4031 Cutting, Punching, and Press Machine Setters, Operators, and Tenders, Metal and Plastic -0.7% 0 2 $32,115 51-4032 Drilling and Boring Machine Tool Setters, Operators, and Tenders, Metal and Plastic -1.3% 0 0 $29,099 49-2092 Electric Motor, Power Tool, and Related Repairers 0.9% 0 0 $39,832 17-3023 Electrical and Electronic Engineering Technicians 1.0% 3 6 $46,675 49-2094 Electrical and Electronics Repairers, Commercial and Industrial Equipment 0.9% 3 8 $61,672 51-4021 Extruding and Drawing Machine Setters, Operators, and Tenders, Metal and Plastic 2.8% 11 7 $29,598 51-9041 Extruding, Forming, Pressing, and Compacting Machine Setters, Operators, and Tenders -1.7% 0 6 $35,339 49-1011 First-Line Supervisors/Managers of Mechanics, Installers, and Repairers 0.8% 9 33 $64,126 51-1011 First-Line Supervisors/Managers of Production and Operating Workers 0.5% 8 18 $59,155
  • 86. 51-3092 Food Batchmakers -0.3% 0 1 $26,354 51-3093 Food Cooking Machine Operators and Tenders -0.2% 0 2 $22,422 51-9051 Furnace, Kiln, Oven, Drier, and Kettle Operators and Tenders 0.0% 0 1 $46,363 51-7021 Furniture Finishers 2.6% 1 1 $36,712 51-8092 Gas Plant Operators -1.0% 0 1 $64,792 51-4033 Grinding, Lapping, Polishing, and Buffing Machine Tool Setters, Operators, and Tenders, Metal and Plastic 0.9% 1 1 $30,930 51-9198 Helpers--Production Workers 1.3% 11 13 $22,360 17-3026 Industrial Engineering Technicians 0.7% 1 2 $48,755 49-9041 Industrial Machinery Mechanics 1.2% 9 13 $51,813 11-3051 Industrial Production Managers 1.0% 4 9 $103,064 51-9061 Inspectors, Testers, Sorters, Samplers, and Weighers 1.3% 15 25 $36,566 51-4041 Machinists 1.3% 7 9 $46,800 17-3027 Mechanical Engineering Technicians 0.5% 1 3 $50,170 51-9082 Medical Appliance Technicians 0.2% 0 2 $32,074 49-9062 Medical Equipment Repairers 2.1% 3 3 $47,299 49-9044 Millwrights 0.2% 0 3 $48,194 Occupation & Industry Projections 31 Occupation Projections by Career Cluster SOC Code Title of Occupation Average Annual Growth
  • 87. Rate Average Annual Openings due to Growth Average Annual Openings due to Replacements 2010 Average Annual Wages 51-9023 Mixing and Blending Machine Setters, Operators, and Tenders 3.9% 7 4 $41,080 51-4072 Molding, Coremaking, and Casting Machine Setters, Operators, and Tenders, Metal and Plastic 0.6% 0 2 $31,533 51-4081 Multiple Machine Tool Setters, Operators, and Tenders, Metal and Plastic 1.4% 2 3 $31,658 51-4012 Numerical Tool and Process Control Programmers 0.6% 0 0 $42,661 51-9083 Ophthalmic Laboratory Technicians 1.6% 0 1 $31,283 51-9122 Painters, Transportation Equipment 0.6% 1 3 $43,576 51-9196 Paper Goods Machine Setters, Operators, and Tenders - 1.6% 0 0 $32,365 51-8013 Power Plant Operators -0.5% 0 6 $68,307
  • 88. 49-9069 Precision Instrument and Equipment Repairers, All Other 0.2% 0 2 $50,086 51-9399 Production Workers, All Other 0.0% 0 4 $28,288 13-1023 Purchasing Agents, Except Wholesale, Retail, and Farm Products 0.2% 1 19 $67,454 51-9012 Separating, Filtering, Clarifying, Precipitating, and Still Machine Setters, Operators, and Tenders 0.2% 0 2 $34,320 51-6031 Sewing Machine Operators -0.6% 0 1 $25,750 51-6041 Shoe and Leather Workers and Repairers 0.0% 0 1 $45,760 51-8021 Stationary Engineers and Boiler Operators 0.3% 0 1 $56,035 51-2092 Team Assemblers 0.6% 6 17 $28,434 51-6093 Upholsterers 0.0% 0 2 $32,864 51-8031 Water and Liquid Waste Treatment Plant and System Operators 1.8% 6 8 $42,390 51-4121 Welders, Cutters, Solderers, and Brazers 2.3% 13 13 $42,349 51-7042 Woodworking Machine Setters, Operators, and Tenders, Except Sawing -1.0% 0 0 $27,082 Marketing, Sales and Service 41-3011 Advertising Sales Agents 1.2% 3 7 $53,456 13-2021 Appraisers and Assessors of Real Estate 0.6% 1 3 $63,461 41-2011 Cashiers 0.7% 90 552 $20,363 41-2021 Counter and Rental Clerks 1.0% 14 32 $28,038 41-9011 Demonstrators and Product Promoters 1.3% 4 8 $25,438 53-3031 Driver/Sales Workers 0.9% 12 26 $26,811 41-1012 First-Line Supervisors/Managers of Non-Retail Sales Workers 0.3% 3 22 $79,310
  • 89. 41-1011 First-Line Supervisors/Managers of Retail Sales Workers 0.6% 33 118 $42,411 27-1023 Floral Designers -1.0% 0 4 $24,960 27-1025 Interior Designers 1.6% 2 4 $46,384 13-1161 Market Research Analysts and Marketing Specialists 0.4% 8 48 $77,771 11-2021 Marketing Managers -0.2% 0 28 $139,422 27-1026 Merchandise Displayers and Window Trimmers 0.9% 3 10 $26,416 53-6021 Parking Lot Attendants 0.1% 0 12 $20,509 32 Delaware 2020 Occupation Projections by Career Cluster SOC Code Title of Occupation Average Annual Growth Rate Average Annual Openings due to Growth Average Annual
  • 90. Openings due to Replacements 2010 Average Annual Wages 41-2022 Parts Salespersons 1.1% 8 26 $27,914 43-3061 Procurement Clerks 0.2% 0 10 $35,173 11-9141 Property, Real Estate, and Community Association Managers 0.8% 5 12 $76,398 11-3061 Purchasing Managers -0.1% 0 5 $110,802 41-9021 Real Estate Brokers 1.1% 1 2 $76,627 41-9022 Real Estate Sales Agents 2.4% 38 31 $60,320 41-2031 Retail Salespersons 1.1% 174 446 $24,357 41-9799 Sales and Related Workers, All Other 1.6% 8 12 $45,781 41-9031 Sales Engineers 1.0% 1 3 $99,050 11-2022 Sales Managers 0.3% 2 20 $141,773 41-3099 Sales Representatives, Services, All Other 1.8% 47 71 $64,147 41-4012 Sales Representatives, Wholesale and Manufacturing, Except Technical and Scientific Products 1.3% 34 61 $61,922 41-4011 Sales Representatives, Wholesale and Manufacturing, Technical and Scientific Products 1.7% 30 39 $89,794 53-6031 Service Station Attendants 1.1% 1 3 $19,843 43-5081 Stock Clerks and Order Fillers -0.4% 0 114 $22,942 41-9041 Telemarketers 0.1% 1 9 $28,746 13-1022 Wholesale and Retail Buyers, Except Farm Products 1.4% 3 6 $49,442 Science, Technology, Engineering and Mathematics
  • 91. 15-2011 Actuaries 2.6% 4 7 $102,378 19-1021 Biochemists and Biophysicists 2.1% 3 3 $94,786 19-4021 Biological Technicians 0.2% 0 8 $42,744 19-4031 Chemical Technicians 0.6% 4 9 $53,102 19-2031 Chemists 0.0% 0 62 $87,360 15-1111 Computer and Information Research Scientists 1.6% 1 2 $85,717 19-3011 Economists 0.0% 0 1 $71,947 17-2071 Electrical Engineers 0.6% 6 21 $87,027 11-9041 Engineering Managers 0.4% 2 8 $132,434 19-4091 Environmental Science and Protection Technicians, Including Health 1.5% 2 5 $35,610 19-2041 Environmental Scientists and Specialists, Including Health 1.4% 6 12 $59,842 19-2042 Geoscientists, Except Hydrologists and Geographers 2.1% 1 1 $79,040 17-2111 Health and Safety Engineers, Except Mining Safety Engineers and Inspectors 2.1% 1 1 $81,224 19-2043 Hydrologists 1.9% 0 1 $59,384 17-2112 Industrial Engineers 0.6% 3 14 $88,046 19-2032 Materials Scientists 0.8% 1 3 $89,003 17-2141 Mechanical Engineers 1.4% 8 18 $80,579 Occupation & Industry Projections 33 Occupation Projections by Career Cluster SOC Code Title of Occupation Average
  • 92. Annual Growth Rate Average Annual Openings due to Growth Average Annual Openings due to Replacements 2010 Average Annual Wages 19-1022 Microbiologists 0.8% 1 2 $61,672 15-2031 Operations Research Analysts 0.8% 2 7 $68,661 19-2012 Physicists 1.8% 0 1 $82,118 19-4061 Social Science Research Assistants 1.1% 1 4 $33,238 43-9111 Statistical Assistants 0.9% 0 0 $45,802 15-2041 Statisticians 0.1% 0 5 $82,909 17-3031 Surveying and Mapping Technicians 0.8% 1 2 $41,579 43-5111 Weighers, Measurers, Checkers, and Samplers, Recordkeeping 1.3% 2 7 $28,226 Transportation, Distribution and Logistics 49-3011 Aircraft Mechanics and Service Technicians 0.2% 1 9 $58,469 53-3011 Ambulance Drivers and Attendants, Except Emergency
  • 93. Medical Technicians 2.3% 3 2 $24,648 49-3021 Automotive Body and Related Repairers 0.7% 2 8 $40,872 49-3023 Automotive Service Technicians and Mechanics 0.9% 20 58 $39,936 49-3031 Bus and Truck Mechanics and Diesel Engine Specialists 1.1% 6 10 $44,346 53-3022 Bus Drivers, School 1.2% 22 32 $26,437 53-3021 Bus Drivers, Transit and Intercity 0.6% 1 3 $28,330 53-5021 Captains, Mates, and Pilots of Water Vessels 1.2% 0 1 $81,536 43-5011 Cargo and Freight Agents 1.5% 0 1 $43,618 53-2012 Commercial Pilots 3.1% 3 4 $83,465 53-7011 Conveyor Operators and Tenders 1.4% 0 0 $33,904 43-5032 Dispatchers, Except Police, Fire, and Ambulance 2.8% 27 16 $43,014 49-2096 Electronic Equipment Installers and Repairers, Motor Vehicles -0.3% 0 1 $30,472 53-1021 First-Line Supervisors/Managers of Helpers, Laborers, and Material Movers, Hand 2.0% 11 10 $48,651 53-1031 First-Line Supervisors/Managers of Transportation and Material- Moving Machine and Vehicle Operators 1.0% 6 11 $55,661 53-7051 Industrial Truck and Tractor Operators 0.9% 10 28 $30,493 53-7062 Laborers and Freight, Stock, and Material Movers, Hand 1.1% 66 175 $25,688 13-1081 Logisticians 1.9% 10 9 $78,520 49-3042 Mobile Heavy Equipment Mechanics, Except Engines 1.5% 8 13 $44,262 53-3099 Motor Vehicle Operators, All Other 0.8% 4 8 $29,058 49-3051 Motorboat Mechanics 1.5% 1 2 $35,797
  • 94. 49-3053 Outdoor Power Equipment and Other Small Engine Mechanics 1.5% 2 2 $37,170 51-9111 Packaging and Filling Machine Operators and Tenders 0.7% 9 21 $31,533 53-7064 Packers and Packagers, Hand 0.7% 12 46 $26,437 43-5051 Postal Service Clerks -4.7% 0 5 $52,499 43-5052 Postal Service Mail Carriers 0.5% 6 32 $49,483 34 Delaware 2020 Occupation Projections by Career Cluster SOC Code Title of Occupation Average Annual Growth Rate Average Annual Openings due to Growth Average Annual Openings due to
  • 95. Replacements 2010 Average Annual Wages 43-5053 Postal Service Mail Sorters, Processors, and Processing Machine Operators -4.7% 0 2 $49,982 11-9131 Postmasters and Mail Superintendents -1.3% 0 1 $70,262 43-5061 Production, Planning, and Expediting Clerks 0.6% 5 19 $47,320 53-7081 Refuse and Recyclable Material Collectors 2.2% 12 15 $34,632 53-5011 Sailors and Marine Oilers 1.0% 0 1 $32,781 43-5071 Shipping, Receiving, and Traffic Clerks -0.2% 0 42 $30,098 53-7121 Tank Car, Truck, and Ship Loaders 0.0% 0 13 $56,888 53-3041 Taxi Drivers and Chauffeurs 1.2% 8 8 $27,872 49-3093 Tire Repairers and Changers 1.0% 2 6 $24,627 53-6051 Transportation Inspectors 1.5% 2 3 $38,792 53-6099 Transportation Workers, All Other 2.1% 1 1 $25,979 11-3071 Transportation, Storage, and Distribution Managers 0.0% 0 9 $119,662 53-3032 Truck Drivers, Heavy and Tractor-Trailer 1.7% 70 75 $41,163 53-3033 Truck Drivers, Light or Delivery Services 0.7% 18 52 $35,256 Occupation & Industry Projections 35 Industry Projections Besides projected demographic trends, the biggest determinant of employment growth rates is the
  • 96. position of the base year in the business cycle. The projection year in long-term projections is so far into the future that it must be assumed the economy will be at full employment then, but we always have more information about the base year. This is the primary reason for the increase in projected growth rates in this set of projections, as compared to the 2008-2018 projections. In 2008, average annual employment was near a business cycle peak (large job losses did not begin until the end of 2008). The 0.7 percent average annual growth rate projected through 2018, relatively low by recent standards, reflected that fact, along with a projected decline in the rate of population growth. For this set of projections, the projections of working-age population growth are similar, but the base year of 2010 found employment at a cyclical low. The 1.1 percent projected annual growth in employment through 2020 reflects an expected cyclical boost in job growth, with a period of above-normal job growth sometime during the recovery. At the present time (May 2012), that has not yet happened. If it turns out that all of the jobs lost during the recession were structural, and no period of above-normal growth is forthcoming, then the average annual job growth
  • 97. through the projection period will probably be closer to 0.7 percent. This business cycle effect is even more pronounced in particular industries. Construction, which is projected to grow faster than any other major industry sector, is a prime example. There are 5,510 net new jobs projected in Construction through 2020, an annual average growth rate of 2.5%, more than double the overall projected average gain. If this many jobs are added, it would still leave the number of jobs in Construction 4,500 below the peak hit in 2006. The projected growth comes from an expected return to more normal job numbers. In 2002, prior to the building boom, Construction jobs made up 5.4 percent of the total jobs in the state. By 2006, that had risen to 6.4 percent. In our current base year of 2010, Construction has only 4.5 percent of the state’s total jobs; our projection is for that to rise to 5.2 percent by 2020. By contrast, the business cycle appears to have little effect on Health Care and Social Assistance (particularly the health
  • 98. care components), currently Delaware’s largest industry by employment, and the industry with the greatest projected number of new jobs, by far. Over 13,000 net new jobs are projected for this industry by 2020; better than one in every four new jobs in the state are projected to be in Health Care and Social Assistance. This industry has exhibited steady growth for over 20 years, and as the baby boom generation increases its demands on the health care system, continued employment growth in Health Care and Social Assistance is as safe a bet as there is in these projections. Construction is projected to grow faster than any other major industry between 2010 and 2020. Industry Sector Net Job Growth Health Care and Social Assistance 13,140 Construction 5,510 Retail Trade 4,460
  • 99. Administrative and Waste Services 3,990 Accommodation and Food Services 3,350 Professional and Technical Services 3,120 Educational Services 2,720 Self-Employed Workers, Primary Job 2,400 Other Services, except Public Administration 2,150 Wholesale Trade 2,000 Transportation and Warehousing 1,370 Manufacturing 1,170 Government 1,120 Arts, Entertainment, and Recreation 1,110 Finance and Insurance 1,030 Information 800 Real Estate and Rental And Leasing 660 Mining 0 Agriculture, Forestry, and Fishing -20 Utilities -70 Management of Companies and Enterprises -1,620 Projected Net Job Growth by Industry Sector, 2020 36 Delaware 2020 Industry Projections Retail Trade, Delaware’s second- largest major industry sector in terms of employment, is projected to grow at a slightly slower rate than the overall economy. Some of the sub-sectors, such as furniture and home furnishing stores and building materials and garden supply stores,
  • 100. are projected to grow faster, due to business cycle effects. Health and personal care stores are projected to grow at an above-average pace due primarily to demographic factors. Finance and Insurance is Delaware’s third-largest employer and largest generator of value-added, contributing 37 percent of the state’s GDP in 2010. We project that employment will grow by about 1,000 jobs by 2020, a rate of growth only about one-quarter that of the overall economy. Projected job losses at banks (Credit intermediation and related activities) largely offset the gains projected for securities and investment firms and in insurance. Although small in magnitude, the projected job growth in Manufacturing is a major change in this round of projections. Except for a brief period in the late 1990’s, jobs in Manufacturing in Delaware have been steadily declining for over 20 years. That appears to finally be Construction Health Care and Social Assistance Administrative and Waste Services
  • 101. Wholesale Trade Information Professional and Technical Services Arts, Entertainment, and Recreation Real Estate and Rental and Leasing Transportation and Warehousing Other Services, except Public Administration Accommodation and Food Services Retail Trade Educational Services Manufacturing Government Finance and Insurance Agriculture, Forestry, and Fishing Utilities Management of Companies and Enterprises Projected Annual Rate of Growth by Industry Sector, 2010– 2020 -2.0% -1.5% -1.0% -0.5% 0.0% 0.5% 1.0% 1.5% 2.0% 2.5%
  • 102. 3.0% reversing, and we project a modest increase of nearly 1,200 jobs in Manufacturing by 2020. The biggest job losses projected in any major industry sector are in Management of Companies and Enterprises, where 1,620 fewer jobs are expected by 2020. This industry consists of holding companies and establishments whose main purpose is to manage their firm’s overall operations. In Delaware, it contains a few large employers and many holding companies with generally a single employee. The reliance on just a few major employers causes this sector’s employment to be volatile, as those firms’ fortunes wax and wane. 37Occupation & Industry Projections NAICS Industry 2010 2020 2010–2020 Change 2010–2020 Annual Growth Table 3: Industry Projections
  • 103. Total Employment, All Jobs 431,670 480,120 48,450 1.1% Total Self-Employed and Unpaid Family Workers, Primary Job 19,840 22,300 2,460 1.2% Self-Employed Workers, Primary Job 19,600 22,000 2,400 1.2% Unpaid Family Workers, Primary Job 240 300 60 2.3% 11 Agriculture, Forestry, Fishing 4,220 4,200 -20 -0.0% 111 Crop production 2,460 2,400 -60 -0.2% 112 Animal production 1,590 1,600 10 0.1% 115 Support activities for agriculture and forestry 170 200 30 1.6% 21 Mining 0 0 22 Utilities 2,090 2,020 -70 -0.3% 23 Construction 19,290 24,800 5,510 2.5% 236 Construction of buildings 4,810 6,700 1,890 3.4% 237 Heavy and civil engineering construction 2,580 3,100 520 1.9% 238 Specialty trade contractors 11,900 15,000 3,100 2.3% 31–33 Manufacturing 26,140 27,310 1,170 0.4% 311 Food manufacturing 8,840 9,000 160 0.2% 312 Beverage and tobacco product manufacturing 200 300 100 4.1% 313 Textile mills 600 550 -50 -0.9%
  • 104. 314 Textile product mills 100 80 -20 -2.2% 315 Apparel manufacturing 170 150 -20 -1.2% 321 Wood product manufacturing 310 280 -30 -1.0% 322 Paper manufacturing 860 740 -120 -1.5% 323 Printing and related support activities 670 600 -70 -1.1% 324 Petroleum and coal products manufacturing 290 700 410 9.2% 325 Chemical manufacturing 3,280 3,000 -280 -0.9% 326 Plastics and rubber products manufacturing 1,390 1,250 - 140 -1.1% 327 Nonmetallic mineral product manufacturing 630 750 120 1.8% 331 Primary metal manufacturing 560 530 -30 -0.5% 332 Fabricated metal product manufacturing 1,450 1,500 50 0.3% 333 Machinery manufacturing 590 700 110 1.7% 334 Computer and electronic product manufacturing 3,020 3,300 280 0.9% 335 Electrical equipment and appliance mfg. 630 1,000 370 4.7% 336 Transportation equipment manufacturing 740 1,200 460
  • 105. 5.0% 337 Furniture and related product manufacturing 760 680 -80 - 1.1% 339 Miscellaneous manufacturing 1,050 1,000 -50 -0.5% Delaware 2020 NAICS Industry 2010 2020 2010–2020 Change 2010–2020 Annual Growth Industry Projections 38 42 Wholesale Trade 12,500 14,500 2,000 1.5% 423 Merchant wholesalers, durable goods 4,500 5,200 700 1.5% 424 Merchant wholesalers, nondurable goods 5,500 6,000 500 0.9% 425 Electronic markets and agents and brokers 2,500 3,300 800 2.8% 44-45 Retail Trade 49,890 54,350 4,460 0.9% 441 Motor vehicle and parts dealers 6,270 7,000 730 1.1%