
Recommended
Recommended
More Related Content
Similar to 000 Class, this is Dr. Peter Trzop and I wanted to welcome .docx
Similar to 000 Class, this is Dr. Peter Trzop and I wanted to welcome .docx (6)
More from honey725342
More from honey725342 (20)
Recently uploaded
Recently uploaded (20)
000 Class, this is Dr. Peter Trzop and I wanted to welcome .docx
- 1. 0:00 Class, this is Dr. Peter Trzop and I wanted to welcome you to Unit VIII. And in this 0:06 Chapter, we talk about looking at innovation versus invention. And so a lot of 0:12 times the terms are interchangeably used, and that's not very accurate. Now they 0:16 are closely associated. Someone may invent a product, but then be innovative 0:22 and change it to a different way. For example you can look at say technologies 0:26 of circuit boards and how they were used for watches, or maybe they were 0:30 transformed into iPads, or tablets, or personal laptops. So there's a lot of 0:36 different uses for things. Or maybe we say, well I made this keyboard for the 0:40 Computer, but then I changed it this way to make it better, and that might be an 0:44 invention of the keyboard which was then later changed to innovation. It's an area 0:50 that you can look at, a lot of tech companies especially because
- 2. they always 0:53 are talking about how to be creative by inventing things or possibly even 0:59 Innovative. And you can fill it in a multiple number of companies that do this. 1:04 Having said that, there is information or reading sources that you can read in 1:09 order to explore this topic more. The biggest thing here in this Unit VIII is the 1:14 PowerPoint presentation. In PowerPoint presentations I always like to say they are 1:21 amazingly powerful, but they can also be very negative, if certain things are 1:26 not done. So what I would suggest to you, are several things that may help you do 1:31 better. Remember it is a presentation, but it's an academic presentation. Meaning 1:38 that when we look at it a slideshow or PowerPoint show, we want to make sure 1:43 that we're using sources to support our work. So if we first open up and we can 1:48 always, I tell students, imagine that you're looking at it on the projector and other 1:52 people are watching it or reading it. You have to always open
- 3. up with say, a cover slide, 1:58 or your introduction title page. And that allows people to say ok, this is what 2:03 it's about maybe, there's a picture there, and this is who's writing, 2:08 and what it's for. I would suggest people use a template, and that helps unify all 2:13 the slides. It also creates more of a optically appealing look. So be very careful 2:19 with type of structure, what type of slide formats you're going to use. Another thing 2:27 to is each slide should have a title, and then I always suggest that 2:32 you should use the picture on the left side, or right side, and use bullet points 2:36 on the opposite. This has the effect of allowing you to limit what you write, so 2:41 it's not boring, with a lot of cut and paste, or a lot of text. But at the same time it 2:47 allows the reader something visual to look at, that's 2:50 applicable to what you're writing about. It's also good to cite in them, it allows people
- 4. 2:55 to see things and understand that it is academic and supported. Some people 3:01 use writing notes underneath, you can always turn that feature on, and your 3:05 professor can look at that, there's nothing wrong with that. 3:08 Having said that, remember, people are going to be looking at these slides, and 3:13 you're doing it for an audience. And so you want to make sure that you covered 3:16 all the points to it, which this format talks about doing multiple slides, and 3:21 specifically what slides. But also at the end having some type of conclusion and 3:28 some type of list of sources. If you have any questions on how to do this, please reach 3:33 out to your course professor, or you even have the CSU Student Success Center. 3:37 There's a lot of ways to do quality PowerPoints, but what we want to avoid is the 3:43 idea of death by PowerPoint. And, if we all, if anyone has ever been through a PowerPoint 3:49 presentation that's not visually stimulating, or academic, or properly done it can be 3:54
- 5. literally death by PowerPoint. So there's a lot of good ideas here to do better, and 3:59 stronger work, just make sure that you really take the time to do that. If you 4:03 have any questions at all, 4:05 always feel free to reach out and get support. 4:07 Thank you, and best of luck. Reproduced with permission of the copyright owner. Further reproduction prohibited without permission. Benchmarking for quality Shah, Deven;Kleiner, Brian H Industrial Management; Mar/Apr 2011; 53, 2; ABI/INFORM Collection pg. 22 Reproduced with permission of the copyright owner. Further reproduction prohibited without permission. Reproduced with permission of the copyright owner. Further reproduction prohibited without permission.
- 6. Reproduced with permission of the copyright owner. Further reproduction prohibited without permission. Reproduced with permission of the copyright owner. Further reproduction prohibited without permission. News & Trends NEWSLINE... Continued on page 12 Processors Improve Profits with Benchmarking D airy processors can ask a lot of questions. For example: How can I know if my dairy operations are cost competi- tive? What areas should I focus on to improve margins and profits? How can I gain a market advantage on my competitors? These are a few questions that are likely to be answered with the use of benchmarks. Staying competitive means keeping one eye on your own company’s operational costs and the other on the costs of your peers in your industry. Financial and non-financial benchmarks A business benchmark is any type of measurement used to
- 7. compare some quantifiable component of a company’s activ- ity or performance. These benchmarks can be financial such as plant cost per gallon of milk, manufacturing cost per pound of cheese, distribution cost per case, EBITDA (earnings before interest, tax, depreciation and amortization) and so on. Benchmarks can also be non-financial such as inventory out-of-stock rates, gallons processed per hour and product yields. Business benchmarks provide valuable intelligence to help an enterprise make more enlightened business decisions. Benchmarks can be used to shape an enterprise’s business strat- egy by setting specific and quantifiable goals and monitoring the company’s performance relative to those goals. Benchmarking is also the process of using comparable data to determine who or what is the very best and what that standard is. The key to using benchmarks is gathering relevant comparable information to determine an average or best practices standard and then comparing your information to that standard. Sounds easy, but how do you gather the benchmark information? Some practical ways of securing this information in the dairy industry include: • Active involvement in industry trade organizations where information is shared • Review of available public company information • Engaging an industry consultant that has access to compa- rable information • Review of information available through the U.S. Department of Agriculture To make benchmarking beneficial, the development of the stan-
- 8. dards must use information that is truly comparable. Since many dairy products are somewhat homogeneous, benchmarking for the dairy industry can be very helpful. However, comparing infor- mation from a fluid plant that primarily bottles gallons and half gallons serving large grocery chains to a fluid plant producing large half-pint quantities serving schools may not be very helpful. To benefit from a benchmarking study, the key component is to obtain the most comparable company information. Strategies and decisions could be misdirected if the right information is not used. Companies with multiple locations producing similar products should also consider comparing benchmarks for each location. Detailed benchmarking information will produce more insightful results. Many companies know total plant costs, but it is more valuable to know unit costs for cost centers or depart- ments within the plant and even more valuable to know unit costs for expense categories with those departments. To illustrate the levels of detail, see the following example of a fluid milk plant: Best practices in a milk plant An example of best practice benchmarks for a fluid milk plant using cost center levels are: A fluid milk plant comparing its costs per gallon to the bench- marks in the table above would identify opportunities for improve- ment, whether it is process redesign, cost-cutting measures or pro-
- 9. ductivity reviews. Such an analysis provides management with the insight to focus in the areas more likely to produce positive results. Benchmarks can also be used as goals for managers to achieve, often tied to employee incentive plans. Costs Plant Cost Center Expense Total plant costs per gallon $.40 Bottling costs per gallon $.19 Bottling wages per gallon $.06 Bottling supplies per gallon $.03 Bottling repairs and maintenance $.02 Utilities $.04 Insurance $.01 Source: Herbein + Co. Cost Center Cost Per Gallon Receiving $.036 Pasteurization .044 Bottling .140 Cold Room .116 Plant Subtotal $.336
- 10. Selling .084 Delivery .332 Total Cost $.752 Source: Herbein + Co. Dairy Foods | October 201110 Newsline.indd 10Newsline.indd 10 9/27/11 11:38 AM9/27/11 11:38 AM News & Trends GELITA USA · Sioux City, IA · www.gelita.com · [email protected] GELITA® Collagen Proteins. Innovative and Healthy Ideas. The VITARCAL® concept consists of a holistic range of collagen proteins, specifi cally optimized for reducing energy density in calorie management products. Geliko™ Kosher gelatine products are certifi ed Kosher pareve by the Orthodox
- 11. Union. Health-conscious consumers know the OU logo stands for quality beyond question. The collagen peptides comprising FORTIGEL® are scientifi cally proven to stimulate joint cartilage regeneration. Financial benchmarks can also be useful in analyzing raw prod- uct and packaging costs. In a federally regulated market, class price differences based on location are readily determinable. However, financial benchmarks for other costs of milk procurement, such as premiums paid, could also prove beneficial. Benchmarking milk shrinkage amounts and fat content in the product are often enlight- ening. Benchmarks for the cost of containers and ingredients would indicate if you are purchasing these items at the best price. Data for butter, cheese plants You can find costs for butter, cheese and powder plants online. The U.S. Department of Agriculture (USDA), Washington, D.C., accu- mulates cost data from plants in California to establish and moni- tor allowances within the federal order pricing system.
- 12. Once the most relevant comparable data are obtained and the findings are analyzed in a benchmarking exercise, you will often realize your areas of strengths and weaknesses. Then, you determine ways to close any gap between what you and others, including competitors, are doing. For example, you may design a more efficient process to cut costs or explore ways to stream- line certain processes and functions. The ultimate goal is to bring your operation up to the stan- dard considered the best in your industry, likely to result in productivity gains and increased profitability. � By Carl Herbein, a certified public accountant and CEO and founding partner of Herbein + Co., Reading, Pa. He leads a team serving clients nationwide, including large multi-plant and small niche dairy processors. Giffords Dairy, Babcock Hall Named Grand Champions at World Dairy Expo Babcock Hall Dairy Plant, Madison, Wis., was selected as the Cheese and Butter Grand Champion, while Gifford’s Dairy, Skowhegan, Maine, was chosen as the Grade A & Ice Cream Grand Champion in this year’s Championship Dairy Product Contest, sponsored by the Wisconsin Dairy Products Association (WDPA) and Dairy Foods magazine. The contest received a record number of 705 entries for cheese, butter, fluid milk, yogurt, cottage cheese, ice cream, sour cream, sherbet, cultured milk, sour cream dips, whipping cream, dried whey and creative/innovative products from throughout the
- 13. United States. Judging was held Aug. 16 at UW-Madison’s Babcock Hall and Aug. 17-18 at the Madison Area Technical College (MATC) Culinary School, Madison, Wis. On Oct. 4, the contest’s auction was held at World Dairy Expo in Madison, Wis., where all category first-place winners were auctioned off. A portion of the proceeds went to fund the Dr. Robert Bradley Scholarship Fund, which is awarded annually to a deserving student pursuing a career in the dairy industry. Go to www.dairyfoods.com /Articles/Dairy_News to see a list of all of the first-place winners. Dairy Foods | October 201112 Newsline.indd 12Newsline.indd 12 9/27/11 11:38 AM9/27/11 11:38 AM Copyright of Dairy Foods is the property of BNP Media and its content may not be copied or emailed to multiple sites or posted to a listserv without the copyright holder's express written permission. However, users may print, download, or email articles for individual use.
- 14. MBA 5101, Strategic Management and Business Policy 1 Course Learning Outcomes for Unit VIII Upon completion of this unit, students should be able to: 1. Compare and contrast different strategic models. 1.1 Choose among traditional measures, such as ROI, and shareholder value measures, such as economic value added, to properly assess performance. 1.2 Identify the differences between successful and unsuccessful innovations. 1.3 Choose an appropriate structure and culture to support innovative ideas and products. 4. Analyze the processes for formulating corporate strategy. 4.1 Apply the benchmarking process to a function or an activity. 4.2 Explain the importance of lead users and market research as sources of new ideas. 5. Evaluate methods that impact strategy implementation, such as staffing, directing, and organizing. 5.1 Discuss the impact of problems with measuring performance.
- 15. 5.2 Assess the importance of product and process R&D for success within an industry. 5.3 Apply appropriate techniques and measures to manage new product development. Reading Assignment In order to access the following resource(s), click the link(s) below: College of Business – CSU. (2016, January 12). MBA5101 Unit VIII lesson video [YouTube video]. Retrieved from https://youtu.be/nvSmWApvFbE?list=PL08sf8iXqZn54RIuJs- skgp4omxG-UOu5 Click here to access a transcript of the video. Shah, D., & Kleiner, B. H. (2011). Benchmarking for quality. Industrial Management, 53(2), 22-25. Retrieved from https://libraryresources.columbiasouthern.edu/login?url=http://s earch.proquest.com.libraryresources.c olumbiasouthern.edu/docview/1197690924?accountid=33337 Processors Improve Profits with Benchmarking. (2011). Dairy Foods, 112(10), 10-12. Retrieved from https://libraryresources.columbiasouthern.edu/login?url=http://s earch.ebscohost.com/login.aspx? direct=true&db=bth&AN=67253161&site=ehost- live&scope=site
- 16. Unit Lesson Innovation is the key to a company’s sustained competitive advantage (Malone, 2009). In a world of intense global competition, quickly improving or bringing new products to the market is more important than ever. Most managers know this, but many also feel as though their performance needs to improve even though they know the real challenge for strategic management is sustained innovation (Valikangas & Merlyn, 2002). Developing a culture of innovation, adaptability, and flexibility is very important for a company. Several technology-driven companies, such as Zappo’s, Google, Microsoft, and Amazon.com, incorporate innovation into their daily processes. The process of kaizen, process improvement, was made famous by Japanese automobile manufacturers. UNIT VIII STUDY GUIDE Product Innovation Management https://youtu.be/nvSmWApvFbE?list=PL08sf8iXqZn54RIuJs- skgp4omxG-UOu5 https://online.columbiasouthern.edu/CSU_Content/Courses/Busi ness/MBA/MBA5101/15M/UnitVIII_LessonVideoTranscript.pdf https://libraryresources.columbiasouthern.edu/login?url=http://s earch.proquest.com.libraryresources.columbiasouthern.edu/docv iew/1197690924?accountid=33337 https://libraryresources.columbiasouthern.edu/login?url=http://s earch.proquest.com.libraryresources.columbiasouthern.edu/docv
- 17. iew/1197690924?accountid=33337 https://libraryresources.columbiasouthern.edu/login?url=http://s earch.ebscohost.com/login.aspx?direct=true&db=bth&AN=6725 3161&site=ehost-live&scope=site https://libraryresources.columbiasouthern.edu/login?url=http://s earch.ebscohost.com/login.aspx?direct=true&db=bth&AN=6725 3161&site=ehost-live&scope=site MBA 5101, Strategic Management and Business Policy 2 UNIT x STUDY GUIDE Title Innovative companies have some common characteristics. According to Carl Roger’s famous book, Diffusion of Innovations, positive attitude toward change, decentralized decision-making, complexity, informal structure, interconnectedness, organizational slack (unused resources), large size, and system openness are all common characteristics of innovative companies (Rogers, 1995). This is not to suggest this list is comprehensive or applicable to every company or organization, but this list does give some ideas and insight into innovative companies. Despite common belief, innovations and inventions are not the same. An invention is a product that is unique in its form, function, or formulation, making it patentable in many cases. On the other hand, an innovation refers to the overall process whereby an invention is transformed into a commercial product that can be sold profitably (Crawford & Di Benedetto,
- 18. 2008). Innovation can also be the creative use of an invention, development of a version of an invention, or change in function or synthesis of processes to obtain more changes. An example would the microprocessor being an invention, but the personal home computer being an innovation of the initial invention. In new product management, organizations complete a cycle called diffusion of innovation. In this cycle, a person or organization becomes aware of the existence of an innovation, makes a decision to try the innovation, acquires the innovation, and then comes to a level of success with the innovation. If this level of happiness is achieved, they chose to adopt or repeatedly use the innovation (Crawford & Di Benedetto, 2008). As time goes on, this cycle must be repeated due to competition of rival products and services. One could consider the innovation of the Apple line of products, such as the home computer, the iPod, the iPhone, and then the tablets. Now there are watches based on the same innovation cycle. Many managers believe that new product management is a combination of art and science. The art is essentially based on intuition, experience, hunch, or gut feeling. While debatable, many people see science fiction writers as a great source of inspiration for a vision of future products. This can be seen in the writing of Jules Verne, H. G. Wells, and Gene Roddenberry. These writers created a vision for future inventors and innovators. The science supports the art by using three tests critical to product innovation. The first test is the concept
- 19. test—to determine if the intended user really needs the proposed item. The second test used is the product test—to see if the item developed actually meets the need. Finally, the market test is used to see if there is an effective marketing plan. “These techniques and tools of marketing science were developed by marketing academics. They are currently used by some of the best firms in the world, yet they are not used nearly as much as they should be” (Crawford & Di Benedetto, 2008, p.18). Managers have a challenge to maintain sustained performance over time. Yet, they recognize that products mature and revenues decline. They also know that in order to replace those declining revenues, it is important to have a regular and steady stream of new products to introduce into the marketplace. Adding to the challenge, when the economy is good and profits are up, there is little interest in adding new products and innovations. In difficult times, when the economy is poor, companies typically are not able to spend the resources necessary to generate new products and innovations. “Therefore, the only way a corporation can maintain its growth is by launching new growth businesses when the core units are strong” (Robles, 2015, p. 123). Growth can take place with products, customer base, services, and new markets, both domestically and internationally. Launching new growth businesses when the core units are strong requires a great deal of discipline and strong leadership. It also requires caution for companies to analyze what will complement their business and what may not. Those firms who have an active and disciplined planning process developed as a core competency tend to reap the benefits. Through active SWOT
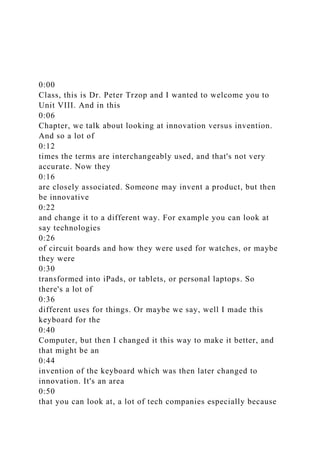
- 20. analysis activities, internal and external environmental scanning, and customer and stakeholder engagement, companies can manage in the present while simultaneously preparing product innovations for the future. Solar Junction, in partnership with NREL, has developed solar cells that reach a record-breaking 44 percent efficiency— meaning that more than 40 percent of the sunlight is converted into electrical energy. In this photo, an operator inspects a photolithography tool used to manufacture these solar cells (Solar Innovation, 2012). MBA 5101, Strategic Management and Business Policy 3 UNIT x STUDY GUIDE Title An innovative strategy is a timed sequence of internally consistent and conditional resource allocation decisions that are designed to fulfill an organization’s objectives. Implementation of an innovative strategy requires a company to have the unique characteristics of an innovative company. The areas in which a firm defines itself as innovative are through its implementation of three main components: risk taking, pro- activeness, and persistent commitment to innovation (Adams, Bessant, & Phelps, 2006).
- 21. The leadership of an innovative company has consistently been shown to have a strong vision. In implementing its strategy, senior leadership has shown itself to be flexible and tolerant. This is important because as new ideas are generated in the course of continuous internal and external environmental scanning, managers may find themselves at odds with resource allocation strategies identified in their initial planning. An innovative company’s leadership will weigh the advantages of this new information or ideas against the company vision and mission to determine if that resource allocation should be changed. They do this in a manner in which managers do not feel threatened. All managers know they have their chance to be heard, and that their ideas about new information will be seriously considered and sometimes implemented. Again, in an innovative company, the chief executive sets the vision for the firm's future. That vision is translated and maintained throughout the company by senior leadership in functional managers enabling all employees to understand and embrace that vision alongside the daily implementation of the strategic and operational plans. Managerial tolerance creates the right climate for the implementation stage of innovation where conflict resolution might be necessary. Successful innovative companies manage to effectively balance their ability to provide freedom to explore creative possibilities, but maintain sufficient control to manage innovation in an efficient fashion (Adams et al., 2006). Finally, once the company's corporate performance is measured, top management can decide if it should reformulate strategy, improve its implementation, or gather
- 22. more information about its competition (Wheelen, Hunger, Hoffman, & Bamford, 2015). This process should be a consistent and routine event. References Adams, R., Bessant, J., & Phelps, R. (2006). Innovation management measurement: A review. International Journal of Management Reviews, 8(1), 21-47. Crawford, M., & Di Benedetto, A. (2008). New products management (9th ed.). New York, NY: McGraw Hill/Irwin. Malone, M. S. (2009, May). Which are the most valuable companies in the new economy? Forbes ASAP, 212-214. Robles, E. (2015). How to identify disruptive new businesses. Review of Business & Finance Studies, 6(1), 121-130. Rogers, E. M. (1995). Diffusion of innovations (4th ed.). New York, NY: The Free Press. Solar Innovation. (2012). Solar innovation (8228992797) [Image]. Retrieved from https://commons.wikimedia.org/wiki/ File:Solar_Innovation (8228992797).jpg
- 23. Valikangas, L., & Merlyn, P. (2002). How market-based organization sustains organic innovation. Business Strategy Review, 3(13), 3-6. Wheelen, T. L., Hunger, J. D., Hoffman, A. N., & Bamford, C. E. (2015). Concepts in strategic management and business policy: Globalization, innovation, and sustainability (14th ed.). Boston, MA: Pearson. MBA 5101, Strategic Management and Business Policy 4 UNIT x STUDY GUIDE Title Suggested Reading In order to access the following resource(s), click the link(s) below: These articles provide further information regarding strategic management. Ahuja, V., Yang, J., & Shankar, R. (2010). Benchmarking framework to measure extent of ICT adoption
- 24. for building project management. Journal Of Construction Engineering & Management, 136(5), 538-545. Retrieved from https://libraryresources.columbiasouthern.edu/login?url=http://s earch.ebscohost.com/login.aspx? direct=true&db=bth&AN=49193808&site=ehost- live&scope=site Fombelle, P., Jarvis, C., Ward, J., & Ostrom, L. (2012). Leveraging customers' multiple identities: Identity synergy as a driver of organizational identification. Journal Of The Academy Of Marketing Science, 40(4), 587-604. Retrieved from https://libraryresources.columbiasouthern.edu/login?url=http://s earch.ebscohost.com/login.aspx?direc t=true&db=bth&AN=75231245&site=ehost-live&scope=site https://libraryresources.columbiasouthern.edu/login?url=http://s earch.ebscohost.com/login.aspx?direct=true&db=bth&AN=4919 3808&site=ehost-live&scope=site https://libraryresources.columbiasouthern.edu/login?url=http://s earch.ebscohost.com/login.aspx?direct=true&db=bth&AN=4919 3808&site=ehost-live&scope=site https://libraryresources.columbiasouthern.edu/login?url=http://s earch.ebscohost.com/login.aspx?direct=true&db=bth&AN=7523 1245&site=ehost-live&scope=site https://libraryresources.columbiasouthern.edu/login?url=http://s earch.ebscohost.com/login.aspx?direct=true&db=bth&AN=7523 1245&site=ehost-live&scope=site