Download as PDF, PPTX


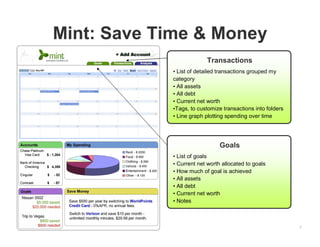
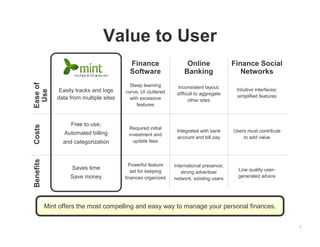
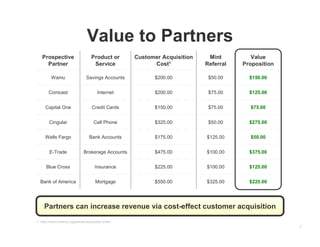
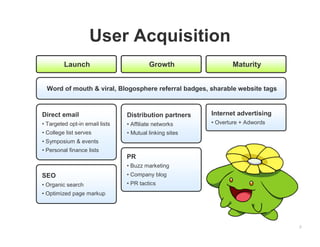
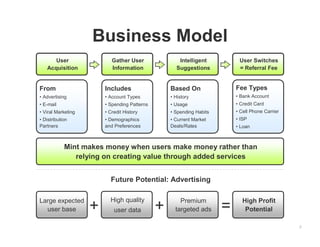
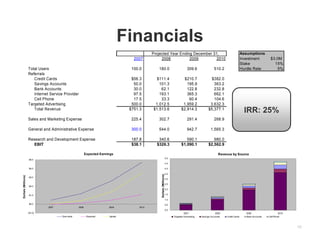
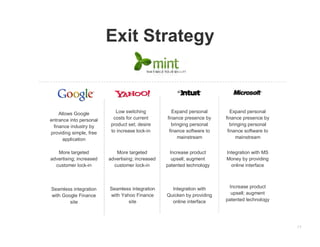
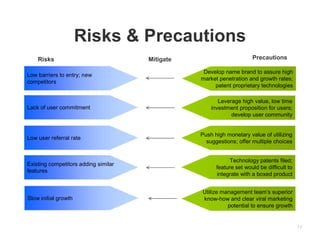
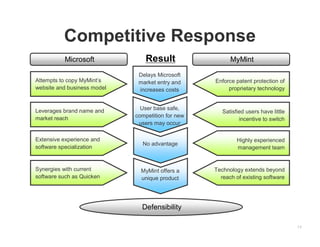

This document summarizes Mint, a personal finance management tool. It allows users to track spending, savings goals, and net worth. Mint makes money through referral fees when users switch financial products based on Mint's recommendations. The document outlines Mint's market size and opportunity, competitors, value proposition, user and partner acquisition strategies, business model, and projected financials. It expects rapid user and revenue growth as it acquires users through viral and partnership channels and converts them through intelligent suggestions.


![Getting Started with Apache Spark: Big Data Made Simple [Free Meetup]](https://cdn.slidesharecdn.com/ss_thumbnails/apachesparkgettingstarted-260203175547-8361bcc3-thumbnail.jpg?width=640&height=640&fit=bounds)
