SlideShare a Scribd company logo
1 of 131
The purpose of this initial paper is to briefly describe your
search strategies when identifying two articles that pertain to an
evidence-based practice topic of interest. Mine is on Avoiding
Hospital Readmissions. I will be focusing as an individual on
examining the sources of knowledge that contribute to
professional nursing practice qualitative or quantitative design?
Apply research principles to the interpretation of the content of
published research studies. "What is the number of trends in 30-
day post-discharge mortality among beneficiaries after the
implementation of HRRP -- period 3 and 4, for mortality rate in
myocardial infarctions?" (Wadhera, et al., 2018)
Clinical Question:
A. Describe problem
b. Significance of problem in terms of outcomes or statistics
c. Your PICOT question in support of the group topic
d. Purpose of your paper
B. Levels of Evidence
a. Type of question asked
b. Best evidence found to answer question
C. Search Strategy
a. Search terms
b. Databases used (you may use Google Scholar in addition to
the library databases; start with the Library)
c. Refinement decisions made
d. Identification of two most relevant articles
D. Format
a. Correct grammar and spelling
b. Use of headings for each section
c. Use of APA format (sixth edition)
d. Page length: three to four pages
Clinical Question
45 points 28%1. Problem is described. What is the focus of your
group’s work? 2. Significance of the problem is described. What
health outcomes result from your problem? Or what statistics
document this is a problem? You may find support on websites
for government or professional organizations. 3. What is your
PICOT question? 4. Purpose of your paper. What will your
paper do or describe? This is similar to a problem statement.
“The purpose of this paper is to . . .”
Levels of Evidence
20 points 13% 1. What type of question are you asking (therapy,
prognosis, meaning, etc.)? 2. What is the best type of evidence
to be found to answer that question (e.g., RCT, cohort study,
qualitative study)?
Search Strategy
65 points 41% 1. Search topic(s) provided. What did you use
for search terms? 2. What database(s) did you use? Link your
search with the PICOT question described above. 3. As you did
your search, what decisions did you make in refinement to get
your required articles down to a reasonable number for review?
Were any limits used? If so, what? 4. Identify the two most
relevant and helpful articles that will provide guidance for your
next paper and the group’s work. Why were these two selected?
Format
30 points 18% 1. Correct grammar and spelling 2. Use of
headings for each section: Clinical Question, Level of Evidence,
Search Strategy, Conclusion 3. APA format (sixth ed.) 4. Paper
length: three to four pages
Total worth 160 points
DIRECTIONS AND ASSIGNMENT CRITERIA Assign ment
Criteria Points % Description Clinical Question 45
28 1. Problem is described. What is the focus of your group’s
work? 2. Significance of the problem is
described. What health outcomes result from your problem? Or
what statistics document this is a
problem? You may find support on websites for government or
professional organizations. 3. What is
your PICOT question? 4. Purpose of your paper. What will your
paper do or describe? This is similar to a
problem statement. “The purpose of this paper is to . . .” Levels
of Evidence 20 13 1. What type of
question are you asking (therapy, prognosis, meaning, etc.)? 2.
What is the best type of evidence to be
found to answer that question (e.g., RCT, cohort study,
qualitative study)? Search Strategy 65 41 1.
Search topic(s) provided. What did you use for search terms? 2.
What database(s) did you use? Link your
search with the PICOT question described above. 3. As you did
your search, what decisions did you make
in refinement to get your required articles down to a reasonable
number for review? Were any limits
used? If so, what? 4. Identify the two most relevant and helpful
articles that will provide guidance for
your next paper and the group’s work. Why were these two
selected? Format 30 18 1. Correct grammar
and spelling 2. Use of headings for each section: Clinical
Question, Level of Evidence, Search Strategy,
Conclusion 3. APA format (sixth ed.) 4. Paper length: three to
four pages
The purpose of
this initial paper is to briefly describe your search strategies
when identifying two articles
that pertain to an evidence
-
based practice topic of interest
. Mine is on
Avoiding Hospital
Readmissions. I
will be focusing as an individual on
e
xamin
ing
the sources of knowledge that contribute to professional
nursing practic
e
qualitative or quantitative design?
A
pply research principles to the interpretation of the
content of published research studies.
"What is the number of
trends in 30
-
day post
-
discharge mortality
among beneficiaries after the implementation of HRRP
--
period 3 and 4, for mortality rate in myocardial
infarctions?" (Wadhera, et al., 2018)
Clinical Question
:
A
. Describe problem
b. Significance of problem in terms of outcomes or statistics
c. Your PICOT question in support of the group to
pic
d. Purpose of your paper
B
. Levels of Evidence
a. Type of question asked
b. Best evidence found to answer question
C.
Search Strategy
a. Search terms
b. Databases used (you may use Google Scholar in addition to
the library databases; start with the
Lib
rary)
c. Refinement decisions made
d. Identification of two most relevant articles
D.
Format
a. Correct grammar and spelling
b. Use of headings for each section
c. Use of APA format (sixth edition)
The purpose of this initial paper is to briefly describe your
search strategies when identifying two articles
that pertain to an evidence-based practice topic of interest.
Mine is on Avoiding Hospital Readmissions. I
will be focusing as an individual on examining the sources of
knowledge that contribute to professional
nursing practice qualitative or quantitative design? Apply
research principles to the interpretation of the
content of published research studies. "What is the number of
trends in 30-day post-discharge mortality
among beneficiaries after the implementation of HRRP -- period
3 and 4, for mortality rate in myocardial
infarctions?" (Wadhera, et al., 2018)
Clinical Question:
A. Describe problem
b. Significance of problem in terms of outcomes or statistics
c. Your PICOT question in support of the group topic
d. Purpose of your paper
B. Levels of Evidence
a. Type of question asked
b. Best evidence found to answer question
C. Search Strategy
a. Search terms
b. Databases used (you may use Google Scholar in addition to
the library databases; start with the
Library)
c. Refinement decisions made
d. Identification of two most relevant articles
D. Format
a. Correct grammar and spelling
b. Use of headings for each section
c. Use of APA format (sixth edition)
Running head: 1
NURSING 2
Nursing
Vanessa Noa
Grand Canyon University
05/10/2020
Nursing
Patient safety is a critical issue in care delivery in skilled
nursing facilities (SNFs). Given the complexity arising from the
prevention of falls, SNFs need to take better fall prevention
practices to enhance the quality of care service delivery. The
practices to prevent falls for short-term rehabilitative stays
should be tailored by skilled nursing staff and successfully
implemented and sustained to align with healthcare priorities
that work best for the patients. Different researches by different
scholars on patient’s fall give detailed literature on how skilled
nursing facilities improve the situation through nurse education
to ensure the safety of patients in nursing home healthcare.
Comparison of Research Question
Studies by the eight authors on patient safety as a crucial
issue in nursing home healthcare focused on why patient falls
are a dominant issue and what can be done to solve the problem.
For instance, Katrina, H. (2018), in his research, wants to get
detailed knowledge of why falls remain an issue and complex
issues and what measures can resolve the issue undermining
patient safety. Katrina, H. (2018), Jang and Lee, (2015); and
Uymaz and Nahcivan, (2016) their research question studies on
how education program is a solution to this challenging issue.
Generally, the research by these eight different authors base
their question on factors leading to falls and measures to
prevent patient falls.
The research questions for the eight studies seeks to
research on evidence-based interventions that have shown
effectiveness in minimizing patient falls in nursing home
healthcare. Kuhlenschmidt et al., (2016) and Minnier et al.,
(2019) base his research question on falls among cancer patients
who need early interventions to help them from getting into the
problem. According to the questions in comparison, the problem
statement is how healthcare specialists can intervene by
exhibiting a positive attitude toward teamwork to find solutions
to patient falls.
Comparison of Sample Populations
The eight researches recruit its sample from populations
sharing the same charcate4ristics to give reliable and valid
findings. In all eight samples, the sample sizes are
recommendable because they do not exceed 1000, in which the
samples are drawn between 50 to 100 participants. The
statistical population of the researches provides researchers
with a base for drawing statistical inferences based on a random
sample taken from the population (Zhao et al., 2019). For
instance, the generalization of patient falls in all researches is
based on what causes exists now, ever existed, or what will
exist in the future in skilled nursing facilities.
General Findings
The formation of teams, offering education, improved
education on falls among community older people, and
interprofessional community services can help in combating
patient falls within skilled nursing facilities. These methods for
fall prevention involve managing of underlying fall risk factors
of patients (Howard, 2018). The methods focus on education as
a training tool for nurses and patients on how the problem takes
place and how it can be prevented.
Comparison of The Limitations of The Study
Characteristics of design or methodology impact and influence
the findings’ interpretation from the research, hence leading to
a significant limitation. The characteristics are constraints on
generalizability and applications of the findings to practice (S.
R., 2016). Also, the study limitations are its flaws resulting
from the unavailability of resources, small sample size, and
flawed methodologies (Murray, 2016). There is no evident study
that is flawless or includes all likely aspects. Therefore, the
listing of the limitations reflects transparency and honesty in
findings. These limitations undermine the answering of the
research questions; hence the study cannot address them
correctly.
Accessing the target population is a limitation. The studies
depended on accessing patients, skilled nursing facilities, and
the authority to access confidential information of patients. In
the healthcare setting, patient confidentiality and privacy is
critical and strictly followed. In the data collection section, this
issue may undermine getting reliable and valid results that can
display a comparison on answering the research question.
Further, inadequate literature review limits the reliability of the
research (Sullivan, et al., 2015). Literature in any research
forms a basis for the researcher to set a strong foundation for
achieving the objectives. If literature is unavailable, the
research problem becomes narrow and cannot guarantee to solve
the problem under study.
Conclusion and Recommendations
Prevention of falls in the elderly long-term care facilities is
critical to patient safety.
Elderly is vulnerable to falls and fall-related injuries within
skilled nursing facilities. The implementation of educational
programs to equip nurses with detailed knowledge on curbing
patient falls will improve patient safety. Among pediatric
patients, evidence-based interventions can help in preventing
falls. Studies have evaluated the effectiveness of interventions
and strategies on the incidence of falls in nursing home
patients. Giving skills and motivating staff is essential in long-
term care facilities since nurses learn how to follow guidelines
in maintaining patient safety. It is recommendable that;
I. Involvement of pediatric staff to influence the program’s
success
II. Inspire nurses to develop a positive attitude to attain
interprofessional teamwork events’ goals
III. Educate patients on medications to assist in reducing the
risk of falls
IV. Customize education program to keep with the perceived
risk of falls among patients
References
Howard, K. (2018). Improving Fall Rates Using Bedside
Debriefings and Reflective Emails: One Unit’s Success
Story. MEDSURG Nursing, 27(6), 388–391.
Jang, M., & Lee, Y. (2015). The Effects of an Education
Program on Home Renovation for Fall Prevention of Korean
Older People. Educational Gerontology, 41(9), 653–669.
https://doi.org/10.1080/03601277.2015.1033219
Kuhlenschmidt, M. L., Reeber, C., Wallace, C., Yanwen Chen,
Barnholtz-Sloan, J., & Mazanec, S. R. (2016). Tailoring
Education to Perceived Fall Risk in Hospitalized Patients with
Cancer: A Randomized, Controlled Trial. Clinical Journal of
Oncology Nursing, 20(1), 84–89.
https://doi.org/10.1188/16.CJON.84-89
Minnier, W., Leggett, M., Persaud, I., & Breda, K. (2019). Four
Smart Steps: Fall Prevention for Community-Dwelling Older
Adults. Creative Nursing, 25(2), 169–175.
https://doi.org/10.1891/1078-4535.25.2.169
Murray, E. (2016). Quality Improvement. Implementing a
Pediatric Fall Prevention Policy and Program. Pediatric
Nursing, 42(5), 256–259.
Sullivan, K., Charrette, A., Massey, C., Bartlett, D., Walker, C.,
Bond, I., … Fong, J. J. (2015). Interprofessional education with
a community fall prevention event. Journal of Interprofessional
Care, 29(4), 374–376.
https://doi.org/10.3109/13561820.2014.969834
Uymaz, P. E., & Nahcivan, N. O. (2016). Evaluation of a nurse-
led fall prevention education program in Turkish nursing home
residents. Educational Gerontology, 42(5), 299–309.
https://doi.org/10.1080/03601277.2015.1109403
Zhao, Y. (Lucy), Bott, M., He, J., Kim, H., Park, S. H., &
Dunton, N. (2019). Evidence on Fall and Injurious Fall
Prevention Interventions in Acute Care Hospitals. Journal of
Nursing Administration, 49(2), 86–92.
https://doi.org/10.1097/NNA.0000000000000715
Association of the Hospital Readmissions Reduction Program
With Mortality Among Medicare Beneficiaries Hospitalized
for Heart Failure, Acute Myocardial Infarction, and Pneumonia
Rishi K. Wadhera, MD, MPP, MPhil; Karen E. Joynt Maddox,
MD, MPH; Jason H. Wasfy, MD, MPhil; Sebastien Haneuse,
PhD;
Changyu Shen, PhD; Robert W. Yeh, MD, MSc
IMPORTANCE The Hospital Readmissions Reduction Program
(HRRP) has been associated with
a reduction in readmission rates for heart failure (HF), acute
myocardial infarction (AMI), and
pneumonia. It is unclear whether the HRRP has been associated
with change in patient mortality.
OBJECTIVE To determine whether the HRRP was associated
with a change in patient mortality.
DESIGN, SETTING, AND PARTICIPANTS Retrospective
cohort study of hospitalizations for HF,
AMI, and pneumonia among Medicare fee-for-service
beneficiaries aged at least 65 years
across 4 periods from April 1, 2005, to March 31, 2015. Period
1 and period 2 occurred before
the HRRP to establish baseline trends (April 2005-September
2007 and October
2007-March 2010). Period 3 and period 4 were after HRRP
announcement (April 2010 to
September 2012) and HRRP implementation (October 2012 to
March 2015).
EXPOSURES Announcement and implementation of the HRRP.
MAIN OUTCOMES AND MEASURES Inverse probability–
weighted mortality within 30 days of
discharge following hospitalization for HF, AMI, and
pneumonia, and stratified by whether
there was an associated readmission. An additional end point
was mortality within 45 days of
initial hospital admission for target conditions.
RESULTS The study cohort included 8.3 million
hospitalizations for HF, AMI, and pneumonia,
among which 7.9 million (mean age, 79.6 [8.7] years; 53.4%
women) were alive at discharge.
There were 3.2 million hospitalizations for HF, 1.8 million for
AMI, and 3.0 million for pneumonia.
There were 270 517 deaths within 30 days of discharge for HF,
128 088 for AMI, and 246 154 for
pneumonia. Among patients with HF, 30-day postdischarge
mortality increased before the
announcement of the HRRP (0.27% increase from period 1 to
period 2). Compared with this
baseline trend, HRRP announcement (0.49% increase from
period 2 to period 3; difference in
change, 0.22%, P = .01) and implementation (0.52% increase
from period 3 to period 4;
difference in change, 0.25%, P = .001) were significantly
associated with an increase in
postdischarge mortality. Among patients with AMI, HRRP
announcement was associated with a
decline in postdischarge mortality (0.18% pre-HRRP increase vs
0.08% post-HRRP
announcement decrease; difference in change, −0.26%; P = .01)
and did not significantly change
after HRRP implementation. Among patients with pneumonia,
postdischarge mortality was
stable before HRRP (0.04% increase from period 1 to period 2),
but significantly increased after
HRRP announcement (0.26% post-HRRP announcement
increase; difference in change, 0.22%,
P = .01) and implementation (0.44% post-HPPR implementation
increase; difference in change,
0.40%, P < .001). The overall increase in mortality among
patients with HF and pneumonia was
mainly related to outcomes among patients who were not
readmitted but died within 30 days of
discharge. For all 3 conditions, HRRP implementation was not
significantly associated with an
increase in mortality within 45 days of admission, relative to
pre-HRRP trends.
CONCLUSIONS AND RELEVANCE Among Medicare
beneficiaries, the HRRP was significantly
associated with an increase in 30-day postdischarge mortality
after hospitalization for HF and
pneumonia, but not for AMI. Given the study design and the
lack of significant association of
the HRRP with mortality within 45 days of admission, further
research is needed to
understand whether the increase in 30-day postdischarge
mortality is a result of the policy.
JAMA. 2018;320(24):2542-2552. doi:10.1001/jama.2018.19232
Editorial page 2539
Supplemental content
Author Affiliations: Author
affiliations are listed at the end of this
article.
Corresponding Authors: Robert W.
Yeh, MD, MSc, and Changyu Shen,
PhD, Smith Center for Outcomes
Research in Cardiology, Beth Israel
Deaconess Medical Center, 375
Longwood Ave, Boston, MA 02215
([email protected]).
Research
JAMA | Original Investigation
2542 (Reprinted) jama.com
© 2018 American Medical Association. All rights reserved.
https://jama.jamanetwork.com/article.aspx?doi=10.1001/jama.2
018.19232&utm_campaign=articlePDF%26utm_medium=article
PDFlink%26utm_source=articlePDF%26utm_content=jama.2018
.19232
https://jama.jamanetwork.com/article.aspx?doi=10.1001/jama.2
018.19325&utm_campaign=articlePDF%26utm_medium=article
PDFlink%26utm_source=articlePDF%26utm_content=jama.2018
.19232
mailto:[email protected]
http://www.jama.com/?utm_campaign=articlePDF%26utm_medi
um=articlePDFlink%26utm_source=articlePDF%26utm_content
=jama.2018.19232
T he Hospital Readmissions Reduction Program (HRRP)was
established under the Affordable Care Act (ACA) in2010 and
required that the Centers for Medicare & Med-
icaid Services (CMS) impose financial penalties on hospitals
with higher-than-expected 30-day readmission rates for pa-
tients with heart failure, acute myocardial infarction, and pneu-
monia, beginning in 2012.1 After the announcement of the
HRRP, readmission rates among Medicare beneficiaries de-
clined for target conditions nationwide.2,3 Recently, how-
ever, policy makers and physicians have raised concern that
the HRRP may have also had unintended consequences
that adversely affected patient care, potentially leading to in-
creased mortality.4,5 For instance, the financial penalties im-
posed by the HRRP may have inadvertently pushed some phy-
sicians to avoid indicated readmissions, potentially diverted
hospital resources and efforts away from other quality im-
provement initiatives, or worsened quality of care at resource-
poor hospitals that are often penalized by the program. How-
ever, it is also possible that the same mechanisms by which
some hospitals have reduced readmissions, such as im-
proved coordination and transitions of care, resulted in reduc-
tions in mortality.
Understanding whether the HRRP has been associated
with changes in mortality at the patient level is important as
policy makers evaluate this program, particularly given the
ongoing expansion of the HRRP to include other conditions6
and the almost $2 billion in financial penalties that have been
imposed on hospitals since 2012.7 This study aims to answer
3 questions. First, compared with past trends, was the
announcement or implementation of the HRRP associated
with a change in mortality within 30 days of discharge fol-
lowing hospitalization for heart failure, acute myocardial
infarction, or pneumonia? Second, was the HRRP associated
with a change in the distribution of patients who experienced
death and no readmission, readmission and no death, read-
mission and death, or no death and no readmission during
the 30 days after discharge? Third, was the HRRP associated
with a change in mortality within 45 days of hospital admis-
sion for target conditions?
Methods
Institutional review board approval, including waiver of the
requirement of participant informed consent because the data
were deidentified, was provided by the Beth Israel Deacon-
ess Medical Center.
Study Cohort
We used Medicare Provider Analysis and Review files to iden-
tify hospital admissions and discharges at short-term acute care
hospitals from April 1, 2005, through March 31, 2015, with
a principal discharge diagnosis of heart failure, acute myo-
cardial infarction, or pneumonia. Study cohorts were de-
fined using International Classification of Diseases, Ninth
Revision, Clinical Modification codes used in the publicly re-
ported CMS readmission and mortality measures.8-10 We in-
cluded Medicare beneficiaries aged 65 years or older in the
analysis. We excluded patients who were discharged against
medic al advice, were not enrolled in Medic are fee-for-
service for at least 30 days after discharge (absent death),
or were enrolled in Medicare fee-for-service for less than 1
year before hospitalization. Transfers to other hospitals were
linked to a single index hospitalization. To examine 30-day
postdischarge outcomes, we also excluded patients who
died during hospitalization. Comorbidities were defined using
CMS hierarchical condition categories based on Medicare
claims up to 1 year before hospitalization.11 Specifically, we
used
covariates in the CMS risk-adjustment models for heart fail-
ure, acute myocardial infarction, and pneumonia,12-14 as has
been done in previous studies.2,15 The race/ethnicity of all pa-
tients was identified based on claims files and was desig-
nated into the following fixed categories: white, black, or other.
Race/ethnicity was included as a covariate in the analysis be-
cause it is associated with mortality for target conditions.16
Study Periods
We identified 4 nonoverlapping study periods of equal dura-
tion for index hospitalization. We chose to evaluate differ-
ences in outcomes between time periods, rather than annual
trends, for 2 reasons. First, we were interested in changes in
outcomes among time periods defined by their relationship to
the announcement and implementation of the HRRP, rather
than within-period trends. Second, this strategy avoids as-
sumptions on how the HRRP imposes its effect on different pa-
tient groups (eg, assumptions on main effects and interaction
terms) and of a linear relationship between outcomes and time
and continuous confounders in a conventional logistic or mul-
tinominal regression model.
We identified 2 study periods before the HRRP was estab-
lished to examine baseline trends in outcomes. The first study
period included hospitalizations from April 2005 to Septem-
ber 2007 (period 1) and the second included hospitalizations
from October 2007 to March 2010 (period 2). Two periods af-
ter the HRRP was established were also included: 1 following
the initial announcement of HRRP with passage of the ACA
from April 2010 through September 2012 (period 3) and the
other between October 2012 and March 2015 (period 4), which
Key Points
Question Was the announcement and implementation of the
Hospital Readmissions Reduction Program (HRRP) associated
with
an increase in patient-level mortality?
Findings In this retrospective cohort study that included
approximately 8 million Medicare beneficiary fee-for-service
hospitalizations from 2005 to 2015, implementation of the
HRRP
was associated with a significant increase in trends in 30-day
postdischarge mortality among beneficiaries hospitalized for
heart
failure and pneumonia, but not for acute myocardial infarction.
Meaning There was a statistically significant association with
implementation of the HRRP and increased post-discharge
mortality for patients hospitalized for heart failure and
pneumonia, but whether this finding is a result of the policy
requires further research.
Association of the Hospital Readmissions Reduction Program
With Heart Failure, AMI, and Pneumonia Mortality Original
Investigation Research
jama.com (Reprinted) JAMA December 25, 2018 Volume 320,
Number 24 2543
© 2018 American Medical Association. All rights reserved.
http://www.jama.com/?utm_campaign=articlePDF%26utm_medi
um=articlePDFlink%26utm_source=articlePDF%26utm_content
=jama.2018.19232
is when the HRRP was implemented and hospitals were sub-
jected to financial penalties. For patients with multiple hos-
pitalizations within a time period, 1 index hospitalization was
randomly selected for each condition.
Outcomes
Patient mortality within 30 days of discharge after a hospital-
ization (postdischarge mortality) for heart failure, acute myo-
cardial infarction, and pneumonia was evaluated, which has
been done in previous hospital-level analyses.17-19 The follow-
ing 30-day postdischarge outcome subgroups were also ex-
amined: (1) death and no readmission, (2) readmission and
death, (3) readmission and no death, and (4) no readmission
and no death. These subgroup outcomes were examined to try
to provide mechanistic insights on the relationship between
readmission and mortality. To fully assess trends in mortality
related to a complete clinical episode, 45-day patient mortal-
ity rates following admission (postadmission mortality) were
also evaluated, because efforts to reduce readmissions could
potentially encompass care during hospitalization and might
influence discharge timing and location of death. This mea-
sure included varying hospital lengths of stay and captured
both in-hospital and 30-day postdischarge deaths for the ma-
jority of the cohort.
Statistical Analysis
To account for a potential imbalance in case mix between study
periods, a propensity score approach (ie, the probability of
being in a specific period given the demographics and comor-
bidities of the patient and calendar month of hospitalization)
was used to standardize populations among periods. Patient
demographics, comorbidities, and seasonal indicators (calen-
dar month) from period 4 were used as a reference to re-
weight observed outcomes in all other study periods. Logis-
tic regression models were fit on data from periods 1 and 4 to
obtain a propensity score for period 1. The propensity score was
then used to weight the outcomes in period 1, generating event
rates through inverse probability weighting (IPW) that would
have been observed if period 1 had the same case mix as pe-
riod 4. Similarly, separate logistic regression models were fit
to data from periods 2 and 4 and periods 3 and 4 to provide
IPW-adjusted event rates in periods 2 and 3, respectively. This
approach allowed the calculated distribution of each out-
come in each of the 4 periods to be based on the same case mix
(ie, the case mix from period 4).20 Because the primary aim
was to understand the association of the HRRP with mortal-
ity at the individual level, we did not examine hospital-level
effects in the analysis.
To establish the change in rates of outcomes after the an-
nouncement of the HRRP, the change in event rates between
periods 2 and 3 was calculated. Similarly, the change in rates
of outcomes between periods 3 and 4 was also calculated to
examine the change in outcomes between the announce-
ment and the implementation of the HRRP (Figure 1).
To isolate the association between the HRRP and the out-
comes, we sought to remove secular trends for each out-
come. To do so, the change in outcomes between periods 1 and
2 was computed to establish a baseline trend in outcomes be-
fore the announcement and implementation of the HRRP. This
difference was then subtracted from the change in outcomes
after the announcement of the HRRP (between periods 2 and
3) to account for trends that were unrelated to the HRRP. Simi-
larly, the baseline difference was also subtracted from the
change in outcomes after the implementation of the HRRP, be-
tween periods 3 and 4.
Additional Analyses
Several sensitivity analyses were performed. First, patients
enrolled in hospice were excluded because greater use of
hospice care at the end of life might shift deaths that previ-
ously occurred within a hospital to the postdischarge setting
over time.21,22 Second, because 1 hospitalization was ran-
domly selected for patients that experienced multiple hospi-
talizations in a given study period, the main analysis was
repeated using the first hospitalization for each patient in
each study period as well as all hospitalizations for each
Figure 1. Study Periods and Analytic Approach in a Study of the
Association Between the Hospital
Readmissions Reduction Program (HRRP) and Mortality
Period 1
(April 2005-
September 2007)
Period 2
(October 2007-
March 2010)
Period 3
(April 2010-
September 2012)
Period 4
(October 2012-
April 2015)
Baseline change
in mortality before
HRRP announcement
Difference in change in mortality prior
to HRRP (A) compared with change
after HRRP announcement (B)
Difference in change in mortality before HRRP (A)
compared with change after HRRP implementation (C)
Change in mortality
after HRRP
announcement
Change in mortality
after HRRP
implementation
HRRP Announcement
(April 2010)
HRRP Implementation
(October 2012)
Calculation A
Calculation
Calculation
Calculation B Calculation C
Research Original Investigation Association of the Hospital
Readmissions Reduction Program With Heart Failure, AMI, and
Pneumonia Mortality
2544 JAMA December 25, 2018 Volume 320, Number 24
(Reprinted) jama.com
© 2018 American Medical Association. All rights reserved.
http://www.jama.com/?utm_campaign=articlePDF%26utm_medi
um=articlePDFlink%26utm_source=articlePDF%26utm_content
=jama.2018.19232
patient. Third, the entire analysis for postdischarge mortality
was repeated using outcome regression within each study
period to generate predicted outcomes for the case-mix in
period 4, which were then directly compared across periods
to ensure the results were not sensitive to the analytic
approach used.
More details on the methodologic approach are provided
in the Supplement. Significance testing was performed using
z tests, with standard error estimates that accounted for in-
verse probability weighting. Statistical tests were 2-sided at a
significance level of .05. The false discovery rate (FDR) based
multiple comparison procedure was used to assess the statis-
tical significance of the difference in the change in mortality-
related end points (eg, aggregate mortality, mortality with or
without readmission) at the FDR level of 0.05.23,24 Analyses
were performed using SAS version 9.4 (SAS Institute).
Results
There were 8 326 688 Medicare fee-for-service hospitaliza-
tions for heart failure, acute myocardial infarction, and pneu-
monia from April 1, 2005, to March 31, 2015, among which
7 948 937 patients were alive at hospital discharge. The mean
(SD) age of the study population was 79.6 (8.7) years,
4 246 45 4 partic ipants (53.4%) were women, 6 802 296
(85.6%) were white, and 738 198 (9.3%) were black. There
were 3.2 million hospitalizations for heart failure, 1.8 million
for acute myocardial infarction, and 3.0 million for pneumo-
nia and, overall, there were 270 517 deaths from heart failure,
128 088 deaths from ac ute myoc ardial infarction, and
246 154 deaths from pneumonia within 30 days of discharge.
Baseline patient demographics were similar among the 4
study periods; comorbidities are shown in Table 1 for patients
alive at discharge. Observed trends in 30-day postdischarge
and 45-day postadmission outcomes for target conditions are
shown in Figure 2 and eTables 1 and 2 in the Supplement.
HRRP and 30-Day Postdischarge Mortality
Among patients with heart failure, IPW-adjusted postdis-
charge mortality (Figure 3A and eTable 3 in the Supplement)
increased before the announcement or implementation
of the HRRP (0.27% increase from period 1 to period 2;
Table 2). Relative to this baseline trend, the announcement
of the HRRP was significantly associated with an increase in
postdischarge mortality (0.49% increase from period 2 to
period 3; 0.22% difference between the change from period
1 to period 2 and period 2 to period 3; P = .01). An analysis
stratified by whether there was an associated readmission
showed that this change was entirely driven by a significant
increase in mortality without readmission (0.27% increase
from period 1 to period 2 vs 0.53% increase from period 2 to
period 3; 0.26% difference between the change from period
1 to period 2 and period 2 to period 3; P < .001). In addition,
HRRP implementation was significantly associated with an
increase in postdischarge mortality overall relative to base-
line trends (0.52% increase from period 3 to period 4; 0.25%
difference between the change from period 1 to period 2 and
period 3 to period 4; P = .001), which was also explained by
an increase in death without readmission.
In contrast, among patients with acute myocardial infarc-
tion (Figure 3B), HRRP announcement was significantly asso-
ciated with a decline in postdischarge mortality (Table 2;
0.18% increase from period 1 to period 2 vs 0.08% decrease
from period 2 to period 3; −0.26% difference between the
change from period 1 to period 2 and period 2 to period 3;
P = .01). Compared with baseline trends, HRRP implementa-
tion was not associated with a significant change in mortality
(0.15% increase from period 3 to period 4; −0.03% difference
between the change from period 1 to period 2 and period 3 to
period 4; P = .69).
Postdischarge mortality among patients with pneumonia
(Figure 3C) was relatively stable before the HRRP (0.04%
increase from period 1 to period 2), but increased signifi-
cantly after announcement of the HRRP (Table 2; 0.26%
increase from period 2 to period 3; 0.22% difference between
the change from period 1 to period 2 and period 2 to period 3;
P = .01). This overall change was driven by an increase in
patients who were not readmitted but died within 30 days of
discharge (0.09% increase from period 1 to period 2 vs 0.32%
increase from period 2 to period 3; 0.23% difference between
the change from period 1 to period 2 and period 2 to period 3;
P = .003). In addition, compared with baseline trends, HRRP
implementation was also significantly associated with an
increase in mortality overall (0.44% increase from period 3 to
period 4; 0.40% difference between the change from period 1
to period 2 and period 3 to period 4; P < .001) and among
stratified mortality outcomes of death and no readmission
(0.09% from period 1 to period 2 vs 0.38% from period 3 to
period 4; 0.30% difference between the change from period 1
to period 2 and period 3 to period 4; P < .001) and readmis-
sion and death (0.05% decrease from period 1 to period 2 vs
0.05% increase from period 3 to period 4; 0.11% difference
between the change from period 1 to period 2 and period 3 to
period 4; P = .003).
All P values less than .05 for the 18 comparisons involv-
ing 3 end points (total mortality, mortality without readmis-
sion, and mortality with readmission), 2 differences in change
(post-HRRP announcement trends and post-HRRP implemen-
tation trends compared with pre-HRRP trends) and 3 condi-
tions (heart failure, acute myocardial infarction, and pneu-
monia) were also significant at the FDR level of 0.05 (Table 2).
Other 30-Day Postdischarge Outcomes
Inverse probability-weighted readmissions without death
within 30 days declined significantly following the announce-
ment and implementation of the HRRP compared with the
years preceding the HRRP for all 3 target conditions (Table 2).
Trends across study periods in rates of patients who were not
readmitted and were alive within 30 days of discharge are also
shown in Table 2 and eTable 3 in the Supplement.
HRRP and 45-Day Postadmission Mortality
Trends in IPW-adjusted postadmission mortality rates are
shown in Figure 4 and eTable 4 in the Supplement. Among pa-
tients hospitalized for heart failure, postadmission mortality
Association of the Hospital Readmissions Reduction Program
With Heart Failure, AMI, and Pneumonia Mortality Original
Investigation Research
jama.com (Reprinted) JAMA December 25, 2018 Volume 320,
Number 24 2545
© 2018 American Medical Association. All rights reserved.
https://jama.jamanetwork.com/article.aspx?doi=10.1001/jama.2
018.19232&utm_campaign=articlePDF%26utm_medium=article
PDFlink%26utm_source=articlePDF%26utm_content=jama.2018
.19232
https://jama.jamanetwork.com/article.aspx?doi=10.1001/jama.2
018.19232&utm_campaign=articlePDF%26utm_medium=article
PDFlink%26utm_source=articlePDF%26utm_content=jama.2018
.19232
https://jama.jamanetwork.com/article.aspx?doi=10.1001/jama.2
018.19232&utm_campaign=articlePDF%26utm_medium=article
PDFlink%26utm_source=articlePDF%26utm_content=jama.2018
.19232
https://jama.jamanetwork.com/article.aspx?doi=10.1001/jama.2
018.19232&utm_campaign=articlePDF%26utm_medium=article
PDFlink%26utm_source=articlePDF%26utm_content=jama.2018
.19232
https://jama.jamanetwork.com/article.aspx?doi=10.1001/jama.2
018.19232&utm_campaign=articlePDF%26utm_medium=article
PDFlink%26utm_source=articlePDF%26utm_content=jama.2018
.19232
http://www.jama.com/?utm_campaign=articlePDF%26utm_medi
um=articlePDFlink%26utm_source=articlePDF%26utm_content
=jama.2018.19232
rates steadily increased before the announcement of the HRRP
(Table 2; 0.15% increase from period 1 to period 2). Compared
with this baseline trend, the HRRP announcement was sig-
nificantly associated with an increase in mortality (0.42% in-
crease from period 2 to period 3; 0.27% difference between the
change from period 1 to period 2 and period 2 to period 3;
P = .01). However, mortality did not significantly change af-
ter HRRP implementation (0.32% increase from period 3 to pe-
riod 4; 0.17% difference between the change from period 1 to
period 2 and period 3 to period 4; P = .06).
Postadmission mortality declined among patients hospi-
talized for acute myocardial infarction before the announce-
ment of the HRRP (0.24% decline from period 1 to period 2), a
trend that did not significantly change after the HRRP an-
nouncement (0.35% decline from period 2 to period 3; −0.12%
difference between the change from period 1 to period 2 and
period 2 to period 3; P = .39). Following the HRRP implemen-
tation, postadmission mortality continued to decline (0.44%
from period 3 to period 4), but did not significantly differ from
baseline trends (−0.21% difference between the change from
period 1 to period 2 and period 3 to period 4: P = .06).
Among patients hospitalized for pneumonia, postadmis-
sion mortality was relatively stable before the HRRP (0.05%
increase from period 1 to period 2), and did not significantly
change after the HRRP announcement (0.15% decline from pe-
riod 2 to period 3; −0.20% difference between the change from
period 1 to period 2 and period 2 to period 3; P = .07) and
imple-
mentation (0.14% increase from period 3 to period 4; 0.09%
difference between the change from period 1 to period 2 and
period 3 to period 4; P = .30).
Table 1. Baseline Characteristics of Patients Discharged After
Hospitalization for Heart Failure,
Acute Myocardial Infarction, or Pneumoniaa
Participants, %
Period 1
(April 2005-
September 2007)
Period 2
(October 2007-
March 2010)
Period 3
(April 2010-
September 2012)
Period 4
(October 2012-
March 2015)
Hospitalizations 2 283 774 2 011 915 1 857 337 1 795 911
Demographics
Age, mean (SD), y 79.5 (8.5) 79.7 (8.7) 79.7 (8.9) 79.6 (9.0)
Women 54.4 53.7 53.1 52.2
Men 45.6 46.3 46.9 47.8
Race/ethnicity
White 85.9 85.8 85.4 85.1
Black 9.2 9.2 9.4 9.4
Otherb 4.9 5.0 5.2 5.5
Cardiovascular comorbidities
Chronic atherosclerosis 53.0 52.6 52.4 50.0
Diabetes 33.9 34.1 35.3 36.0
Hypertension 60.6 66.3 69.1 67.6
History of acute myocardial infarction 5.1 5.2 5.2 5.1
History of heart failure 27.2 26.4 26.8 26.1
Peripheral vascular disease 8.6 8.7 8.4 7.7
Unstable angina 3.4 2.9 2.7 2.6
Valvular heart disease 22.7 17.6 17.2 17.0
Other comorbidities
Anemia 28.5 30.2 32.3 32.0
COPD 39.6 34.8 34.5 33.8
Cancer 9.5 9.8 9.9 9.7
Cerebrovascular disease 5.1 5.0 4.9 4.5
Dementia 13.7 14.2 12.9 6.8
Depression 8.4 8.1 8.5 8.2
Functional disability 2.9 3.2 3.4 3.3
Liver disease 1.0 1.0 1.1 1.3
Malnutrition 4.6 6.5 7.7 8.2
Psychiatric disorder 2.8 3.2 3.3 3.2
Kidney failure 14.0 18.2 21.2 21.9
Respiratory failure 6.6 8.7 10.2 11.5
Substance abuse 6.9 6.6 7.0 7.3
Trauma 7.5 7.4 7.2 6.6
Length of stay, mean (SD), d 5.6 (4.9) 5.5 (4.8) 5.2 (4.5) 5.1
(4.4)
Abbreviation: COPD, chronic
obstructive pulmonary disease.
a Data are reported as percentages
unless otherwise noted. HRRP
announcement was in April 2010
and implementation was
in October 2012.
b Race/ethnicity denoted as Asian,
Hispanic, North American Native,
other, or unknown.
Research Original Investigation Association of the Hospital
Readmissions Reduction Program With Heart Failure, AMI, and
Pneumonia Mortality
2546 JAMA December 25, 2018 Volume 320, Number 24
(Reprinted) jama.com
© 2018 American Medical Association. All rights reserved.
http://www.jama.com/?utm_campaign=articlePDF%26utm_medi
um=articlePDFlink%26utm_source=articlePDF%26utm_content
=jama.2018.19232
Additional Analyses
As a sensitivity analysis, we excluded patients receiving hos-
pice care and observed patterns in postdischarge mortality that
paralleled our primary analysis (eTable 5 in the Supplement).
After excluding patients receiving hospice care, postdis-
charge mortality among patients hospitalized for heart fail-
ure and pneumonia were declining before the announce-
ment and implementation of the HRRP, but significantly
increased after the announcement and implementation due
to an increase in mortality without readmission (eTable 6 in
the Supplement). Trends in hospice deaths within 30 days of
discharge by condition are shown in eTables 7 and 8 in the
Supplement. Trends in postdischarge mortality also re-
mained similar when the analysis was restricted to the first hos-
pitalization for each patient in each period (eTables 9 and 10
in the Supplement) or included all hospitalizations for each pa-
tient (eTables 11 and 12 in the Supplement). In addition, find-
ings were consistent using the outcome regression-based ap-
proach (eTables 13 and 14 in the Supplement).
Discussion
Overall, the announcement and implementation of the HRRP
was associated with a significant increase in mortality within
30 days of discharge among Medicare beneficiaries hospi-
talized for heart failure and pneumonia, but not for acute
myocardial infarction. Although 30-day postdischarge mor-
tality for heart failure was increasing before the HRRP, this
increase accelerated after the announcement and implemen-
tation of the program. In addition, postdischarge …
EVIDENCE-
BASED CARE
SHEET
Author
Hillary Mennella, DNP, ANCC-BC
Cinahl Information Systems, Glendale, CA
Reviewers
Darlene Strayer, RN, MBA
Cinahl Information Systems, Glendale, CA
Jocelyn Cajanap-Gantman, RN, MSN,
FNP, CNS
Sepsis Coordinator, Glendale Adventist
Medical Center
Nursing Executive Practice Council
Glendale Adventist Medical Center,
Glendale, CA
Editor
Diane Pravikoff, RN, PhD, FAAN
Cinahl Information Systems, Glendale, CA
June 22, 2018
Published by Cinahl Information Systems, a division of EBSCO
Information Services. Copyright©2018, Cinahl Information
Systems. All rights
reserved. No part of this may be reproduced or utilized in any
form or by any means, electronic or mechanical, including
photocopying, recording, or by
any information storage and retrieval system, without
permission in writing from the publisher. Cinahl Information
Systems accepts no liability for advice
or information given herein or errors/omissions in the text. It is
merely intended as a general informational overview of the
subject for the healthcare
professional. Cinahl Information Systems, 1509 Wilson Terrace,
Glendale, CA 91206
Hospital Readmissions: United States Centers for
Medicare and Medicaid Services (CMS)
What We Know
› Hospital readmission is an expensive and often avoidable
patient care outcome(4,9,12)
› In 2013, an estimated 18% of Medicare patients were
readmitted to the hospital within
30 days of discharge. Annual Medicare costs related to
readmissions are estimated at
$26 billion, with potentially preventable readmissions
accounting for approximately $17
billion of that cost(1)
› All healthcare providers are responsible for identifying patient
discharge needs and
developing a thorough discharge plan to reduce the risk for
hospital readmissions(3)
› In accordance with the legislative passing of the Affordable
Care Act (ACA), the
United States Centers for Medicare and Medicaid Services
(CMS) established the
Hospital Readmissions Reduction Program (HRRP) to decrease
the frequency of hospital
readmissions of Medicare beneficiaries. Effective October 1,
2012, the provisions of the
HRRP permit the CMS to reduce payments to hospitals under
the inpatient prospective
payment system (IPPS) for readmission rates that are reviewed
by CMS and determined
to be excessive. The HRRP adjusts hospital reimbursement
based on the data for
excessive readmissions following patient admissions for acute
myocardial infarction
(AMI), congestive heart failure (CHF), pneumonia (PN),
coronary artery bypass graft
(CABG), chronic obstructive lung disease (COPD), stroke, and
complications related to
readmissions for total hip/knee replacements
(THR/TKR)(4,9,12)
• Under the HRRP, readmission is defined by the CMS as “an
admission to a subsection
hospital within 30 days of a discharge from the same or another
subsection hospital”(4)
– The hospital readmission rate is calculated from the date of
discharge, plus 30 days.
For example, for a patient who is discharged on October 1, the
last day for the
postdischarge follow-up period is October 31
– The CMS recognizes 30 days as an industry standard that is
strongly influenced by the
quality of care
– Hospital readmissions exclude those involving a patient’s
death in the hospital,
enrollment in the Medicare fee-for-service program, hospital
admission after at least
30 days post-hospital discharge, and planned hospital
readmission (i.e., a nonacute
readmission for a scheduled procedure)
– CMS does not consider preventability when calculating
readmission rates(11)
- A standard for identifying and defining what is considered to
be a preventable
readmission does not exist(11)
– Hospital readmission rates are assigned a “yes/no”
readmission status regardless of the
number of readmissions for a patient during the 30-day
postdischarge time period
› Each year during the period 2003–2004, according to billing
claims from the CMS, an
estimated 2.3 million Medicare beneficiaries were readmitted to
the hospital within 30
days of discharge. Investigators in a study of 11,855,702
Medicare beneficiaries reported
that(8)
• 19.6% were discharged from the hospital and rehospitalized
within 30 days
– Of this group, 50.25% did not have a bill for a follow-upvisit
to a physician’s office
between the time of discharge to the community and
rehospitalization
• 34% were discharged from the hospital and rehospitalized
within 30 days
– An estimated 10% were planned hospital readmissions
• 67.1% of Medicare beneficiaries with medical conditions who
were discharged from the hospital were rehospitalized or
died within the first year after discharge
• 51.5% of Medicare beneficiaries who were discharged from
the hospital after surgical procedures were rehospitalized or
died within the first year after discharge
– Of this group, 70.5% were rehospitalized with a medical
condition
› The CMS began reporting the 30-day mortality rates for the
quality outcome measures for AMI and CHF in 2007 and
for PN in 2008. These quality outcome measures are publicly
reported in an effort by CMS to increase transparency and
accountability of hospitals for patient care services and
treatment(2,12)
• The CMS recommends that hospitals review their 30-day
mortality outcome measures in conjunction with their 30-day
hospital readmission data in order to modify the quality and
type of care provided to reduce hospital readmissions
› The financial penalties for the HRRP were calculated by the
CMS using data from July 2008 through June 2011 for the
readmission rates for all hospitalizations for AMI, PN, and
CHF; these rates were adjusted for age, gender, patient frailty,
and coexisting medical conditions and compared with the actual
readmission rates over the same period of time using a
methodology that is endorsed by the National Quality Forum
(NQF)(4,9,12)
• A hospital’s calculated readmission rate for MI, PN, CHF,
COPD, CABG, stroke, and THR/TKR is the performance
measure of that hospital’s readmission rate compared with the
national average for a hospital’s set of patients with the same
applicable conditions
• For the fiscal year 2013, hospital readmission rates were
calculated from data on discharges from July 1, 2008, through
June 30, 2011
• In the fiscal year 2014, an estimated 80% of hospitals were
penalized, at a cost of $428 million(1)
• Kaiser Health News (KHN) reported 4 out of 5 hospitals were
penalized for readmissions based on patient discharge data
analyzed between July 2013 and June 2016(13)
– The average penalty between October 1, 2017 and September
30, 2018 is expected to be 0.73% for each payment
Medicare makes per patient(13)
› The CMS levied financial penalties of up to 1% of hospital
reimbursement rates for readmission of Medicare beneficiaries.
The financial penalties increased to 2% in 2014 and to a
maximum of 3% in 2015(9)
› The CMS 30-day hospital readmission measures are federally
mandated to be publicly available under the Hospital Inpatient
Quality Reporting Program(12)
› The CMS provides hospitals with Hospital-Specific Reports
(HSRs) under the Hospital Inpatient Quality Reporting
(IQR) program to promote hospital quality improvement efforts.
The HSRs provide detailed information on a hospital’s
readmission rates, discharge data, and specific risk factor
data(4,12)
› Investigators analyzing the publicly available data from July
2008 through June 2011 for 3,282 hospitals found that
large hospitals, teaching hospitals, and safety-net hospitals (i.e.,
a hospital system that provides care to a large number of
uninsured or low-income patients) had higher readmission rates
compared with small hospitals and non-teaching hospitals.
Of this sample, 2,189 hospitals, or 66.7% of hospitals, will
receive financial penalties as a result of the HRRP.
Investigators
call for additional research to determine why large hospitals,
teaching hospitals, and safety-net hospitals have higher
readmission rates than small and non-teaching hospitals(10)
› Researchers evaluating the impact of community factors on
hospital readmission rates noted that a large portion of
readmission rates is affected by the characteristics of the local
healthcare community (e.g., quality of nursing homes, access
to primary care), specifically the county where the hospital is
located. This suggests that penalizing hospitals with high
readmission rates might not be equitable and that interventions
aimed at community-based readmission reduction strategies
might result in improved outcomes(6)
› As new data emerge on hospital readmission rates, the CMS
should consider the impact on underserved medical
communities and make necessary adjustments to the policies
regarding hospital readmission. Debate exists about financially
penalizing hospitals for excessive readmission rates. Experts
argue that the CMS rules are inherently discriminatory toward
hospitals that serve low-income groups and/or severely ill
patients. Experts argue the following issues:(9,12)
• At the inception of the HRRP, the CMS did not adjust for
socioeconomic status (SES) or severity of comorbid illness in
the
calculation of the hospital readmission measures
– The CMS argued that adjustment for SES implies that it is
acceptable for low-income patient groups to receive less than
standard quality of care
– Experts contend that the CMS should adjust for SES to place
all hospitals at the same level
– Researchers have suggested weighting HRRP penalties
according to the timing of readmissions. For example, hospital
readmission within the first few days after discharge can
indicate poor discharge planning compared with hospital
readmission 3 weeks after discharge, which is more likely to
indicate the severity of the patient’s underlying illness and/
or comorbid diseases. This suggestion offers hospitals the
opportunity to make improvements to their discharge planning
process while caring for severely ill and low-income groups of
patients
• Events leading to hospital readmissions might be out of the
hospital’s control. Hospitals serving a larger population of
patients from a lower SES often have higher rates for
readmission compared to the national average resulting in lower
Medicare reimbursements. Patients from a lower SES can have
difficulty procuring follow-up appointments, food, and
medications after discharge(5)
– Patients that are eligible for Medicare and Medicaid are
defined as “dual-eligibles.” They tend to be medically complex
patients with high levels of healthcare utilization. As a result of
the 21st Century Cures Act of 2016 the CMS proposed
changes for calculating financial penalties under the HRRP
beginning fiscal year 2019 among hospitals with high
readmission rates of patients from low SES backgrounds. The
new calculations are risk-adjustment strategies that include
comparisons of social economic risk factors among
hospitals(7,14)
• The HRRP was criticized by experts that the program had the
potential to exacerbate disparities in patient care and generate
disincentives to provide care for patients with severe illness
and/or complex comorbidities
What We Can Do
› Become knowledgeable about hospital readmissions so you
can adhere to the CMS quality outcome measures and the
HRRP; share this information with your colleagues
› Review publicly available hospital readmission rates to
compare your organization against national benchmarks; for
more
information, see http://www.qualitynet.org
› Collaborate with colleagues in your facility to
• review your HSR to promote hospital quality improvement
efforts
• develop an individualized discharge plan for your patients
• provide high-quality healthcare to your patients to promote
positive patient outcomes and reduce the risk for hospital
readmissions
Coding Matrix
References are rated using the following codes, listed in order
of strength:
M Published meta-analysis
SR Published systematic or integrative literature review
RCT Published research (randomized controlled trial)
R Published research (not randomized controlled trial)
C Case histories, case studies
G Published guidelines
RV Published review of the literature
RU Published research utilization report
QI Published quality improvement report
L Legislation
PGR Published government report
PFR Published funded report
PP Policies, procedures, protocols
X Practice exemplars, stories, opinions
GI General or background information/texts/reports
U Unpublished research, reviews, poster presentations or
other such materials
CP Conference proceedings, abstracts, presentation
References
1. Boozary, A. S., Manchin, J., III, & Wicker, R. F. (2015). The
Medicare Hospital Readmissions Reduction Program: Time for
reform. JAMA: Journal of the American Medical
Association, 314(4), 347-348. doi:10.1001/jama.2015.6507 (R)
2. Centers for Medicare and Medicaid Services. (2017).
Outcomes measures. Retrieved June 15, 2018, from
https://www.cms.gov/medicare/quality-initiatives-patient-
assessment-
instruments/hospitalqualityinits/outcomemeasures.html (G)
3. Centers for Medicare and Medicaid Services. (2013).
Revision to State Operations Manual (SOM), Hospital Appendix
A - Interpretive Guidelines for 42 CFR 482.43, Discharge
Planning. Retrieved June 15, 2018, from
https://www.cms.gov/Medicare/Provider-Enrollment-and-
Certification/SurveyCertificationGenInfo/Policy-and-Memos-to-
States-and-Regions-Items/Survey-and-Cert-Letter-13-32.html
(G)
4. Centers for Medicare and Medicaid Services. (2018, April
27). Readmissions reduction program. Retrieved June 15, 2018,
from
http://www.cms.gov/Medicare/Medicare-Fee-for-Service-
Payment/AcuteInpatientPPS/Readmissions-Reduction-
Program.html (G)
5. Changes to readmissions rule will help, but no panacea.
(2017). Case Management Advisor, 28(9), 14-15. (X)
6. Herrin, J., St. Andre, J., Kenward, K., Joshi, M. S., Audet, A.
J., & Hines, S. C. (2015). Community factors and hospital
readmission rates. Health Services Research, 50(1),
20-39. doi:10.111/1475-6773.12177 (R)
7. Hospitals can now factor socioeconomic status into
readmissions. (2017). Hospital Case Management, 25(3), 41-42.
(GI)
8. Jencks, S. F., Williams, M. V., & Coleman, E. A. (2009).
Rehospitalizations among patients in the Medicare fee-for-
service program. New England Journal of Medicine, 360(14),
1418-1428. doi:10.1056/NEJMsa0803563 (R)
9. Joynt, K. E., & Jha, A. K. (2013). A path forward on
Medicare readmissions. New England Journal of Medicine,
368(13), 1175-1177. doi:10.1056/NEJMp1300122 (GI)
10. Joynt, K. E., & Jha, A. K. (2013). Characteristics of
hospitals receiving penalties under the Hospital Readmissions
Reduction Program. JAMA, 309(4), 342-343. doi:10.1001/
jama.2012.94856 (R)
11. Lavenberg, J. G., Leas, B., Unscheid, C. A., Williams, K.,
Goldman, D. R., & Kripalani, S. (2014). Assessing
preventability in the quest to reduce hospital readmissions.
Journal
of Hospital Medicine, 9(9), 598-603. doi:10.1002/jhm.2226 (R)
12. QualityNet. (n.d.). Readmission measures overview.
Retrieved June 15, 2018, from
http://www.qualitynet.org/dcs/ContentServer?c=Page&pagenam
e=QnetPublic%2FPage
%2FQnetTier2&cid=1219069855273 (G)
13. Rau, J. (2017). Medicare readmission penalties for hospitals
continue under Trump. Retrieved June 15, 2018, from
http://www.healthcarefinancenews.com/news/medicare-
readmission-penalties-hospitals-continue-under-trump (GI)
14. Whitman, E. (2017). Dual-eligibles could offer relief for
hospital readmissions penalties. Modern Healthcare, 47(17),
0010. (GI)
https://doi.org/10.1177/1077558717744611
Medical Care Research and Review
2019, Vol. 76(5) 643 –660
© The Author(s) 2017
Article reuse guidelines:
sagepub.com/journals-permissions
DOI: 10.1177/1077558717744611
journals.sagepub.com/home/mcr
Empirical Research
Hospital Readmissions
Reduction Program:
Intended and Unintended
Effects
Min Chen1 and David C. Grabowski2
Abstract
This study examines whether the Hospital Readmissions
Reduction Program (HRRP),
which penalizes hospitals with excess readmissions for certain
conditions, has reduced
hospital readmissions and led to unintended consequences. Our
analyses of Florida
hospital administrative data between 2008 and 2014 find that
the HRRP resulted in
a reduction in the likelihood of readmissions by 1% to 2% for
traditional Medicare
(TM) beneficiaries with heart failure, pneumonia, or chronic
obstructive pulmonary
disease. Readmission rates for Medicare Advantage (MA)
beneficiaries and privately
insured patients with heart attack and heart failure decreased
even more than TM
patients with the same target condition (e.g., for heart attack,
the likelihood for TM
beneficiaries to be remitted is 2.2% higher than MA
beneficiaries and 2.3% higher
than privately insured patients). We do not find any evidence of
cost-shifting, delayed
readmission, or selection on discharge disposition or patient
income. However,
the HRRP reduced the likelihood of Hispanic patients with
target conditions being
admitted by 2% to 4%.
Keywords
Medicare, readmissions, hospital, discharge
This article, submitted to Medical Care Research and Review on
30 June 2017, was revised and accepted
for publication on November 6, 2017.
1Florida International University, Miami, FL, USA
2Harvard Medical School, Boston, MA, USA
Corresponding Author:
Min Chen, College of Business, Florida International
University, 11200 SW 8th Street,
Miami, FL 33199, USA.
Email: [email protected]
744611MCRXXX10.1177/1077558717744611Medical Care
Research and ReviewChen and Grabowski
research-article2017
https://us.sagepub.com/en-us/journals-permissions
https://journals.sagepub.com/home/mcr
mailto:[email protected]
http://crossmark.crossref.org/dialog/?doi=10.1177%2F10775587
17744611&domain=pdf&date_stamp=2017-12-03
644 Medical Care Research and Review 76(5)
Introduction
Hospital readmissions are common and costly. In 2011, the U.S.
Medicare program
paid for 1.8 million 30-day readmissions with a total cost of $24
billion (Hines, Barrett,
Marguerit, Jiang, Joanna, & Steiner, 2014). Some readmissions
could be prevented
with better quality of care (Axon & Williams, 2011), and the
Medicare Payment
Advisory Commission (MedPAC) estimates that a 10%
reduction in avoidable read-
missions would save the Medicare program at least $1 billion
(MedPAC, 2013). To
achieve both better outcomes for patients and greater savings
for Medicare, the
Affordable Care Act (ACA) created the Hospital Readmissions
Reduction Program
(HRRP), which applies financial penalties to acute care
hospitals with higher-than-
expected readmission rates among Medicare fee-for-service
(FFS) beneficiaries in the
30-days following discharge for certain target conditions.
Since October 2012, the HRRP has targeted three conditions:
acute myocardial
infarction (AMI), congestive heart failure, and pneumonia.
Beginning in October
2014, total hip or knee replacement and chronic obstructive
pulmonary disease
(COPD) were also included in the program. The Centers for
Medicare and Medicaid
Services (CMS) calculates the average risk-adjusted, 30-day
hospital-readmission
rates for patients with each targeted condition and penalizes
hospitals that perform
worse than the national average. For Fiscal Year (FY) 2013, the
maximum penalty for
a hospital with excess readmissions was 1% of its total
Medicare base payment. The
penalty went up to 2% of the Medicare base payment for FY
2014, and 3% for FY
2015 forward (CMS, 2016).
New Contribution
Prior studies have examined the initial three target conditions
(i.e., AMI, heart failure,
and pneumonia) and suggested that the HRRP has lowered 30-
day readmissions
among Medicare FFS beneficiaries (Carey & Lin, 2015;
Gerhardt et al., 2013;
Zuckerman, Sheingold, Orav, Ruhter, & Epstein, 2016). Using
Medicare FFS claims
data, two recent articles compared the changes in readmission
rates by hospital penalty
status and confirmed that hospitals with the lowest pre-HRRP
performance had the
greatest improvement (Desai et al., 2016; Wasfy et al., 2017).
How readmissions
change among Medicare Advantage beneficiaries and privately
insured patients, how-
ever, is still somewhat unclear and vitally important. Because
the HRRP penalties only
apply to traditional Medicare patients, one way that a hospital
could recoup lost
Medicare reimbursements as a result of excess readmissions
would be to readmit more
privately insured or Medicare Advantage patients. In this study,
we exploit a state-
based all-payer dataset (through 2014) to examine the overall
impact of the HRRP on
readmissions among traditional Medicare, Medicare Advantage,
and privately insured
patients, respectively. We examine not only the aforementioned
three originally tar-
geted conditions but also the two new penalty conditions (i.e.,
COPD and total hip or
knee replacement).
Furthermore, we explore several other potential consequences of
the HRRP across
targeted and nontargeted conditions. First, we examine the
impact of the HRRP on
Chen and Grabowski 645
readmissions post–30 days to detect if the HRRP has simply
delayed readmissions.
Next, we examine whether the HRRP led to any “cherry
picking” of low-risk patients
at admission. Finally, we examine whether the HRRP led to
increased skilled nursing
facility (SNF) or home health agency (HHA) discharges.
Conceptual Framework
The HRRP is a very direct policy instrument. Hospitals are
financially penalized for
excess 30-day readmissions for the target conditions.
Medicare’s goal in implementing
the HRRP was to encourage hospitals to reduce 30-day
readmissions through better
hospital care. In response to the HRRP, we hypothesize that
hospitals will lower read-
missions for these target conditions assuming the cost of
reducing readmissions is
below the amount of the readmission penalty. We also assume
that hospitals want to
avoid any negative reputation effects associated with being
penalized (Winborn,
Alencherril, & Pagán, 2014), which might lead them to lower
readmissions even if the
cost of doing so exceeds the readmission penalty.
Because the HRRP is a relatively blunt policy, we expect it to
incent hospitals to
change their behaviors in both intended and unintended ways. In
terms of unintended
consequences, strong potential exists for what economists term
the multitasking prob-
lem in which providers direct their efforts toward those metrics
for which they might
be penalized while shirking on those metrics for which they are
not penalized. Under
the HRRP, hospitals would have the incentive to push any
readmissions out past day
30 when they are no longer penalized for the readmission.
Critics have suggested that
hospitals might dodge the HRRP penalties by increasingly
placing returning patients
within 30 days of discharge on observation status (Himmelstein
& Woolhandler, 2015;
Noel-Miller & Lind, 2015). Observation stays are billed as
outpatient services rather
than readmissions to acute care and would not be counted in the
HRRP penalty calcu-
lation. Between 2006 and 2013, observation stays increased by
96% for Medicare
patients (MedPAC, 2015). One recent study, however, did not
find a statistically
significant increase in observation stays for targeted versus
nontargeted conditions
(Zuckerman et al., 2016).
Another unintended consequence would be to discharge patients
with a low risk of
readmission to costlier postacute care settings because the
hospitals are only at risk for
readmissions under the HRRP and not postdischarge spending.
Thus, at the margin,
hospitals have the incentive to increase discharges to home
health and skilled nursing
facilities for the HRRP target conditions if such discharges
would help hospitals reduce
readmission rates. From Medicare’s perspective, spending on
these postacute services
would likely more than offset any potential savings from
decreased 30-day
readmissions.
Finally, the HRRP’s readmission measures adjust for
demographic characteristics
associated with higher rates of hospital readmissions (such as
age) and severity.
However, they do not allow risk adjustment based on patients’
race, ethnicity, or socio-
economic status. Because patients with low socioeconomic
status are found to have
higher readmission rates than the overall population (Hu,
Gonsahn, & Nerenz, 2014),
646 Medical Care Research and Review 76(5)
hospitals may respond to the omission of these risk factors by
selecting patients on
race and socioeconomic status associated with lower rates of
hospital readmissions.
Method
Data and Outcome Variables
We construct our hospital admissions and readmissions
measures using the State
Inpatient Discharge data, collected and maintained by the
Florida Agency for Health
Care Administration. The data contain detailed information on
all inpatient stays in
Florida from Quarter 1 of 2008 to Quarter 4 of 2014 and a
unique patient identifier that
allows us to track a patient’s historical visits across hospitals
over time. In addition, we
used Medicare Hospital Compare data released in July 2009 (for
the period July 2005–
June 2008) to examine baseline risk-adjusted readmission rates
at the inpatient pro-
spective payment system (IPPS) hospitals in the United States.
We adapt methods used in the prior studies to construct index
hospitalization and
30-day all-cause readmission at the patient level. Specifically,
we code index hospital-
izations as stays in which no inpatient discharge had occurred
within the previous 30
days. Hence, a hospitalization is either an index stay or a
readmission. We then iden-
tify target conditions by the principal diagnosis or procedure of
the index hospitaliza-
tion, using Healthcare Cost and Utilization Project’s (HCUP’s)
Clinical Classifications
Software (CCS). CCS is a tool that collapses diagnosis and
procedure codes from the
International Classification of Diseases, 9th Revision, Clinical
Modification
(ICD-9-CM).1 We used the single level CCS diagnosis code 100
for AMI, 108 for
heart failure, 122 for pneumonia, and 127 for COPD. The CCS
procedure code used
for total hip and knee replacement is 152-153. The ICD-9 codes
used to identify total
hip and knee replacement are 81.51 (primary hip replacement)
and 81.54 (primary
knee replacement). In addition, we follow the prior literature
(Carey & Lin, 2015;
Mellor, Daly, & Smith, 2016) and select gastrointestinal
conditions with Medicare
Severity Diagnosis Related Group (MS-DRG) codes 329-331,
377-379, and 391-392
to be our control group of Medicare index hospitalizations.2
Similarly, we define two additional indicator variables when
readmission occurred
within 45 days or 60 days, respectively, and compared them to
the 30-day readmission
to identify if readmission occurred within 31 to 45 days or 31 to
60 days. Finally, we
use the disposition of the patient at discharge to code dummy
variables indicating
whether the patient was discharged to an SNF or HHA.
Control Variables
To control for heterogeneity associated with changes in
readmission and other out-
comes over time, our models include a rich set of patient-level
covariates. The covari-
ates include demographics such as sex, age group, race, primary
payer, income
category, and rural/urban location. We also constructed time-
varying clinical measures
for severity adjustment, including (1) indicators of high severity
with major
Chen and Grabowski 647
complications/comorbidities based on the MS-DRG codes and
(2) the number of
comorbid conditions compiled from a set of 29 binary variables
identifying coexisting
medical conditions that are not directly related to the main
reason for index admission
(refer to HCUP’s Elixhauser Comorbidity Software for
details).3
We identify and exclude certain index hospitalizations
following the rules specified
in the technical reports of constructing 30-day all cause
readmission rates prepared for
CMS: (1) hospitalizations during which patients died, (2)
discharged against medical
advice, and (3) discharged or transferred to another acute care
facility. For AMI admis-
sions, we also excluded cases with same-day discharges. The
analysis sample contains
951,215 index admissions from 156 hospitals.
Statistical Analysis
We use a difference-in-differences (DD) method to compare
changes in outcomes of
patients in the treatment group before and after the HRRP
relative to changes in out-
comes of the control group. The treatment group consists of
Medicare FFS beneficia-
ries aged at least 65 years old and with one of the five HRRP
target conditions as the
primary diagnosis for their index admission. For each condition
we use three different
comparison groups for a total of 15 models. The first
comparison group consists of
hospital admissions among Medicare FFS patients aged 65 years
and older and with
gastrointestinal conditions as their primary diagnosis. The
second comparison group
includes hospitalizations of each of the five target conditions
among Medicare
Advantage patients aged 65 years and older. The third
comparison group comprises
privately insured patients with those five target conditions.
We estimate the following model:
Y Post Treatment Post
Treatment X Hospi
iht t i t
i it
= +
+ + +
∗ +α µ µ
µ β
1 2
3 � ttalh iht+ε
(1)
where Yiht is an indicator for a study outcome for patient i at
hospital h in time period
t. More specifically, we first examine if the patient was
readmitted within 30 days of
discharge and if there is any delayed readmission after 30 days
but within 45 or 60
days of discharge. We also examine if the patient was
discharged to a costlier postacute
care setting (i.e., a SNF or a HHA). Finally, we examine
whether the HRRP reduced
the likelihood of admitting minority patients or lower income
patients. Minority
patients are indicated by whether the patient is Black or of
Hispanic ethnicity. We iden-
tify a patient to be in a lower income region if the patient
resides in a ZIP code wherein
the estimated annual median household income is in the bottom
two quartiles. Each of
these outcome measures represents a separate regression.
Postt is a dummy variable set to 1 if the observation is from the
posttreatment
period in either the treatment or a comparison group. We use
2008-2009 as the pre-
HRRP period and 2012-2014 as the post-HRRP period for AMI,
heart failure, and
pneumonia. For the two newly added conditions (i.e., COPD and
total hip or knee
replacement), we use 2014 as the post-HRRP period. Treatmenti
indicates whether the
648 Medical Care Research and Review 76(5)
index admission was a hospitalization targeted by the HRRP,
and equals zero if the
index admission was part of a comparison group. The
interaction effect of Postt *
Targeti represents our key variable of interest, the DD estimate
of the impact of the
HRRP. Xit is a vector that captures the time-varying patient
characteristics (listed in
Table 1). The hospital fixed effects (Hospitalh) are used to
control for the unobserved,
time-invariant differences across hospitals.
Thus, we use pre-HRRP levels for the target admissions and
concurrent changes
from the precontract to postcontract period in the nontarget
admissions to establish
counterfactuals that would be expected in the absence of HRRP
program, and we esti-
mate changes that differed from this expectation (i.e., the
differential change or the
change attributable to the HRRP). For all the regression
analyses, the standard errors
are clustered at the level of the hospital to allow for an arbitrary
covariance matrix
within the clusters.
Because penalties are based on whether a hospital’s readmission
rate exceeds the
national average, hospitals with a baseline readmission rate
above the threshold are at
greater risk of the penalty and thus have stronger incentives to
improve. In July 2009,
the CMS Hospital Compare website began to publicly report
IPPS hospitals’ perfor-
mance in 30-day readmission rates for AMI, heart failure, and
pneumonia, respectively.
For each IPPS hospital with more than 25 cases, its performance
is classified into three
categories: “better than U.S. national rate,” “no different than
U.S. National Rate,” or
“worse than U.S. national rate.” We use the national rate for the
period July 2005 to
June 2008 obtained from CMS’s Hospital Compare data as the
baseline threshold rate
and compare the hospital specific average 30-day readmission
rates to the national
average to define if a hospital is “at risk” for any penalty.4
Given that penalties are
based on a hospital’s past 3-year average readmission
performance, partial responses
might be observed immediately after ACA passage but before
penalties go into effect.
Using historic readmission rates prior to ACA passage allows us
to test the full effects
of the HRRP. To examine how the impact of HRRP varies
across hospitals with differ-
ent risks of facing the penalty, we divide the sample into two
groups based on whether
patients were admitted into a hospital with its baseline
readmission rate above the
threshold rate, and then we re-estimate the DD model on both of
the subsamples.
We further compare this DD estimate of patients treated at
hospitals at risk for
HRRP penalties versus those patients treated at hospitals not at
risk for penalties. More
formally, we estimate the triple difference model (DDD)
specified below:
Y Post Target Risk Post Target Post
Risk
iht t i h t i t
h
= + + +
+
∗ ∗ ∗
∗
α µ µθ 1 2
µµ γ
γ γ β
3 1
2 3
Target Risk Post
Target Risk X Year
i h t
i h it t iht
∗ +
+ + + + +ε
(2)
Compared with Equation (1), the added variable Riskh is an
indicator variable that
specifies whether a hospital is at risk for HRRP penalties, which
equals to 1 if hospital
h’s baseline readmission rate is above the national average and
0 otherwise. The inter-
action effect of Postt * Targeti * Riskh represents our key
variable of interest, the triple
difference estimate of the impact of the HRRP.
649
T
a
b
le
1
.
D
es
cr
ip
ti
ve
S
ta
ti
st
ic
s.
A
ll
Sa
m
pl
e
A
M
I
H
F
PN
C
O
PD
H
IP
/K
ne
e
G
I
(1
)
(2
)
(3
)
(4
)
(5
)
(6
)
(7
)
O
ut
co
m
e
m
ea
su
re
s
R
ea
dm
it
te
d
w
it
hi
n
30
d
ay
s
0.
16
[
0.
37
]
0.
18
[
0.
38
]
0.
23
[
0.
42
]
0.
16
[
0.
37
]
0.
19
[
0.
39
]
0.
05
[
0.
25
]
0.
13
[
0.
34
]
R
ea
dm
it
te
d
w
it
hi
n
31
-4
5
da
ys
0.
03
[
0.
17
]
0.
03
[
0.
17
]
0.
05
[
0.
21
]
0.
03
[
0.
17
]
0.
04
[
0.
20
]
0.
01
[
0.
12
]
0.
03
[
0.
16
]
R
ea
dm
it
te
d
w
it
hi
n
31
-6
0
da
ys
0.
05
[
0.
22
]
0.
05
[
0.
21
]
0.
08
[
0.
27
]
0.
05
[
0.
22
]
0.
07
[
0.
25
]
0.
02
[
0.
15
]
0.
05
[
0.
21
]
D
is
ch
ar
ge
d
to
S
N
F
0.
17
[
0.
37
]
0.
13
[
0.
33
]
0.
17
[
0.
37
]
0.
17
[
0.
38
]
0.
12
[
0.
32
]
0.
39
[
0.
49
]
0.
09
[
0.
29
]
D
is
ch
ar
ge
d
to
H
H
A
0.
22
[
0.
41
]
0.
16
[
0.
37
]
0.
25
[
0.
43
]
0.
18
[
0.
38
]
0.
20
[
0.
40
]
0.
45
[
0.
50
]
0.
13
[
0.
33
]
Pa
ti
en
t
ch
ar
ac
te
ri
st
ic
s
A
ge
(
65
-7
4
ye
ar
s)
0.
29
[
0.
45
]
0.
29
[
0.
46
]
0.
24
[
0.
43
]
0.
25
[
0.
43
]
0.
38
[
0.
49
]
0.
39
[
0.
49
]
0.
26
[
0.
44
]
A
ge
(
75
-8
5
ye
ar
s)
0.
30
[
0.
46
]
0.
28
[
0.
45
]
0.
36
[
0.
48
]
0.
31
[
0.
46
]
0.
35
[
0.
48
]
0.
28
[
0.
45
]
0.
27
[
0.
44
]
A
ge
(
≥8
5
ye
ar
s)
0.
20
[
0.
40
]
0.
19
[
0.
39
]
0.
33
[
0.
47
]
0.
25
[
0.
43
]
0.
17
[
0.
38
]
0.
09
[
0.
29
]
0.
16
[
0.
37
]
Fe
m
al
e
0.
55
[
0.
50
]
0.
41
[
0.
49
]
0.
49
[
0.
50
]
0.
53
[
0.
50
]
0.
57
[
0.
49
]
0.
61
[
0.
49
]
0.
60
[
0.
49
]
R
ac
e
W
hi
te
0.
78
[
0.
41
]
0.
78
[
0.
42
]
0.
74
[
0.
44
]
0.
77
[
0.
42
]
0.
81
[
0.
39
]
0.
86
[
0.
35
]
0.
76
[
0.
43
]
B
la
ck
0.
09
[
0.
28
]
0.
07
[
0.
26
]
0.
12
[
0.
33
]
0.
09
[
0.
29
]
0.
07
[
0.
25
]
0.
06
[
0.
23
]
0.
10
[
0.
30
]
H
is
pa
ni
c
0.
10
[
0.
30
]
0.
10
[
0.
30
]
0.
10
[
0.
30
]
0.
11
[
0.
31
]
0.
11
[
0.
31
]
0.
06
[
0.
24
]
0.
11
[
0.
31
]
O
th
er
r
ac
e
0.
03
[
0.
18
]
0.
04
[
0.
21
]
0.
03
[
0.
17
]
0.
03
[
0.
18
]
0.
01
[
0.
12
]
0.
03
[
0.
16
]
0.
04
[
0.
19
]
M
ed
ia
n
ho
us
eh
o
ld
in
co
m
e
Q
ua
rt
ile
1
0.
34
[
0.
47
]
0.
34
[
0.
47
]
0.
37
[
0.
48
]
0.
35
[
0.
48
]
0.
40
[
0.
49
]
0.
28
[
0.
45
]
0.
33
[
0.
47
]
Q
ua
rt
ile
2
0.
33
[
0.
47
]
0.
33
[
0.
47
]
0.
33
[
0.
47
]
0.
33
[
0.
47
]
0.
33
[
0.
47
]
0.
34
[
0.
47
]
0.
33
[
0.
47
]
Q
ua
rt
ile
3
0.
24
[
0.
42
]
0.
23
[
0.
42
]
0.
22
[
0.
41
]
0.
23
[
0.
42
]
0.
21
[
0.
41
]
0.
27
[
0.
44
]
0.
24
[
0.
43
]
Q
ua
rt
ile
4
0.
09
[
0.
29
]
0.
09
[
0.
29
]
0.
08
[
0.
26
]
0.
09
[
0.
28
]
0.
06
[
0.
24
]
0.
11
[
0.
32
]
0.
09
[
0.
29
]
Li
vi
ng
lo
ca
ti
o
n
R
ur
al
a
re
a
0.
06
[
0.
23
]
0.
06
[
0.
24
]
0.
06
[
0.
23
]
0.
06
[
0.
23
]
0.
08
[
0.
28
]
0.
06
[
0.
24
]
0.
05
[
0.
22
]
U
rb
an
a
re
a
0.
94
[
0.
23
]
0.
94
[
0.
24
]
0.
94
[
0.
23
]
0.
94
[
0.
23
]
0.
92
[
0.
28
]
0.
94
[
0.
24
]
0.
95
[
0.
22
]
Pr
im
ar
y
pa
ye
r
Fe
e
fo
r
se
rv
ic
e
0.
54
[
0.
50
]
0.
49
[
0.
50
]
0.
66
[
0.
47
]
0.
59
[
0.
49
]
0.
62
[
0.
49
]
0.
52
[
0.
50
]
0.
46
[
0.
50
]
M
ed
ic
ar
e
A
dv
an
ta
ge
0.
22
[
0.
41
]
0.
24
[
0.
43
]
0.
25
[
0.
43
]
0.
19
[
0.
39
]
0.
26
[
0.
44
]
0.
20
[
0.
40
]
0.
21
[
0.
41
]
Pr
iv
at
e
in
su
ra
nc
e
0.
24
[
0.
43
]
0.
27
[
0.
44
]
0.
09
[
0.
29
]
0.
22
[
0.
41
]
0.
12
[
0.
32
]
0.
28
[
0.
45
]
0.
33
[
0.
47
]
T
o
ta
l n
um
be
r
o
f
co
m
o
rb
id
it
ie
s
2.
92
[
1.
89
]
2.
77
[
1.
78
]
3.
56
[
1.
79
]
3.
55
[
2.
04
]
2.
83
[
1.
77
]
2.
22
[
1.
58
]
2.
72
[
1.
90
]
H
ig
h
se
ve
ri
ty
(
w
it
h
m
aj
o
r
co
m
pl
ic
at
io
ns
o
r
co
m
o
rb
id
it
ie
s)
0.
19
[
0.
39
]
0.
17
[
0.
38
]
0.
30
[
0.
46
]
0.
26
[
0.
44
]
0.
32
[
0.
47
]
0.
05
[
0.
22
]
0.
15
[
0.
36
]
N
95
1,
21
5
10
6,
84
4
16
3,
37
8
13
6,
61
9
81
,6
22
15
0,
33
5
31
2,
41
7
N
ot
e.
A
M
I
=
a
cu
te
m
yo
ca
rd
ia
l i
nf
ar
ct
io
n;
H
F
=
h
ea
rt
f
ai
lu
re
; P
N
=
p
ne
um
o
ni
a;
C
O
PD
=
c
hr
o
ni
c
o
bs
tr
uc
ti
ve
p
ul
m
o
na
ry
d
is
ea
se
; H
IP
=
t
o
ta
l h
ip
o
r
kn
ee
a
ng
io
pl
as
ty
/r
ep
la
ce
m
en
t;
G
I
=
g
as
tr
o
in
te
st
in
al
c
o
nd
it
io
ns
. M
ed
ic
ar
e
FF
S
re
fe
rs
t
o
M
ed
ic
ar
e
fe
e-
fo
r-
se
rv
ic
e
be
ne
fic
ia
ri
es
. S
ta
nd
ar
d
de
vi
at
io
ns
a
re
in
b
ra
ck
et
s.
650 Medical Care Research and Review 76(5)
As noted above, the DDD approach implicitly assumes that
hospitals at-risk and
not at-risk for the HRRP share the same readmission shocks in a
given hospital and
year that are unrelated to the HRRP policy. The DD approach,
which instead used
as controls the within-hospital readmission shocks among
patients not included in
the HRRP program, may actually be preferable. Because little
basis exists for distin-
guishing these approaches ex ante, these models are probably
best viewed as com-
plementary approaches for exploring the validity of this study’s
key results.
We conduct additional analyses to explore potential sources of
bias. We compare
trends in each outcome between the targeted and nontargeted
admissions during the
pre-HRRP period. Similar pre-HRRP trends would support our
assumption that
changes from the pre-HRRP to post-HRRP periods would have
been similar for the
target and nontarget conditions in the absence of the HRRP
program. Considering that
CMS began publicly reporting hospital performance in July
2009 and hospitals might
start to respond by changing their behavior since then, we
restrict the pre-HRRP period
to be the first two quarters of 2009 and reestimated all the
specifications using the
alternative sample and the results stay robust.
Results
We observe several notable trends when examining the 30-day
all cause readmis-
sions by condition from 2008 to 2014 (see Figure 1). First, the
30-day readmission
rates of FFS patients followed similar trends from 2008 to 2009
across the five target
conditions and gastrointestinal condition. Second, the 30-day
readmission rates of
FFS patients with each of the five target conditions decreased or
stayed relatively
stable from 2012 to 2014, while the FFS patients with
gastrointestinal conditions
Figure 1. Thirty-day all-cause readmission trend by condition.
Note. HF = heart failure; PN = pneumonia; HIP = total hip or
knee replacement; GI = gastrointestinal
conditions.
Chen and Grabowski 651
experienced an increase in their 30-day readmission rate during
the same time
period. Finally, within the same condition, the 30-day
readmission rates of FFS and
Medicare Advantage patients followed similar trends from 2008
to 2009. We there-
fore use 2008-2009 as the pre-HRRP comparison period. When
comparing across
payers for a given target condition, we also observe that
Medicare readmissions
rates were consistently higher than the rates for privately
insured patients. Table 1
reports the descriptive statistics of the whole sample and by
each of the five target
conditions as well as the gastrointestinal condition. Compared
with the national
average, our sample has slightly higher 30-day all-cause
readmission rates in AMI
and heart failure and comparable readmission rates in
pneumonia, COPD, and total
hip or knee replacement.
We next examine the DD estimates on HRRP targeted
admissions using three dif-
ferent comparison groups (see Table 2). Compared with
Medicare FFS patients with
gastrointestinal conditions as the primary diagnosis, there was a
1% to 2% decrease in
30-day readmissions for comparable heart failure, pneumonia,
and COPD patients.
However, when compared with Medicare Advantage patients
with the same target
condition, we observe a statistically significant increase in 30-
day Medicare FFS read-
mission for AMI, heart failure, and pneumonia. Similarly, when
compared with
privately insured patients, 30-day readmissions for Medicare
FFS patients admitted
with AMI and heart failure increased. The results reveal that
although the HRRP tar-
geted Medicare FFS patients only, hospital readmission rates
declined substantially in
the MA and privately insured population after the HRRP,
especially among cardiac
related admissions. This may suggest that there are spillover
effects from the HRRP
extending to MA and privately insured patients. We then restrict
our attention to MA
and privately insured patients admitted with one of the five
HRRP target conditions
and compare changes in their readmissions to those of MA and
privately insured
Table 2. Difference-in-Differences (DID) Estimates of the
Effect of the Hospital
Readmissions Reduction Program on Medicare FFS 30-Day
Readmissions.
Medicare FFS patients
with GI conditions as
control
Medicare FFS with
Medicare Advantage,
same condition as control
Medicare FFS with
private insurance, same
condition as control
DID impact DID impact DID impact
(1) (2) (3)
(1) Heart attack −0.004 (0.005) 0.022*** (0.008) 0.023***
(0.007)
(2) Heart failure −0.007** (0.004) 0.012** (0.005) 0.020***
(0.008)
(3) Pneumonia −0.006* (0.003) 0.010* (0.006) 0.007 (0.005)
(4) Chronic obstructive
pulmonary disease
−0.018** (0.005) 0.005 (0.007) −0.006 (0.008)
(5) Total hip or knee
angioplasty
0.013 (0.008) 0.01 (0.011) 0.002 (0.007)
Note. FFS = fee-for-service; GI = gastrointestinal. All models
include control variables listed in Table 1 as well as hospital
fixed effects. The standard errors are clustered at hospital level.
Robust standard errors in parentheses.
*p < .1. **p < .05. ***p < .01.
652 Medical Care Research and Review 76(5)
patients with gastrointestinal conditions, respectively. The DD
estimates reported in
Appendix Table A1 confirmed that after passage of the HRRP,
hospitals reduced car-
diac-related readmissions not only for Medicare FFS patients,
but also for MA and
privately insured patients.
Next, we reran the DD estimation conditional on hospitals’
baseline readmission
performance (see Table 3). Compared with admissions with
gastrointestinal condi-
tions, index hospitalizations with target conditions at a hospital
“at risk” for penalties
had statistically significant lower …

More Related Content

Similar to The purpose of this initial paper is to briefly describe your sear.docx

Course Project Part 3—Translating Evidence Into PracticeIn Pa.docx
Course Project Part 3—Translating Evidence Into PracticeIn Pa.docxCourse Project Part 3—Translating Evidence Into PracticeIn Pa.docx
Course Project Part 3—Translating Evidence Into PracticeIn Pa.docxbuffydtesurina
 
NURS-6052N-37, Essent of Evidence-Based Pract.2017Discussion-1.docx
NURS-6052N-37, Essent of Evidence-Based Pract.2017Discussion-1.docxNURS-6052N-37, Essent of Evidence-Based Pract.2017Discussion-1.docx
NURS-6052N-37, Essent of Evidence-Based Pract.2017Discussion-1.docxcarlibradley31429
 
(1) Critique Template for a Qualitative StudyNURS 6052Week.docx
(1)  Critique Template for a Qualitative StudyNURS 6052Week.docx(1)  Critique Template for a Qualitative StudyNURS 6052Week.docx
(1) Critique Template for a Qualitative StudyNURS 6052Week.docxkatherncarlyle
 
Essent of Nursing homework help.docx
Essent of Nursing homework help.docxEssent of Nursing homework help.docx
Essent of Nursing homework help.docx4934bk
 
Systematic reviews
Systematic reviewsSystematic reviews
Systematic reviewsFowler Susan
 
Searching Databases (APA 7 format and at least 3-4 references)Wh.docx
Searching Databases (APA 7 format and at least 3-4 references)Wh.docxSearching Databases (APA 7 format and at least 3-4 references)Wh.docx
Searching Databases (APA 7 format and at least 3-4 references)Wh.docxrtodd280
 
COMPLETED WEEK 2In 350-400 Words1. Share an example of evidenc
COMPLETED WEEK 2In 350-400 Words1. Share an example of evidencCOMPLETED WEEK 2In 350-400 Words1. Share an example of evidenc
COMPLETED WEEK 2In 350-400 Words1. Share an example of evidencLynellBull52
 
COMPLETED WEEK 2In 350-400 Words1. Share an example of evidenc
COMPLETED WEEK 2In 350-400 Words1. Share an example of evidencCOMPLETED WEEK 2In 350-400 Words1. Share an example of evidenc
COMPLETED WEEK 2In 350-400 Words1. Share an example of evidencTaunyaCoffman887
 
HOSP3075 Brand Analysis Paper 1This is the first of three assignme.docx
HOSP3075 Brand Analysis Paper 1This is the first of three assignme.docxHOSP3075 Brand Analysis Paper 1This is the first of three assignme.docx
HOSP3075 Brand Analysis Paper 1This is the first of three assignme.docxsimonithomas47935
 
Course Code EDU7702-8Course Start Date 02152016Sec.docx
Course Code EDU7702-8Course Start Date 02152016Sec.docxCourse Code EDU7702-8Course Start Date 02152016Sec.docx
Course Code EDU7702-8Course Start Date 02152016Sec.docxvanesaburnand
 
Running head 11Concept and statistics (Refe.docx
Running head  11Concept and statistics (Refe.docxRunning head  11Concept and statistics (Refe.docx
Running head 11Concept and statistics (Refe.docxtoddr4
 
HighFidelity Simulation in Nursing Education for EndofLife Care Essay.pdf
HighFidelity Simulation in Nursing Education for EndofLife Care Essay.pdfHighFidelity Simulation in Nursing Education for EndofLife Care Essay.pdf
HighFidelity Simulation in Nursing Education for EndofLife Care Essay.pdfsdfghj21
 
#35538 Topic Week 10 Weighing the EvidenceNumber of Pages 1 .docx
#35538 Topic Week 10 Weighing the EvidenceNumber of Pages 1 .docx#35538 Topic Week 10 Weighing the EvidenceNumber of Pages 1 .docx
#35538 Topic Week 10 Weighing the EvidenceNumber of Pages 1 .docxAASTHA76
 
Critical Thinking in Nursing.pdf
Critical Thinking in Nursing.pdfCritical Thinking in Nursing.pdf
Critical Thinking in Nursing.pdfsdfghj21
 
Create a 3-5 page submission in which you develop a PICO(T) questi
Create a 3-5 page submission in which you develop a PICO(T) questiCreate a 3-5 page submission in which you develop a PICO(T) questi
Create a 3-5 page submission in which you develop a PICO(T) questiCruzIbarra161
 
Nurse Staffing Issues Evidence Based Practice Discussion.pdf
Nurse Staffing Issues Evidence Based Practice Discussion.pdfNurse Staffing Issues Evidence Based Practice Discussion.pdf
Nurse Staffing Issues Evidence Based Practice Discussion.pdfbkbk37
 
Basic Literature Search Strategies
Basic Literature Search StrategiesBasic Literature Search Strategies
Basic Literature Search StrategiesAhmad Al-Sadi
 

Similar to The purpose of this initial paper is to briefly describe your sear.docx (17)

Course Project Part 3—Translating Evidence Into PracticeIn Pa.docx
Course Project Part 3—Translating Evidence Into PracticeIn Pa.docxCourse Project Part 3—Translating Evidence Into PracticeIn Pa.docx
Course Project Part 3—Translating Evidence Into PracticeIn Pa.docx
 
NURS-6052N-37, Essent of Evidence-Based Pract.2017Discussion-1.docx
NURS-6052N-37, Essent of Evidence-Based Pract.2017Discussion-1.docxNURS-6052N-37, Essent of Evidence-Based Pract.2017Discussion-1.docx
NURS-6052N-37, Essent of Evidence-Based Pract.2017Discussion-1.docx
 
(1) Critique Template for a Qualitative StudyNURS 6052Week.docx
(1)  Critique Template for a Qualitative StudyNURS 6052Week.docx(1)  Critique Template for a Qualitative StudyNURS 6052Week.docx
(1) Critique Template for a Qualitative StudyNURS 6052Week.docx
 
Essent of Nursing homework help.docx
Essent of Nursing homework help.docxEssent of Nursing homework help.docx
Essent of Nursing homework help.docx
 
Systematic reviews
Systematic reviewsSystematic reviews
Systematic reviews
 
Searching Databases (APA 7 format and at least 3-4 references)Wh.docx
Searching Databases (APA 7 format and at least 3-4 references)Wh.docxSearching Databases (APA 7 format and at least 3-4 references)Wh.docx
Searching Databases (APA 7 format and at least 3-4 references)Wh.docx
 
COMPLETED WEEK 2In 350-400 Words1. Share an example of evidenc
COMPLETED WEEK 2In 350-400 Words1. Share an example of evidencCOMPLETED WEEK 2In 350-400 Words1. Share an example of evidenc
COMPLETED WEEK 2In 350-400 Words1. Share an example of evidenc
 
COMPLETED WEEK 2In 350-400 Words1. Share an example of evidenc
COMPLETED WEEK 2In 350-400 Words1. Share an example of evidencCOMPLETED WEEK 2In 350-400 Words1. Share an example of evidenc
COMPLETED WEEK 2In 350-400 Words1. Share an example of evidenc
 
HOSP3075 Brand Analysis Paper 1This is the first of three assignme.docx
HOSP3075 Brand Analysis Paper 1This is the first of three assignme.docxHOSP3075 Brand Analysis Paper 1This is the first of three assignme.docx
HOSP3075 Brand Analysis Paper 1This is the first of three assignme.docx
 
Course Code EDU7702-8Course Start Date 02152016Sec.docx
Course Code EDU7702-8Course Start Date 02152016Sec.docxCourse Code EDU7702-8Course Start Date 02152016Sec.docx
Course Code EDU7702-8Course Start Date 02152016Sec.docx
 
Running head 11Concept and statistics (Refe.docx
Running head  11Concept and statistics (Refe.docxRunning head  11Concept and statistics (Refe.docx
Running head 11Concept and statistics (Refe.docx
 
HighFidelity Simulation in Nursing Education for EndofLife Care Essay.pdf
HighFidelity Simulation in Nursing Education for EndofLife Care Essay.pdfHighFidelity Simulation in Nursing Education for EndofLife Care Essay.pdf
HighFidelity Simulation in Nursing Education for EndofLife Care Essay.pdf
 
#35538 Topic Week 10 Weighing the EvidenceNumber of Pages 1 .docx
#35538 Topic Week 10 Weighing the EvidenceNumber of Pages 1 .docx#35538 Topic Week 10 Weighing the EvidenceNumber of Pages 1 .docx
#35538 Topic Week 10 Weighing the EvidenceNumber of Pages 1 .docx
 
Critical Thinking in Nursing.pdf
Critical Thinking in Nursing.pdfCritical Thinking in Nursing.pdf
Critical Thinking in Nursing.pdf
 
Create a 3-5 page submission in which you develop a PICO(T) questi
Create a 3-5 page submission in which you develop a PICO(T) questiCreate a 3-5 page submission in which you develop a PICO(T) questi
Create a 3-5 page submission in which you develop a PICO(T) questi
 
Nurse Staffing Issues Evidence Based Practice Discussion.pdf
Nurse Staffing Issues Evidence Based Practice Discussion.pdfNurse Staffing Issues Evidence Based Practice Discussion.pdf
Nurse Staffing Issues Evidence Based Practice Discussion.pdf
 
Basic Literature Search Strategies
Basic Literature Search StrategiesBasic Literature Search Strategies
Basic Literature Search Strategies
 

More from helen23456789

The QuestionIs management in the public sector similar to or di.docx
The QuestionIs management in the public sector similar to or di.docxThe QuestionIs management in the public sector similar to or di.docx
The QuestionIs management in the public sector similar to or di.docxhelen23456789
 
The Question To Be AnsweredWhat managers most often want to kn.docx
The Question To Be AnsweredWhat managers most often want to kn.docxThe Question To Be AnsweredWhat managers most often want to kn.docx
The Question To Be AnsweredWhat managers most often want to kn.docxhelen23456789
 
The question What is Life” sounds like the premise of some bad lat.docx
The question What is Life” sounds like the premise of some bad lat.docxThe question What is Life” sounds like the premise of some bad lat.docx
The question What is Life” sounds like the premise of some bad lat.docxhelen23456789
 
the question is notions of visibility are central concepts within T.docx
the question is notions of visibility are central concepts within T.docxthe question is notions of visibility are central concepts within T.docx
the question is notions of visibility are central concepts within T.docxhelen23456789
 
The question is Research Plan and the topic for my research is Impac.docx
The question is Research Plan and the topic for my research is Impac.docxThe question is Research Plan and the topic for my research is Impac.docx
The question is Research Plan and the topic for my research is Impac.docxhelen23456789
 
The question Go to httpwww.heritage.orgindexRanking.aspx (.docx
The question Go to httpwww.heritage.orgindexRanking.aspx (.docxThe question Go to httpwww.heritage.orgindexRanking.aspx (.docx
The question Go to httpwww.heritage.orgindexRanking.aspx (.docxhelen23456789
 
The Question As the global recession evolved into a sovereign.docx
The Question As the global recession evolved into a sovereign.docxThe Question As the global recession evolved into a sovereign.docx
The Question As the global recession evolved into a sovereign.docxhelen23456789
 
The quesion is 

What are the characteristics of transnational tele.docx
The quesion is 

What are the characteristics of transnational tele.docxThe quesion is 

What are the characteristics of transnational tele.docx
The quesion is 

What are the characteristics of transnational tele.docxhelen23456789
 
The Queen of TreesThis video shows the intimate relationship.docx
The Queen of TreesThis video shows the intimate relationship.docxThe Queen of TreesThis video shows the intimate relationship.docx
The Queen of TreesThis video shows the intimate relationship.docxhelen23456789
 
The quesion is What are the characteristics of transnational te.docx
The quesion is What are the characteristics of transnational te.docxThe quesion is What are the characteristics of transnational te.docx
The quesion is What are the characteristics of transnational te.docxhelen23456789
 
The quasi-science of anticipating environmental and competitive ch.docx
The quasi-science of anticipating environmental and competitive ch.docxThe quasi-science of anticipating environmental and competitive ch.docx
The quasi-science of anticipating environmental and competitive ch.docxhelen23456789
 
the quastion Lets Use the Scientific Method !You are Captai.docx
the quastion Lets Use the Scientific Method !You are Captai.docxthe quastion Lets Use the Scientific Method !You are Captai.docx
the quastion Lets Use the Scientific Method !You are Captai.docxhelen23456789
 
The Qualitative Research Studies Adolescent Behaviors & Social .docx
The Qualitative Research Studies Adolescent Behaviors & Social .docxThe Qualitative Research Studies Adolescent Behaviors & Social .docx
The Qualitative Research Studies Adolescent Behaviors & Social .docxhelen23456789
 
The reflective essay took an emotional appeal. I can sense both sy.docx
The reflective essay took an emotional appeal. I can sense both sy.docxThe reflective essay took an emotional appeal. I can sense both sy.docx
The reflective essay took an emotional appeal. I can sense both sy.docxhelen23456789
 
The red coler with file are very importantAttached Files Fixedv.docx
The red coler with file are very importantAttached Files Fixedv.docxThe red coler with file are very importantAttached Files Fixedv.docx
The red coler with file are very importantAttached Files Fixedv.docxhelen23456789
 
The References MUST BE THIS BOOK AND WHATEVER SOURCE YOU WANT TO SI.docx
The References MUST BE THIS BOOK AND WHATEVER SOURCE YOU WANT TO SI.docxThe References MUST BE THIS BOOK AND WHATEVER SOURCE YOU WANT TO SI.docx
The References MUST BE THIS BOOK AND WHATEVER SOURCE YOU WANT TO SI.docxhelen23456789
 
The Reason Why Excelsior College Is My ChoiceEnglish 101Runn.docx
The Reason Why Excelsior College Is My ChoiceEnglish 101Runn.docxThe Reason Why Excelsior College Is My ChoiceEnglish 101Runn.docx
The Reason Why Excelsior College Is My ChoiceEnglish 101Runn.docxhelen23456789
 
The recovery phase of any disaster event creates a huge requirement .docx
The recovery phase of any disaster event creates a huge requirement .docxThe recovery phase of any disaster event creates a huge requirement .docx
The recovery phase of any disaster event creates a huge requirement .docxhelen23456789
 
The reevaluation process in special education is addressed at least .docx
The reevaluation process in special education is addressed at least .docxThe reevaluation process in special education is addressed at least .docx
The reevaluation process in special education is addressed at least .docxhelen23456789
 
The recruitment of employees is a critical part of the HR function a.docx
The recruitment of employees is a critical part of the HR function a.docxThe recruitment of employees is a critical part of the HR function a.docx
The recruitment of employees is a critical part of the HR function a.docxhelen23456789
 

More from helen23456789 (20)

The QuestionIs management in the public sector similar to or di.docx
The QuestionIs management in the public sector similar to or di.docxThe QuestionIs management in the public sector similar to or di.docx
The QuestionIs management in the public sector similar to or di.docx
 
The Question To Be AnsweredWhat managers most often want to kn.docx
The Question To Be AnsweredWhat managers most often want to kn.docxThe Question To Be AnsweredWhat managers most often want to kn.docx
The Question To Be AnsweredWhat managers most often want to kn.docx
 
The question What is Life” sounds like the premise of some bad lat.docx
The question What is Life” sounds like the premise of some bad lat.docxThe question What is Life” sounds like the premise of some bad lat.docx
The question What is Life” sounds like the premise of some bad lat.docx
 
the question is notions of visibility are central concepts within T.docx
the question is notions of visibility are central concepts within T.docxthe question is notions of visibility are central concepts within T.docx
the question is notions of visibility are central concepts within T.docx
 
The question is Research Plan and the topic for my research is Impac.docx
The question is Research Plan and the topic for my research is Impac.docxThe question is Research Plan and the topic for my research is Impac.docx
The question is Research Plan and the topic for my research is Impac.docx
 
The question Go to httpwww.heritage.orgindexRanking.aspx (.docx
The question Go to httpwww.heritage.orgindexRanking.aspx (.docxThe question Go to httpwww.heritage.orgindexRanking.aspx (.docx
The question Go to httpwww.heritage.orgindexRanking.aspx (.docx
 
The Question As the global recession evolved into a sovereign.docx
The Question As the global recession evolved into a sovereign.docxThe Question As the global recession evolved into a sovereign.docx
The Question As the global recession evolved into a sovereign.docx
 
The quesion is 

What are the characteristics of transnational tele.docx
The quesion is 

What are the characteristics of transnational tele.docxThe quesion is 

What are the characteristics of transnational tele.docx
The quesion is 

What are the characteristics of transnational tele.docx
 
The Queen of TreesThis video shows the intimate relationship.docx
The Queen of TreesThis video shows the intimate relationship.docxThe Queen of TreesThis video shows the intimate relationship.docx
The Queen of TreesThis video shows the intimate relationship.docx
 
The quesion is What are the characteristics of transnational te.docx
The quesion is What are the characteristics of transnational te.docxThe quesion is What are the characteristics of transnational te.docx
The quesion is What are the characteristics of transnational te.docx
 
The quasi-science of anticipating environmental and competitive ch.docx
The quasi-science of anticipating environmental and competitive ch.docxThe quasi-science of anticipating environmental and competitive ch.docx
The quasi-science of anticipating environmental and competitive ch.docx
 
the quastion Lets Use the Scientific Method !You are Captai.docx
the quastion Lets Use the Scientific Method !You are Captai.docxthe quastion Lets Use the Scientific Method !You are Captai.docx
the quastion Lets Use the Scientific Method !You are Captai.docx
 
The Qualitative Research Studies Adolescent Behaviors & Social .docx
The Qualitative Research Studies Adolescent Behaviors & Social .docxThe Qualitative Research Studies Adolescent Behaviors & Social .docx
The Qualitative Research Studies Adolescent Behaviors & Social .docx
 
The reflective essay took an emotional appeal. I can sense both sy.docx
The reflective essay took an emotional appeal. I can sense both sy.docxThe reflective essay took an emotional appeal. I can sense both sy.docx
The reflective essay took an emotional appeal. I can sense both sy.docx
 
The red coler with file are very importantAttached Files Fixedv.docx
The red coler with file are very importantAttached Files Fixedv.docxThe red coler with file are very importantAttached Files Fixedv.docx
The red coler with file are very importantAttached Files Fixedv.docx
 
The References MUST BE THIS BOOK AND WHATEVER SOURCE YOU WANT TO SI.docx
The References MUST BE THIS BOOK AND WHATEVER SOURCE YOU WANT TO SI.docxThe References MUST BE THIS BOOK AND WHATEVER SOURCE YOU WANT TO SI.docx
The References MUST BE THIS BOOK AND WHATEVER SOURCE YOU WANT TO SI.docx
 
The Reason Why Excelsior College Is My ChoiceEnglish 101Runn.docx
The Reason Why Excelsior College Is My ChoiceEnglish 101Runn.docxThe Reason Why Excelsior College Is My ChoiceEnglish 101Runn.docx
The Reason Why Excelsior College Is My ChoiceEnglish 101Runn.docx
 
The recovery phase of any disaster event creates a huge requirement .docx
The recovery phase of any disaster event creates a huge requirement .docxThe recovery phase of any disaster event creates a huge requirement .docx
The recovery phase of any disaster event creates a huge requirement .docx
 
The reevaluation process in special education is addressed at least .docx
The reevaluation process in special education is addressed at least .docxThe reevaluation process in special education is addressed at least .docx
The reevaluation process in special education is addressed at least .docx
 
The recruitment of employees is a critical part of the HR function a.docx
The recruitment of employees is a critical part of the HR function a.docxThe recruitment of employees is a critical part of the HR function a.docx
The recruitment of employees is a critical part of the HR function a.docx
 

Recently uploaded

Introduction to AI in Higher Education_draft.pptx
Introduction to AI in Higher Education_draft.pptxIntroduction to AI in Higher Education_draft.pptx
Introduction to AI in Higher Education_draft.pptxpboyjonauth
 
Micromeritics - Fundamental and Derived Properties of Powders
Micromeritics - Fundamental and Derived Properties of PowdersMicromeritics - Fundamental and Derived Properties of Powders
Micromeritics - Fundamental and Derived Properties of PowdersChitralekhaTherkar
 
_Math 4-Q4 Week 5.pptx Steps in Collecting Data
_Math 4-Q4 Week 5.pptx Steps in Collecting Data_Math 4-Q4 Week 5.pptx Steps in Collecting Data
_Math 4-Q4 Week 5.pptx Steps in Collecting DataJhengPantaleon
 
Separation of Lanthanides/ Lanthanides and Actinides
Separation of Lanthanides/ Lanthanides and ActinidesSeparation of Lanthanides/ Lanthanides and Actinides
Separation of Lanthanides/ Lanthanides and ActinidesFatimaKhan178732
 
How to Make a Pirate ship Primary Education.pptx
How to Make a Pirate ship Primary Education.pptxHow to Make a Pirate ship Primary Education.pptx
How to Make a Pirate ship Primary Education.pptxmanuelaromero2013
 
Contemporary philippine arts from the regions_PPT_Module_12 [Autosaved] (1).pptx
Contemporary philippine arts from the regions_PPT_Module_12 [Autosaved] (1).pptxContemporary philippine arts from the regions_PPT_Module_12 [Autosaved] (1).pptx
Contemporary philippine arts from the regions_PPT_Module_12 [Autosaved] (1).pptxRoyAbrique
 
Alper Gobel In Media Res Media Component
Alper Gobel In Media Res Media ComponentAlper Gobel In Media Res Media Component
Alper Gobel In Media Res Media ComponentInMediaRes1
 
Call Girls in Dwarka Mor Delhi Contact Us 9654467111
Call Girls in Dwarka Mor Delhi Contact Us 9654467111Call Girls in Dwarka Mor Delhi Contact Us 9654467111
Call Girls in Dwarka Mor Delhi Contact Us 9654467111Sapana Sha
 
PSYCHIATRIC History collection FORMAT.pptx
PSYCHIATRIC   History collection FORMAT.pptxPSYCHIATRIC   History collection FORMAT.pptx
PSYCHIATRIC History collection FORMAT.pptxPoojaSen20
 
Hybridoma Technology ( Production , Purification , and Application )
Hybridoma Technology  ( Production , Purification , and Application  ) Hybridoma Technology  ( Production , Purification , and Application  )
Hybridoma Technology ( Production , Purification , and Application ) Sakshi Ghasle
 
URLs and Routing in the Odoo 17 Website App
URLs and Routing in the Odoo 17 Website AppURLs and Routing in the Odoo 17 Website App
URLs and Routing in the Odoo 17 Website AppCeline George
 
Concept of Vouching. B.Com(Hons) /B.Compdf
Concept of Vouching. B.Com(Hons) /B.CompdfConcept of Vouching. B.Com(Hons) /B.Compdf
Concept of Vouching. B.Com(Hons) /B.CompdfUmakantAnnand
 
Kisan Call Centre - To harness potential of ICT in Agriculture by answer farm...
Kisan Call Centre - To harness potential of ICT in Agriculture by answer farm...Kisan Call Centre - To harness potential of ICT in Agriculture by answer farm...
Kisan Call Centre - To harness potential of ICT in Agriculture by answer farm...Krashi Coaching
 
Accessible design: Minimum effort, maximum impact
Accessible design: Minimum effort, maximum impactAccessible design: Minimum effort, maximum impact
Accessible design: Minimum effort, maximum impactdawncurless
 
Q4-W6-Restating Informational Text Grade 3
Q4-W6-Restating Informational Text Grade 3Q4-W6-Restating Informational Text Grade 3
Q4-W6-Restating Informational Text Grade 3JemimahLaneBuaron
 
Software Engineering Methodologies (overview)
Software Engineering Methodologies (overview)Software Engineering Methodologies (overview)
Software Engineering Methodologies (overview)eniolaolutunde
 
Incoming and Outgoing Shipments in 1 STEP Using Odoo 17
Incoming and Outgoing Shipments in 1 STEP Using Odoo 17Incoming and Outgoing Shipments in 1 STEP Using Odoo 17
Incoming and Outgoing Shipments in 1 STEP Using Odoo 17Celine George
 
Employee wellbeing at the workplace.pptx
Employee wellbeing at the workplace.pptxEmployee wellbeing at the workplace.pptx
Employee wellbeing at the workplace.pptxNirmalaLoungPoorunde1
 

Recently uploaded (20)

Introduction to AI in Higher Education_draft.pptx
Introduction to AI in Higher Education_draft.pptxIntroduction to AI in Higher Education_draft.pptx
Introduction to AI in Higher Education_draft.pptx
 
Micromeritics - Fundamental and Derived Properties of Powders
Micromeritics - Fundamental and Derived Properties of PowdersMicromeritics - Fundamental and Derived Properties of Powders
Micromeritics - Fundamental and Derived Properties of Powders
 
_Math 4-Q4 Week 5.pptx Steps in Collecting Data
_Math 4-Q4 Week 5.pptx Steps in Collecting Data_Math 4-Q4 Week 5.pptx Steps in Collecting Data
_Math 4-Q4 Week 5.pptx Steps in Collecting Data
 
Separation of Lanthanides/ Lanthanides and Actinides
Separation of Lanthanides/ Lanthanides and ActinidesSeparation of Lanthanides/ Lanthanides and Actinides
Separation of Lanthanides/ Lanthanides and Actinides
 
How to Make a Pirate ship Primary Education.pptx
How to Make a Pirate ship Primary Education.pptxHow to Make a Pirate ship Primary Education.pptx
How to Make a Pirate ship Primary Education.pptx
 
Contemporary philippine arts from the regions_PPT_Module_12 [Autosaved] (1).pptx
Contemporary philippine arts from the regions_PPT_Module_12 [Autosaved] (1).pptxContemporary philippine arts from the regions_PPT_Module_12 [Autosaved] (1).pptx
Contemporary philippine arts from the regions_PPT_Module_12 [Autosaved] (1).pptx
 
Alper Gobel In Media Res Media Component
Alper Gobel In Media Res Media ComponentAlper Gobel In Media Res Media Component
Alper Gobel In Media Res Media Component
 
Model Call Girl in Bikash Puri Delhi reach out to us at 🔝9953056974🔝
Model Call Girl in Bikash Puri  Delhi reach out to us at 🔝9953056974🔝Model Call Girl in Bikash Puri  Delhi reach out to us at 🔝9953056974🔝
Model Call Girl in Bikash Puri Delhi reach out to us at 🔝9953056974🔝
 
Call Girls in Dwarka Mor Delhi Contact Us 9654467111
Call Girls in Dwarka Mor Delhi Contact Us 9654467111Call Girls in Dwarka Mor Delhi Contact Us 9654467111
Call Girls in Dwarka Mor Delhi Contact Us 9654467111
 
Código Creativo y Arte de Software | Unidad 1
Código Creativo y Arte de Software | Unidad 1Código Creativo y Arte de Software | Unidad 1
Código Creativo y Arte de Software | Unidad 1
 
PSYCHIATRIC History collection FORMAT.pptx
PSYCHIATRIC   History collection FORMAT.pptxPSYCHIATRIC   History collection FORMAT.pptx
PSYCHIATRIC History collection FORMAT.pptx
 
Hybridoma Technology ( Production , Purification , and Application )
Hybridoma Technology  ( Production , Purification , and Application  ) Hybridoma Technology  ( Production , Purification , and Application  )
Hybridoma Technology ( Production , Purification , and Application )
 
URLs and Routing in the Odoo 17 Website App
URLs and Routing in the Odoo 17 Website AppURLs and Routing in the Odoo 17 Website App
URLs and Routing in the Odoo 17 Website App
 
Concept of Vouching. B.Com(Hons) /B.Compdf
Concept of Vouching. B.Com(Hons) /B.CompdfConcept of Vouching. B.Com(Hons) /B.Compdf
Concept of Vouching. B.Com(Hons) /B.Compdf
 
Kisan Call Centre - To harness potential of ICT in Agriculture by answer farm...
Kisan Call Centre - To harness potential of ICT in Agriculture by answer farm...Kisan Call Centre - To harness potential of ICT in Agriculture by answer farm...
Kisan Call Centre - To harness potential of ICT in Agriculture by answer farm...
 
Accessible design: Minimum effort, maximum impact
Accessible design: Minimum effort, maximum impactAccessible design: Minimum effort, maximum impact
Accessible design: Minimum effort, maximum impact
 
Q4-W6-Restating Informational Text Grade 3
Q4-W6-Restating Informational Text Grade 3Q4-W6-Restating Informational Text Grade 3
Q4-W6-Restating Informational Text Grade 3
 
Software Engineering Methodologies (overview)
Software Engineering Methodologies (overview)Software Engineering Methodologies (overview)
Software Engineering Methodologies (overview)
 
Incoming and Outgoing Shipments in 1 STEP Using Odoo 17
Incoming and Outgoing Shipments in 1 STEP Using Odoo 17Incoming and Outgoing Shipments in 1 STEP Using Odoo 17
Incoming and Outgoing Shipments in 1 STEP Using Odoo 17
 
Employee wellbeing at the workplace.pptx
Employee wellbeing at the workplace.pptxEmployee wellbeing at the workplace.pptx
Employee wellbeing at the workplace.pptx
 

The purpose of this initial paper is to briefly describe your sear.docx

  • 1. The purpose of this initial paper is to briefly describe your search strategies when identifying two articles that pertain to an evidence-based practice topic of interest. Mine is on Avoiding Hospital Readmissions. I will be focusing as an individual on examining the sources of knowledge that contribute to professional nursing practice qualitative or quantitative design? Apply research principles to the interpretation of the content of published research studies. "What is the number of trends in 30- day post-discharge mortality among beneficiaries after the implementation of HRRP -- period 3 and 4, for mortality rate in myocardial infarctions?" (Wadhera, et al., 2018) Clinical Question: A. Describe problem b. Significance of problem in terms of outcomes or statistics c. Your PICOT question in support of the group topic d. Purpose of your paper B. Levels of Evidence a. Type of question asked b. Best evidence found to answer question C. Search Strategy a. Search terms b. Databases used (you may use Google Scholar in addition to the library databases; start with the Library) c. Refinement decisions made d. Identification of two most relevant articles D. Format a. Correct grammar and spelling b. Use of headings for each section
  • 2. c. Use of APA format (sixth edition) d. Page length: three to four pages Clinical Question 45 points 28%1. Problem is described. What is the focus of your group’s work? 2. Significance of the problem is described. What health outcomes result from your problem? Or what statistics document this is a problem? You may find support on websites for government or professional organizations. 3. What is your PICOT question? 4. Purpose of your paper. What will your paper do or describe? This is similar to a problem statement. “The purpose of this paper is to . . .” Levels of Evidence 20 points 13% 1. What type of question are you asking (therapy, prognosis, meaning, etc.)? 2. What is the best type of evidence to be found to answer that question (e.g., RCT, cohort study, qualitative study)? Search Strategy 65 points 41% 1. Search topic(s) provided. What did you use for search terms? 2. What database(s) did you use? Link your search with the PICOT question described above. 3. As you did your search, what decisions did you make in refinement to get your required articles down to a reasonable number for review? Were any limits used? If so, what? 4. Identify the two most relevant and helpful articles that will provide guidance for your next paper and the group’s work. Why were these two selected? Format 30 points 18% 1. Correct grammar and spelling 2. Use of headings for each section: Clinical Question, Level of Evidence, Search Strategy, Conclusion 3. APA format (sixth ed.) 4. Paper length: three to four pages
  • 3. Total worth 160 points DIRECTIONS AND ASSIGNMENT CRITERIA Assign ment Criteria Points % Description Clinical Question 45 28 1. Problem is described. What is the focus of your group’s work? 2. Significance of the problem is described. What health outcomes result from your problem? Or what statistics document this is a problem? You may find support on websites for government or professional organizations. 3. What is your PICOT question? 4. Purpose of your paper. What will your paper do or describe? This is similar to a problem statement. “The purpose of this paper is to . . .” Levels of Evidence 20 13 1. What type of question are you asking (therapy, prognosis, meaning, etc.)? 2. What is the best type of evidence to be found to answer that question (e.g., RCT, cohort study, qualitative study)? Search Strategy 65 41 1. Search topic(s) provided. What did you use for search terms? 2. What database(s) did you use? Link your search with the PICOT question described above. 3. As you did your search, what decisions did you make in refinement to get your required articles down to a reasonable number for review? Were any limits used? If so, what? 4. Identify the two most relevant and helpful articles that will provide guidance for your next paper and the group’s work. Why were these two selected? Format 30 18 1. Correct grammar and spelling 2. Use of headings for each section: Clinical Question, Level of Evidence, Search Strategy,
  • 4. Conclusion 3. APA format (sixth ed.) 4. Paper length: three to four pages The purpose of this initial paper is to briefly describe your search strategies when identifying two articles that pertain to an evidence - based practice topic of interest . Mine is on Avoiding Hospital Readmissions. I will be focusing as an individual on e xamin ing the sources of knowledge that contribute to professional nursing practic e qualitative or quantitative design? A pply research principles to the interpretation of the content of published research studies. "What is the number of trends in 30 - day post - discharge mortality among beneficiaries after the implementation of HRRP -- period 3 and 4, for mortality rate in myocardial
  • 5. infarctions?" (Wadhera, et al., 2018) Clinical Question : A . Describe problem b. Significance of problem in terms of outcomes or statistics c. Your PICOT question in support of the group to pic d. Purpose of your paper B . Levels of Evidence a. Type of question asked b. Best evidence found to answer question C. Search Strategy
  • 6. a. Search terms b. Databases used (you may use Google Scholar in addition to the library databases; start with the Lib rary) c. Refinement decisions made d. Identification of two most relevant articles D. Format a. Correct grammar and spelling b. Use of headings for each section c. Use of APA format (sixth edition) The purpose of this initial paper is to briefly describe your search strategies when identifying two articles that pertain to an evidence-based practice topic of interest. Mine is on Avoiding Hospital Readmissions. I will be focusing as an individual on examining the sources of knowledge that contribute to professional nursing practice qualitative or quantitative design? Apply research principles to the interpretation of the content of published research studies. "What is the number of trends in 30-day post-discharge mortality among beneficiaries after the implementation of HRRP -- period 3 and 4, for mortality rate in myocardial
  • 7. infarctions?" (Wadhera, et al., 2018) Clinical Question: A. Describe problem b. Significance of problem in terms of outcomes or statistics c. Your PICOT question in support of the group topic d. Purpose of your paper B. Levels of Evidence a. Type of question asked b. Best evidence found to answer question C. Search Strategy a. Search terms b. Databases used (you may use Google Scholar in addition to the library databases; start with the Library) c. Refinement decisions made d. Identification of two most relevant articles D. Format a. Correct grammar and spelling b. Use of headings for each section c. Use of APA format (sixth edition) Running head: 1 NURSING 2
  • 8. Nursing Vanessa Noa Grand Canyon University 05/10/2020 Nursing Patient safety is a critical issue in care delivery in skilled nursing facilities (SNFs). Given the complexity arising from the prevention of falls, SNFs need to take better fall prevention practices to enhance the quality of care service delivery. The practices to prevent falls for short-term rehabilitative stays should be tailored by skilled nursing staff and successfully implemented and sustained to align with healthcare priorities that work best for the patients. Different researches by different scholars on patient’s fall give detailed literature on how skilled nursing facilities improve the situation through nurse education to ensure the safety of patients in nursing home healthcare. Comparison of Research Question Studies by the eight authors on patient safety as a crucial issue in nursing home healthcare focused on why patient falls are a dominant issue and what can be done to solve the problem. For instance, Katrina, H. (2018), in his research, wants to get
  • 9. detailed knowledge of why falls remain an issue and complex issues and what measures can resolve the issue undermining patient safety. Katrina, H. (2018), Jang and Lee, (2015); and Uymaz and Nahcivan, (2016) their research question studies on how education program is a solution to this challenging issue. Generally, the research by these eight different authors base their question on factors leading to falls and measures to prevent patient falls. The research questions for the eight studies seeks to research on evidence-based interventions that have shown effectiveness in minimizing patient falls in nursing home healthcare. Kuhlenschmidt et al., (2016) and Minnier et al., (2019) base his research question on falls among cancer patients who need early interventions to help them from getting into the problem. According to the questions in comparison, the problem statement is how healthcare specialists can intervene by exhibiting a positive attitude toward teamwork to find solutions to patient falls. Comparison of Sample Populations The eight researches recruit its sample from populations sharing the same charcate4ristics to give reliable and valid findings. In all eight samples, the sample sizes are recommendable because they do not exceed 1000, in which the samples are drawn between 50 to 100 participants. The statistical population of the researches provides researchers with a base for drawing statistical inferences based on a random sample taken from the population (Zhao et al., 2019). For instance, the generalization of patient falls in all researches is based on what causes exists now, ever existed, or what will exist in the future in skilled nursing facilities. General Findings The formation of teams, offering education, improved education on falls among community older people, and interprofessional community services can help in combating patient falls within skilled nursing facilities. These methods for fall prevention involve managing of underlying fall risk factors
  • 10. of patients (Howard, 2018). The methods focus on education as a training tool for nurses and patients on how the problem takes place and how it can be prevented. Comparison of The Limitations of The Study Characteristics of design or methodology impact and influence the findings’ interpretation from the research, hence leading to a significant limitation. The characteristics are constraints on generalizability and applications of the findings to practice (S. R., 2016). Also, the study limitations are its flaws resulting from the unavailability of resources, small sample size, and flawed methodologies (Murray, 2016). There is no evident study that is flawless or includes all likely aspects. Therefore, the listing of the limitations reflects transparency and honesty in findings. These limitations undermine the answering of the research questions; hence the study cannot address them correctly. Accessing the target population is a limitation. The studies depended on accessing patients, skilled nursing facilities, and the authority to access confidential information of patients. In the healthcare setting, patient confidentiality and privacy is critical and strictly followed. In the data collection section, this issue may undermine getting reliable and valid results that can display a comparison on answering the research question. Further, inadequate literature review limits the reliability of the research (Sullivan, et al., 2015). Literature in any research forms a basis for the researcher to set a strong foundation for achieving the objectives. If literature is unavailable, the research problem becomes narrow and cannot guarantee to solve the problem under study. Conclusion and Recommendations Prevention of falls in the elderly long-term care facilities is critical to patient safety. Elderly is vulnerable to falls and fall-related injuries within skilled nursing facilities. The implementation of educational programs to equip nurses with detailed knowledge on curbing patient falls will improve patient safety. Among pediatric
  • 11. patients, evidence-based interventions can help in preventing falls. Studies have evaluated the effectiveness of interventions and strategies on the incidence of falls in nursing home patients. Giving skills and motivating staff is essential in long- term care facilities since nurses learn how to follow guidelines in maintaining patient safety. It is recommendable that; I. Involvement of pediatric staff to influence the program’s success II. Inspire nurses to develop a positive attitude to attain interprofessional teamwork events’ goals III. Educate patients on medications to assist in reducing the risk of falls IV. Customize education program to keep with the perceived risk of falls among patients References Howard, K. (2018). Improving Fall Rates Using Bedside Debriefings and Reflective Emails: One Unit’s Success Story. MEDSURG Nursing, 27(6), 388–391. Jang, M., & Lee, Y. (2015). The Effects of an Education Program on Home Renovation for Fall Prevention of Korean Older People. Educational Gerontology, 41(9), 653–669. https://doi.org/10.1080/03601277.2015.1033219
  • 12. Kuhlenschmidt, M. L., Reeber, C., Wallace, C., Yanwen Chen, Barnholtz-Sloan, J., & Mazanec, S. R. (2016). Tailoring Education to Perceived Fall Risk in Hospitalized Patients with Cancer: A Randomized, Controlled Trial. Clinical Journal of Oncology Nursing, 20(1), 84–89. https://doi.org/10.1188/16.CJON.84-89 Minnier, W., Leggett, M., Persaud, I., & Breda, K. (2019). Four Smart Steps: Fall Prevention for Community-Dwelling Older Adults. Creative Nursing, 25(2), 169–175. https://doi.org/10.1891/1078-4535.25.2.169 Murray, E. (2016). Quality Improvement. Implementing a Pediatric Fall Prevention Policy and Program. Pediatric Nursing, 42(5), 256–259. Sullivan, K., Charrette, A., Massey, C., Bartlett, D., Walker, C., Bond, I., … Fong, J. J. (2015). Interprofessional education with a community fall prevention event. Journal of Interprofessional Care, 29(4), 374–376. https://doi.org/10.3109/13561820.2014.969834 Uymaz, P. E., & Nahcivan, N. O. (2016). Evaluation of a nurse- led fall prevention education program in Turkish nursing home residents. Educational Gerontology, 42(5), 299–309. https://doi.org/10.1080/03601277.2015.1109403 Zhao, Y. (Lucy), Bott, M., He, J., Kim, H., Park, S. H., &amp; Dunton, N. (2019). Evidence on Fall and Injurious Fall Prevention Interventions in Acute Care Hospitals. Journal of Nursing Administration, 49(2), 86–92. https://doi.org/10.1097/NNA.0000000000000715
  • 13. Association of the Hospital Readmissions Reduction Program With Mortality Among Medicare Beneficiaries Hospitalized for Heart Failure, Acute Myocardial Infarction, and Pneumonia Rishi K. Wadhera, MD, MPP, MPhil; Karen E. Joynt Maddox, MD, MPH; Jason H. Wasfy, MD, MPhil; Sebastien Haneuse, PhD; Changyu Shen, PhD; Robert W. Yeh, MD, MSc IMPORTANCE The Hospital Readmissions Reduction Program (HRRP) has been associated with a reduction in readmission rates for heart failure (HF), acute myocardial infarction (AMI), and pneumonia. It is unclear whether the HRRP has been associated with change in patient mortality. OBJECTIVE To determine whether the HRRP was associated with a change in patient mortality. DESIGN, SETTING, AND PARTICIPANTS Retrospective cohort study of hospitalizations for HF, AMI, and pneumonia among Medicare fee-for-service beneficiaries aged at least 65 years across 4 periods from April 1, 2005, to March 31, 2015. Period 1 and period 2 occurred before the HRRP to establish baseline trends (April 2005-September 2007 and October
  • 14. 2007-March 2010). Period 3 and period 4 were after HRRP announcement (April 2010 to September 2012) and HRRP implementation (October 2012 to March 2015). EXPOSURES Announcement and implementation of the HRRP. MAIN OUTCOMES AND MEASURES Inverse probability– weighted mortality within 30 days of discharge following hospitalization for HF, AMI, and pneumonia, and stratified by whether there was an associated readmission. An additional end point was mortality within 45 days of initial hospital admission for target conditions. RESULTS The study cohort included 8.3 million hospitalizations for HF, AMI, and pneumonia, among which 7.9 million (mean age, 79.6 [8.7] years; 53.4% women) were alive at discharge. There were 3.2 million hospitalizations for HF, 1.8 million for AMI, and 3.0 million for pneumonia. There were 270 517 deaths within 30 days of discharge for HF, 128 088 for AMI, and 246 154 for pneumonia. Among patients with HF, 30-day postdischarge mortality increased before the announcement of the HRRP (0.27% increase from period 1 to period 2). Compared with this baseline trend, HRRP announcement (0.49% increase from period 2 to period 3; difference in change, 0.22%, P = .01) and implementation (0.52% increase from period 3 to period 4; difference in change, 0.25%, P = .001) were significantly associated with an increase in postdischarge mortality. Among patients with AMI, HRRP announcement was associated with a decline in postdischarge mortality (0.18% pre-HRRP increase vs
  • 15. 0.08% post-HRRP announcement decrease; difference in change, −0.26%; P = .01) and did not significantly change after HRRP implementation. Among patients with pneumonia, postdischarge mortality was stable before HRRP (0.04% increase from period 1 to period 2), but significantly increased after HRRP announcement (0.26% post-HRRP announcement increase; difference in change, 0.22%, P = .01) and implementation (0.44% post-HPPR implementation increase; difference in change, 0.40%, P < .001). The overall increase in mortality among patients with HF and pneumonia was mainly related to outcomes among patients who were not readmitted but died within 30 days of discharge. For all 3 conditions, HRRP implementation was not significantly associated with an increase in mortality within 45 days of admission, relative to pre-HRRP trends. CONCLUSIONS AND RELEVANCE Among Medicare beneficiaries, the HRRP was significantly associated with an increase in 30-day postdischarge mortality after hospitalization for HF and pneumonia, but not for AMI. Given the study design and the lack of significant association of the HRRP with mortality within 45 days of admission, further research is needed to understand whether the increase in 30-day postdischarge mortality is a result of the policy. JAMA. 2018;320(24):2542-2552. doi:10.1001/jama.2018.19232 Editorial page 2539 Supplemental content
  • 16. Author Affiliations: Author affiliations are listed at the end of this article. Corresponding Authors: Robert W. Yeh, MD, MSc, and Changyu Shen, PhD, Smith Center for Outcomes Research in Cardiology, Beth Israel Deaconess Medical Center, 375 Longwood Ave, Boston, MA 02215 ([email protected]). Research JAMA | Original Investigation 2542 (Reprinted) jama.com © 2018 American Medical Association. All rights reserved. https://jama.jamanetwork.com/article.aspx?doi=10.1001/jama.2 018.19232&utm_campaign=articlePDF%26utm_medium=article PDFlink%26utm_source=articlePDF%26utm_content=jama.2018 .19232 https://jama.jamanetwork.com/article.aspx?doi=10.1001/jama.2 018.19325&utm_campaign=articlePDF%26utm_medium=article PDFlink%26utm_source=articlePDF%26utm_content=jama.2018 .19232 mailto:[email protected] http://www.jama.com/?utm_campaign=articlePDF%26utm_medi um=articlePDFlink%26utm_source=articlePDF%26utm_content =jama.2018.19232 T he Hospital Readmissions Reduction Program (HRRP)was
  • 17. established under the Affordable Care Act (ACA) in2010 and required that the Centers for Medicare & Med- icaid Services (CMS) impose financial penalties on hospitals with higher-than-expected 30-day readmission rates for pa- tients with heart failure, acute myocardial infarction, and pneu- monia, beginning in 2012.1 After the announcement of the HRRP, readmission rates among Medicare beneficiaries de- clined for target conditions nationwide.2,3 Recently, how- ever, policy makers and physicians have raised concern that the HRRP may have also had unintended consequences that adversely affected patient care, potentially leading to in- creased mortality.4,5 For instance, the financial penalties im- posed by the HRRP may have inadvertently pushed some phy- sicians to avoid indicated readmissions, potentially diverted hospital resources and efforts away from other quality im- provement initiatives, or worsened quality of care at resource- poor hospitals that are often penalized by the program. How- ever, it is also possible that the same mechanisms by which some hospitals have reduced readmissions, such as im- proved coordination and transitions of care, resulted in reduc- tions in mortality. Understanding whether the HRRP has been associated with changes in mortality at the patient level is important as policy makers evaluate this program, particularly given the ongoing expansion of the HRRP to include other conditions6 and the almost $2 billion in financial penalties that have been imposed on hospitals since 2012.7 This study aims to answer 3 questions. First, compared with past trends, was the announcement or implementation of the HRRP associated with a change in mortality within 30 days of discharge fol- lowing hospitalization for heart failure, acute myocardial infarction, or pneumonia? Second, was the HRRP associated with a change in the distribution of patients who experienced death and no readmission, readmission and no death, read-
  • 18. mission and death, or no death and no readmission during the 30 days after discharge? Third, was the HRRP associated with a change in mortality within 45 days of hospital admis- sion for target conditions? Methods Institutional review board approval, including waiver of the requirement of participant informed consent because the data were deidentified, was provided by the Beth Israel Deacon- ess Medical Center. Study Cohort We used Medicare Provider Analysis and Review files to iden- tify hospital admissions and discharges at short-term acute care hospitals from April 1, 2005, through March 31, 2015, with a principal discharge diagnosis of heart failure, acute myo- cardial infarction, or pneumonia. Study cohorts were de- fined using International Classification of Diseases, Ninth Revision, Clinical Modification codes used in the publicly re- ported CMS readmission and mortality measures.8-10 We in- cluded Medicare beneficiaries aged 65 years or older in the analysis. We excluded patients who were discharged against medic al advice, were not enrolled in Medic are fee-for- service for at least 30 days after discharge (absent death), or were enrolled in Medicare fee-for-service for less than 1 year before hospitalization. Transfers to other hospitals were linked to a single index hospitalization. To examine 30-day postdischarge outcomes, we also excluded patients who died during hospitalization. Comorbidities were defined using CMS hierarchical condition categories based on Medicare claims up to 1 year before hospitalization.11 Specifically, we used covariates in the CMS risk-adjustment models for heart fail- ure, acute myocardial infarction, and pneumonia,12-14 as has been done in previous studies.2,15 The race/ethnicity of all pa-
  • 19. tients was identified based on claims files and was desig- nated into the following fixed categories: white, black, or other. Race/ethnicity was included as a covariate in the analysis be- cause it is associated with mortality for target conditions.16 Study Periods We identified 4 nonoverlapping study periods of equal dura- tion for index hospitalization. We chose to evaluate differ- ences in outcomes between time periods, rather than annual trends, for 2 reasons. First, we were interested in changes in outcomes among time periods defined by their relationship to the announcement and implementation of the HRRP, rather than within-period trends. Second, this strategy avoids as- sumptions on how the HRRP imposes its effect on different pa- tient groups (eg, assumptions on main effects and interaction terms) and of a linear relationship between outcomes and time and continuous confounders in a conventional logistic or mul- tinominal regression model. We identified 2 study periods before the HRRP was estab- lished to examine baseline trends in outcomes. The first study period included hospitalizations from April 2005 to Septem- ber 2007 (period 1) and the second included hospitalizations from October 2007 to March 2010 (period 2). Two periods af- ter the HRRP was established were also included: 1 following the initial announcement of HRRP with passage of the ACA from April 2010 through September 2012 (period 3) and the other between October 2012 and March 2015 (period 4), which Key Points Question Was the announcement and implementation of the Hospital Readmissions Reduction Program (HRRP) associated with an increase in patient-level mortality? Findings In this retrospective cohort study that included
  • 20. approximately 8 million Medicare beneficiary fee-for-service hospitalizations from 2005 to 2015, implementation of the HRRP was associated with a significant increase in trends in 30-day postdischarge mortality among beneficiaries hospitalized for heart failure and pneumonia, but not for acute myocardial infarction. Meaning There was a statistically significant association with implementation of the HRRP and increased post-discharge mortality for patients hospitalized for heart failure and pneumonia, but whether this finding is a result of the policy requires further research. Association of the Hospital Readmissions Reduction Program With Heart Failure, AMI, and Pneumonia Mortality Original Investigation Research jama.com (Reprinted) JAMA December 25, 2018 Volume 320, Number 24 2543 © 2018 American Medical Association. All rights reserved. http://www.jama.com/?utm_campaign=articlePDF%26utm_medi um=articlePDFlink%26utm_source=articlePDF%26utm_content =jama.2018.19232 is when the HRRP was implemented and hospitals were sub- jected to financial penalties. For patients with multiple hos- pitalizations within a time period, 1 index hospitalization was randomly selected for each condition. Outcomes Patient mortality within 30 days of discharge after a hospital- ization (postdischarge mortality) for heart failure, acute myo-
  • 21. cardial infarction, and pneumonia was evaluated, which has been done in previous hospital-level analyses.17-19 The follow- ing 30-day postdischarge outcome subgroups were also ex- amined: (1) death and no readmission, (2) readmission and death, (3) readmission and no death, and (4) no readmission and no death. These subgroup outcomes were examined to try to provide mechanistic insights on the relationship between readmission and mortality. To fully assess trends in mortality related to a complete clinical episode, 45-day patient mortal- ity rates following admission (postadmission mortality) were also evaluated, because efforts to reduce readmissions could potentially encompass care during hospitalization and might influence discharge timing and location of death. This mea- sure included varying hospital lengths of stay and captured both in-hospital and 30-day postdischarge deaths for the ma- jority of the cohort. Statistical Analysis To account for a potential imbalance in case mix between study periods, a propensity score approach (ie, the probability of being in a specific period given the demographics and comor- bidities of the patient and calendar month of hospitalization) was used to standardize populations among periods. Patient demographics, comorbidities, and seasonal indicators (calen- dar month) from period 4 were used as a reference to re- weight observed outcomes in all other study periods. Logis- tic regression models were fit on data from periods 1 and 4 to obtain a propensity score for period 1. The propensity score was then used to weight the outcomes in period 1, generating event rates through inverse probability weighting (IPW) that would have been observed if period 1 had the same case mix as pe- riod 4. Similarly, separate logistic regression models were fit to data from periods 2 and 4 and periods 3 and 4 to provide IPW-adjusted event rates in periods 2 and 3, respectively. This approach allowed the calculated distribution of each out-
  • 22. come in each of the 4 periods to be based on the same case mix (ie, the case mix from period 4).20 Because the primary aim was to understand the association of the HRRP with mortal- ity at the individual level, we did not examine hospital-level effects in the analysis. To establish the change in rates of outcomes after the an- nouncement of the HRRP, the change in event rates between periods 2 and 3 was calculated. Similarly, the change in rates of outcomes between periods 3 and 4 was also calculated to examine the change in outcomes between the announce- ment and the implementation of the HRRP (Figure 1). To isolate the association between the HRRP and the out- comes, we sought to remove secular trends for each out- come. To do so, the change in outcomes between periods 1 and 2 was computed to establish a baseline trend in outcomes be- fore the announcement and implementation of the HRRP. This difference was then subtracted from the change in outcomes after the announcement of the HRRP (between periods 2 and 3) to account for trends that were unrelated to the HRRP. Simi- larly, the baseline difference was also subtracted from the change in outcomes after the implementation of the HRRP, be- tween periods 3 and 4. Additional Analyses Several sensitivity analyses were performed. First, patients enrolled in hospice were excluded because greater use of hospice care at the end of life might shift deaths that previ- ously occurred within a hospital to the postdischarge setting over time.21,22 Second, because 1 hospitalization was ran- domly selected for patients that experienced multiple hospi- talizations in a given study period, the main analysis was repeated using the first hospitalization for each patient in each study period as well as all hospitalizations for each
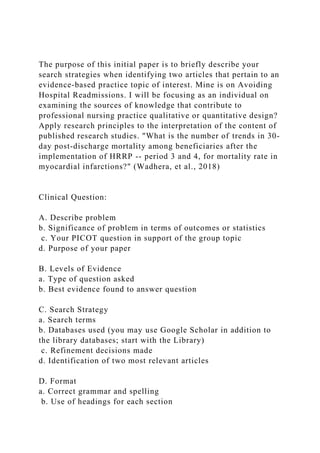
  • 23. Figure 1. Study Periods and Analytic Approach in a Study of the Association Between the Hospital Readmissions Reduction Program (HRRP) and Mortality Period 1 (April 2005- September 2007) Period 2 (October 2007- March 2010) Period 3 (April 2010- September 2012) Period 4 (October 2012- April 2015) Baseline change in mortality before HRRP announcement Difference in change in mortality prior to HRRP (A) compared with change after HRRP announcement (B) Difference in change in mortality before HRRP (A) compared with change after HRRP implementation (C) Change in mortality
  • 24. after HRRP announcement Change in mortality after HRRP implementation HRRP Announcement (April 2010) HRRP Implementation (October 2012) Calculation A Calculation Calculation Calculation B Calculation C Research Original Investigation Association of the Hospital Readmissions Reduction Program With Heart Failure, AMI, and Pneumonia Mortality 2544 JAMA December 25, 2018 Volume 320, Number 24 (Reprinted) jama.com © 2018 American Medical Association. All rights reserved. http://www.jama.com/?utm_campaign=articlePDF%26utm_medi um=articlePDFlink%26utm_source=articlePDF%26utm_content =jama.2018.19232 patient. Third, the entire analysis for postdischarge mortality
  • 25. was repeated using outcome regression within each study period to generate predicted outcomes for the case-mix in period 4, which were then directly compared across periods to ensure the results were not sensitive to the analytic approach used. More details on the methodologic approach are provided in the Supplement. Significance testing was performed using z tests, with standard error estimates that accounted for in- verse probability weighting. Statistical tests were 2-sided at a significance level of .05. The false discovery rate (FDR) based multiple comparison procedure was used to assess the statis- tical significance of the difference in the change in mortality- related end points (eg, aggregate mortality, mortality with or without readmission) at the FDR level of 0.05.23,24 Analyses were performed using SAS version 9.4 (SAS Institute). Results There were 8 326 688 Medicare fee-for-service hospitaliza- tions for heart failure, acute myocardial infarction, and pneu- monia from April 1, 2005, to March 31, 2015, among which 7 948 937 patients were alive at hospital discharge. The mean (SD) age of the study population was 79.6 (8.7) years, 4 246 45 4 partic ipants (53.4%) were women, 6 802 296 (85.6%) were white, and 738 198 (9.3%) were black. There were 3.2 million hospitalizations for heart failure, 1.8 million for acute myocardial infarction, and 3.0 million for pneumo- nia and, overall, there were 270 517 deaths from heart failure, 128 088 deaths from ac ute myoc ardial infarction, and 246 154 deaths from pneumonia within 30 days of discharge. Baseline patient demographics were similar among the 4 study periods; comorbidities are shown in Table 1 for patients alive at discharge. Observed trends in 30-day postdischarge and 45-day postadmission outcomes for target conditions are shown in Figure 2 and eTables 1 and 2 in the Supplement.
  • 26. HRRP and 30-Day Postdischarge Mortality Among patients with heart failure, IPW-adjusted postdis- charge mortality (Figure 3A and eTable 3 in the Supplement) increased before the announcement or implementation of the HRRP (0.27% increase from period 1 to period 2; Table 2). Relative to this baseline trend, the announcement of the HRRP was significantly associated with an increase in postdischarge mortality (0.49% increase from period 2 to period 3; 0.22% difference between the change from period 1 to period 2 and period 2 to period 3; P = .01). An analysis stratified by whether there was an associated readmission showed that this change was entirely driven by a significant increase in mortality without readmission (0.27% increase from period 1 to period 2 vs 0.53% increase from period 2 to period 3; 0.26% difference between the change from period 1 to period 2 and period 2 to period 3; P < .001). In addition, HRRP implementation was significantly associated with an increase in postdischarge mortality overall relative to base- line trends (0.52% increase from period 3 to period 4; 0.25% difference between the change from period 1 to period 2 and period 3 to period 4; P = .001), which was also explained by an increase in death without readmission. In contrast, among patients with acute myocardial infarc- tion (Figure 3B), HRRP announcement was significantly asso- ciated with a decline in postdischarge mortality (Table 2; 0.18% increase from period 1 to period 2 vs 0.08% decrease from period 2 to period 3; −0.26% difference between the change from period 1 to period 2 and period 2 to period 3; P = .01). Compared with baseline trends, HRRP implementa- tion was not associated with a significant change in mortality (0.15% increase from period 3 to period 4; −0.03% difference between the change from period 1 to period 2 and period 3 to period 4; P = .69).
  • 27. Postdischarge mortality among patients with pneumonia (Figure 3C) was relatively stable before the HRRP (0.04% increase from period 1 to period 2), but increased signifi- cantly after announcement of the HRRP (Table 2; 0.26% increase from period 2 to period 3; 0.22% difference between the change from period 1 to period 2 and period 2 to period 3; P = .01). This overall change was driven by an increase in patients who were not readmitted but died within 30 days of discharge (0.09% increase from period 1 to period 2 vs 0.32% increase from period 2 to period 3; 0.23% difference between the change from period 1 to period 2 and period 2 to period 3; P = .003). In addition, compared with baseline trends, HRRP implementation was also significantly associated with an increase in mortality overall (0.44% increase from period 3 to period 4; 0.40% difference between the change from period 1 to period 2 and period 3 to period 4; P < .001) and among stratified mortality outcomes of death and no readmission (0.09% from period 1 to period 2 vs 0.38% from period 3 to period 4; 0.30% difference between the change from period 1 to period 2 and period 3 to period 4; P < .001) and readmis- sion and death (0.05% decrease from period 1 to period 2 vs 0.05% increase from period 3 to period 4; 0.11% difference between the change from period 1 to period 2 and period 3 to period 4; P = .003). All P values less than .05 for the 18 comparisons involv- ing 3 end points (total mortality, mortality without readmis- sion, and mortality with readmission), 2 differences in change (post-HRRP announcement trends and post-HRRP implemen- tation trends compared with pre-HRRP trends) and 3 condi- tions (heart failure, acute myocardial infarction, and pneu- monia) were also significant at the FDR level of 0.05 (Table 2). Other 30-Day Postdischarge Outcomes Inverse probability-weighted readmissions without death within 30 days declined significantly following the announce-
  • 28. ment and implementation of the HRRP compared with the years preceding the HRRP for all 3 target conditions (Table 2). Trends across study periods in rates of patients who were not readmitted and were alive within 30 days of discharge are also shown in Table 2 and eTable 3 in the Supplement. HRRP and 45-Day Postadmission Mortality Trends in IPW-adjusted postadmission mortality rates are shown in Figure 4 and eTable 4 in the Supplement. Among pa- tients hospitalized for heart failure, postadmission mortality Association of the Hospital Readmissions Reduction Program With Heart Failure, AMI, and Pneumonia Mortality Original Investigation Research jama.com (Reprinted) JAMA December 25, 2018 Volume 320, Number 24 2545 © 2018 American Medical Association. All rights reserved. https://jama.jamanetwork.com/article.aspx?doi=10.1001/jama.2 018.19232&utm_campaign=articlePDF%26utm_medium=article PDFlink%26utm_source=articlePDF%26utm_content=jama.2018 .19232 https://jama.jamanetwork.com/article.aspx?doi=10.1001/jama.2 018.19232&utm_campaign=articlePDF%26utm_medium=article PDFlink%26utm_source=articlePDF%26utm_content=jama.2018 .19232 https://jama.jamanetwork.com/article.aspx?doi=10.1001/jama.2 018.19232&utm_campaign=articlePDF%26utm_medium=article PDFlink%26utm_source=articlePDF%26utm_content=jama.2018 .19232 https://jama.jamanetwork.com/article.aspx?doi=10.1001/jama.2 018.19232&utm_campaign=articlePDF%26utm_medium=article PDFlink%26utm_source=articlePDF%26utm_content=jama.2018 .19232
  • 29. https://jama.jamanetwork.com/article.aspx?doi=10.1001/jama.2 018.19232&utm_campaign=articlePDF%26utm_medium=article PDFlink%26utm_source=articlePDF%26utm_content=jama.2018 .19232 http://www.jama.com/?utm_campaign=articlePDF%26utm_medi um=articlePDFlink%26utm_source=articlePDF%26utm_content =jama.2018.19232 rates steadily increased before the announcement of the HRRP (Table 2; 0.15% increase from period 1 to period 2). Compared with this baseline trend, the HRRP announcement was sig- nificantly associated with an increase in mortality (0.42% in- crease from period 2 to period 3; 0.27% difference between the change from period 1 to period 2 and period 2 to period 3; P = .01). However, mortality did not significantly change af- ter HRRP implementation (0.32% increase from period 3 to pe- riod 4; 0.17% difference between the change from period 1 to period 2 and period 3 to period 4; P = .06). Postadmission mortality declined among patients hospi- talized for acute myocardial infarction before the announce- ment of the HRRP (0.24% decline from period 1 to period 2), a trend that did not significantly change after the HRRP an- nouncement (0.35% decline from period 2 to period 3; −0.12% difference between the change from period 1 to period 2 and period 2 to period 3; P = .39). Following the HRRP implemen- tation, postadmission mortality continued to decline (0.44% from period 3 to period 4), but did not significantly differ from baseline trends (−0.21% difference between the change from period 1 to period 2 and period 3 to period 4: P = .06). Among patients hospitalized for pneumonia, postadmis- sion mortality was relatively stable before the HRRP (0.05% increase from period 1 to period 2), and did not significantly
  • 30. change after the HRRP announcement (0.15% decline from pe- riod 2 to period 3; −0.20% difference between the change from period 1 to period 2 and period 2 to period 3; P = .07) and imple- mentation (0.14% increase from period 3 to period 4; 0.09% difference between the change from period 1 to period 2 and period 3 to period 4; P = .30). Table 1. Baseline Characteristics of Patients Discharged After Hospitalization for Heart Failure, Acute Myocardial Infarction, or Pneumoniaa Participants, % Period 1 (April 2005- September 2007) Period 2 (October 2007- March 2010) Period 3 (April 2010- September 2012) Period 4 (October 2012- March 2015) Hospitalizations 2 283 774 2 011 915 1 857 337 1 795 911 Demographics Age, mean (SD), y 79.5 (8.5) 79.7 (8.7) 79.7 (8.9) 79.6 (9.0) Women 54.4 53.7 53.1 52.2
  • 31. Men 45.6 46.3 46.9 47.8 Race/ethnicity White 85.9 85.8 85.4 85.1 Black 9.2 9.2 9.4 9.4 Otherb 4.9 5.0 5.2 5.5 Cardiovascular comorbidities Chronic atherosclerosis 53.0 52.6 52.4 50.0 Diabetes 33.9 34.1 35.3 36.0 Hypertension 60.6 66.3 69.1 67.6 History of acute myocardial infarction 5.1 5.2 5.2 5.1 History of heart failure 27.2 26.4 26.8 26.1 Peripheral vascular disease 8.6 8.7 8.4 7.7 Unstable angina 3.4 2.9 2.7 2.6 Valvular heart disease 22.7 17.6 17.2 17.0 Other comorbidities Anemia 28.5 30.2 32.3 32.0 COPD 39.6 34.8 34.5 33.8 Cancer 9.5 9.8 9.9 9.7
  • 32. Cerebrovascular disease 5.1 5.0 4.9 4.5 Dementia 13.7 14.2 12.9 6.8 Depression 8.4 8.1 8.5 8.2 Functional disability 2.9 3.2 3.4 3.3 Liver disease 1.0 1.0 1.1 1.3 Malnutrition 4.6 6.5 7.7 8.2 Psychiatric disorder 2.8 3.2 3.3 3.2 Kidney failure 14.0 18.2 21.2 21.9 Respiratory failure 6.6 8.7 10.2 11.5 Substance abuse 6.9 6.6 7.0 7.3 Trauma 7.5 7.4 7.2 6.6 Length of stay, mean (SD), d 5.6 (4.9) 5.5 (4.8) 5.2 (4.5) 5.1 (4.4) Abbreviation: COPD, chronic obstructive pulmonary disease. a Data are reported as percentages unless otherwise noted. HRRP announcement was in April 2010 and implementation was in October 2012. b Race/ethnicity denoted as Asian,
  • 33. Hispanic, North American Native, other, or unknown. Research Original Investigation Association of the Hospital Readmissions Reduction Program With Heart Failure, AMI, and Pneumonia Mortality 2546 JAMA December 25, 2018 Volume 320, Number 24 (Reprinted) jama.com © 2018 American Medical Association. All rights reserved. http://www.jama.com/?utm_campaign=articlePDF%26utm_medi um=articlePDFlink%26utm_source=articlePDF%26utm_content =jama.2018.19232 Additional Analyses As a sensitivity analysis, we excluded patients receiving hos- pice care and observed patterns in postdischarge mortality that paralleled our primary analysis (eTable 5 in the Supplement). After excluding patients receiving hospice care, postdis- charge mortality among patients hospitalized for heart fail- ure and pneumonia were declining before the announce- ment and implementation of the HRRP, but significantly increased after the announcement and implementation due to an increase in mortality without readmission (eTable 6 in the Supplement). Trends in hospice deaths within 30 days of discharge by condition are shown in eTables 7 and 8 in the Supplement. Trends in postdischarge mortality also re- mained similar when the analysis was restricted to the first hos- pitalization for each patient in each period (eTables 9 and 10 in the Supplement) or included all hospitalizations for each pa- tient (eTables 11 and 12 in the Supplement). In addition, find- ings were consistent using the outcome regression-based ap-
  • 34. proach (eTables 13 and 14 in the Supplement). Discussion Overall, the announcement and implementation of the HRRP was associated with a significant increase in mortality within 30 days of discharge among Medicare beneficiaries hospi- talized for heart failure and pneumonia, but not for acute myocardial infarction. Although 30-day postdischarge mor- tality for heart failure was increasing before the HRRP, this increase accelerated after the announcement and implemen- tation of the program. In addition, postdischarge … EVIDENCE- BASED CARE SHEET Author Hillary Mennella, DNP, ANCC-BC Cinahl Information Systems, Glendale, CA Reviewers Darlene Strayer, RN, MBA Cinahl Information Systems, Glendale, CA Jocelyn Cajanap-Gantman, RN, MSN, FNP, CNS Sepsis Coordinator, Glendale Adventist Medical Center Nursing Executive Practice Council Glendale Adventist Medical Center,
  • 35. Glendale, CA Editor Diane Pravikoff, RN, PhD, FAAN Cinahl Information Systems, Glendale, CA June 22, 2018 Published by Cinahl Information Systems, a division of EBSCO Information Services. Copyright©2018, Cinahl Information Systems. All rights reserved. No part of this may be reproduced or utilized in any form or by any means, electronic or mechanical, including photocopying, recording, or by any information storage and retrieval system, without permission in writing from the publisher. Cinahl Information Systems accepts no liability for advice or information given herein or errors/omissions in the text. It is merely intended as a general informational overview of the subject for the healthcare professional. Cinahl Information Systems, 1509 Wilson Terrace, Glendale, CA 91206 Hospital Readmissions: United States Centers for Medicare and Medicaid Services (CMS) What We Know › Hospital readmission is an expensive and often avoidable patient care outcome(4,9,12) › In 2013, an estimated 18% of Medicare patients were readmitted to the hospital within 30 days of discharge. Annual Medicare costs related to readmissions are estimated at
  • 36. $26 billion, with potentially preventable readmissions accounting for approximately $17 billion of that cost(1) › All healthcare providers are responsible for identifying patient discharge needs and developing a thorough discharge plan to reduce the risk for hospital readmissions(3) › In accordance with the legislative passing of the Affordable Care Act (ACA), the United States Centers for Medicare and Medicaid Services (CMS) established the Hospital Readmissions Reduction Program (HRRP) to decrease the frequency of hospital readmissions of Medicare beneficiaries. Effective October 1, 2012, the provisions of the HRRP permit the CMS to reduce payments to hospitals under the inpatient prospective payment system (IPPS) for readmission rates that are reviewed by CMS and determined to be excessive. The HRRP adjusts hospital reimbursement based on the data for excessive readmissions following patient admissions for acute myocardial infarction (AMI), congestive heart failure (CHF), pneumonia (PN), coronary artery bypass graft (CABG), chronic obstructive lung disease (COPD), stroke, and complications related to readmissions for total hip/knee replacements (THR/TKR)(4,9,12) • Under the HRRP, readmission is defined by the CMS as “an admission to a subsection hospital within 30 days of a discharge from the same or another subsection hospital”(4)
  • 37. – The hospital readmission rate is calculated from the date of discharge, plus 30 days. For example, for a patient who is discharged on October 1, the last day for the postdischarge follow-up period is October 31 – The CMS recognizes 30 days as an industry standard that is strongly influenced by the quality of care – Hospital readmissions exclude those involving a patient’s death in the hospital, enrollment in the Medicare fee-for-service program, hospital admission after at least 30 days post-hospital discharge, and planned hospital readmission (i.e., a nonacute readmission for a scheduled procedure) – CMS does not consider preventability when calculating readmission rates(11) - A standard for identifying and defining what is considered to be a preventable readmission does not exist(11) – Hospital readmission rates are assigned a “yes/no” readmission status regardless of the number of readmissions for a patient during the 30-day postdischarge time period › Each year during the period 2003–2004, according to billing claims from the CMS, an estimated 2.3 million Medicare beneficiaries were readmitted to the hospital within 30 days of discharge. Investigators in a study of 11,855,702
  • 38. Medicare beneficiaries reported that(8) • 19.6% were discharged from the hospital and rehospitalized within 30 days – Of this group, 50.25% did not have a bill for a follow-upvisit to a physician’s office between the time of discharge to the community and rehospitalization • 34% were discharged from the hospital and rehospitalized within 30 days – An estimated 10% were planned hospital readmissions • 67.1% of Medicare beneficiaries with medical conditions who were discharged from the hospital were rehospitalized or died within the first year after discharge • 51.5% of Medicare beneficiaries who were discharged from the hospital after surgical procedures were rehospitalized or died within the first year after discharge – Of this group, 70.5% were rehospitalized with a medical condition › The CMS began reporting the 30-day mortality rates for the quality outcome measures for AMI and CHF in 2007 and for PN in 2008. These quality outcome measures are publicly reported in an effort by CMS to increase transparency and accountability of hospitals for patient care services and treatment(2,12) • The CMS recommends that hospitals review their 30-day mortality outcome measures in conjunction with their 30-day
  • 39. hospital readmission data in order to modify the quality and type of care provided to reduce hospital readmissions › The financial penalties for the HRRP were calculated by the CMS using data from July 2008 through June 2011 for the readmission rates for all hospitalizations for AMI, PN, and CHF; these rates were adjusted for age, gender, patient frailty, and coexisting medical conditions and compared with the actual readmission rates over the same period of time using a methodology that is endorsed by the National Quality Forum (NQF)(4,9,12) • A hospital’s calculated readmission rate for MI, PN, CHF, COPD, CABG, stroke, and THR/TKR is the performance measure of that hospital’s readmission rate compared with the national average for a hospital’s set of patients with the same applicable conditions • For the fiscal year 2013, hospital readmission rates were calculated from data on discharges from July 1, 2008, through June 30, 2011 • In the fiscal year 2014, an estimated 80% of hospitals were penalized, at a cost of $428 million(1) • Kaiser Health News (KHN) reported 4 out of 5 hospitals were penalized for readmissions based on patient discharge data analyzed between July 2013 and June 2016(13) – The average penalty between October 1, 2017 and September 30, 2018 is expected to be 0.73% for each payment Medicare makes per patient(13) › The CMS levied financial penalties of up to 1% of hospital reimbursement rates for readmission of Medicare beneficiaries. The financial penalties increased to 2% in 2014 and to a
  • 40. maximum of 3% in 2015(9) › The CMS 30-day hospital readmission measures are federally mandated to be publicly available under the Hospital Inpatient Quality Reporting Program(12) › The CMS provides hospitals with Hospital-Specific Reports (HSRs) under the Hospital Inpatient Quality Reporting (IQR) program to promote hospital quality improvement efforts. The HSRs provide detailed information on a hospital’s readmission rates, discharge data, and specific risk factor data(4,12) › Investigators analyzing the publicly available data from July 2008 through June 2011 for 3,282 hospitals found that large hospitals, teaching hospitals, and safety-net hospitals (i.e., a hospital system that provides care to a large number of uninsured or low-income patients) had higher readmission rates compared with small hospitals and non-teaching hospitals. Of this sample, 2,189 hospitals, or 66.7% of hospitals, will receive financial penalties as a result of the HRRP. Investigators call for additional research to determine why large hospitals, teaching hospitals, and safety-net hospitals have higher readmission rates than small and non-teaching hospitals(10) › Researchers evaluating the impact of community factors on hospital readmission rates noted that a large portion of readmission rates is affected by the characteristics of the local healthcare community (e.g., quality of nursing homes, access to primary care), specifically the county where the hospital is located. This suggests that penalizing hospitals with high readmission rates might not be equitable and that interventions aimed at community-based readmission reduction strategies might result in improved outcomes(6)
  • 41. › As new data emerge on hospital readmission rates, the CMS should consider the impact on underserved medical communities and make necessary adjustments to the policies regarding hospital readmission. Debate exists about financially penalizing hospitals for excessive readmission rates. Experts argue that the CMS rules are inherently discriminatory toward hospitals that serve low-income groups and/or severely ill patients. Experts argue the following issues:(9,12) • At the inception of the HRRP, the CMS did not adjust for socioeconomic status (SES) or severity of comorbid illness in the calculation of the hospital readmission measures – The CMS argued that adjustment for SES implies that it is acceptable for low-income patient groups to receive less than standard quality of care – Experts contend that the CMS should adjust for SES to place all hospitals at the same level – Researchers have suggested weighting HRRP penalties according to the timing of readmissions. For example, hospital readmission within the first few days after discharge can indicate poor discharge planning compared with hospital readmission 3 weeks after discharge, which is more likely to indicate the severity of the patient’s underlying illness and/ or comorbid diseases. This suggestion offers hospitals the opportunity to make improvements to their discharge planning process while caring for severely ill and low-income groups of patients • Events leading to hospital readmissions might be out of the hospital’s control. Hospitals serving a larger population of
  • 42. patients from a lower SES often have higher rates for readmission compared to the national average resulting in lower Medicare reimbursements. Patients from a lower SES can have difficulty procuring follow-up appointments, food, and medications after discharge(5) – Patients that are eligible for Medicare and Medicaid are defined as “dual-eligibles.” They tend to be medically complex patients with high levels of healthcare utilization. As a result of the 21st Century Cures Act of 2016 the CMS proposed changes for calculating financial penalties under the HRRP beginning fiscal year 2019 among hospitals with high readmission rates of patients from low SES backgrounds. The new calculations are risk-adjustment strategies that include comparisons of social economic risk factors among hospitals(7,14) • The HRRP was criticized by experts that the program had the potential to exacerbate disparities in patient care and generate disincentives to provide care for patients with severe illness and/or complex comorbidities What We Can Do › Become knowledgeable about hospital readmissions so you can adhere to the CMS quality outcome measures and the HRRP; share this information with your colleagues › Review publicly available hospital readmission rates to compare your organization against national benchmarks; for more information, see http://www.qualitynet.org › Collaborate with colleagues in your facility to • review your HSR to promote hospital quality improvement efforts
  • 43. • develop an individualized discharge plan for your patients • provide high-quality healthcare to your patients to promote positive patient outcomes and reduce the risk for hospital readmissions Coding Matrix References are rated using the following codes, listed in order of strength: M Published meta-analysis SR Published systematic or integrative literature review RCT Published research (randomized controlled trial) R Published research (not randomized controlled trial) C Case histories, case studies G Published guidelines RV Published review of the literature RU Published research utilization report QI Published quality improvement report L Legislation PGR Published government report PFR Published funded report PP Policies, procedures, protocols
  • 44. X Practice exemplars, stories, opinions GI General or background information/texts/reports U Unpublished research, reviews, poster presentations or other such materials CP Conference proceedings, abstracts, presentation References 1. Boozary, A. S., Manchin, J., III, & Wicker, R. F. (2015). The Medicare Hospital Readmissions Reduction Program: Time for reform. JAMA: Journal of the American Medical Association, 314(4), 347-348. doi:10.1001/jama.2015.6507 (R) 2. Centers for Medicare and Medicaid Services. (2017). Outcomes measures. Retrieved June 15, 2018, from https://www.cms.gov/medicare/quality-initiatives-patient- assessment- instruments/hospitalqualityinits/outcomemeasures.html (G) 3. Centers for Medicare and Medicaid Services. (2013). Revision to State Operations Manual (SOM), Hospital Appendix A - Interpretive Guidelines for 42 CFR 482.43, Discharge Planning. Retrieved June 15, 2018, from https://www.cms.gov/Medicare/Provider-Enrollment-and- Certification/SurveyCertificationGenInfo/Policy-and-Memos-to- States-and-Regions-Items/Survey-and-Cert-Letter-13-32.html (G) 4. Centers for Medicare and Medicaid Services. (2018, April 27). Readmissions reduction program. Retrieved June 15, 2018, from http://www.cms.gov/Medicare/Medicare-Fee-for-Service- Payment/AcuteInpatientPPS/Readmissions-Reduction-
  • 45. Program.html (G) 5. Changes to readmissions rule will help, but no panacea. (2017). Case Management Advisor, 28(9), 14-15. (X) 6. Herrin, J., St. Andre, J., Kenward, K., Joshi, M. S., Audet, A. J., & Hines, S. C. (2015). Community factors and hospital readmission rates. Health Services Research, 50(1), 20-39. doi:10.111/1475-6773.12177 (R) 7. Hospitals can now factor socioeconomic status into readmissions. (2017). Hospital Case Management, 25(3), 41-42. (GI) 8. Jencks, S. F., Williams, M. V., & Coleman, E. A. (2009). Rehospitalizations among patients in the Medicare fee-for- service program. New England Journal of Medicine, 360(14), 1418-1428. doi:10.1056/NEJMsa0803563 (R) 9. Joynt, K. E., & Jha, A. K. (2013). A path forward on Medicare readmissions. New England Journal of Medicine, 368(13), 1175-1177. doi:10.1056/NEJMp1300122 (GI) 10. Joynt, K. E., & Jha, A. K. (2013). Characteristics of hospitals receiving penalties under the Hospital Readmissions Reduction Program. JAMA, 309(4), 342-343. doi:10.1001/ jama.2012.94856 (R) 11. Lavenberg, J. G., Leas, B., Unscheid, C. A., Williams, K., Goldman, D. R., & Kripalani, S. (2014). Assessing preventability in the quest to reduce hospital readmissions. Journal of Hospital Medicine, 9(9), 598-603. doi:10.1002/jhm.2226 (R)
  • 46. 12. QualityNet. (n.d.). Readmission measures overview. Retrieved June 15, 2018, from http://www.qualitynet.org/dcs/ContentServer?c=Page&pagenam e=QnetPublic%2FPage %2FQnetTier2&cid=1219069855273 (G) 13. Rau, J. (2017). Medicare readmission penalties for hospitals continue under Trump. Retrieved June 15, 2018, from http://www.healthcarefinancenews.com/news/medicare- readmission-penalties-hospitals-continue-under-trump (GI) 14. Whitman, E. (2017). Dual-eligibles could offer relief for hospital readmissions penalties. Modern Healthcare, 47(17), 0010. (GI) https://doi.org/10.1177/1077558717744611 Medical Care Research and Review 2019, Vol. 76(5) 643 –660 © The Author(s) 2017 Article reuse guidelines: sagepub.com/journals-permissions DOI: 10.1177/1077558717744611 journals.sagepub.com/home/mcr Empirical Research Hospital Readmissions Reduction Program: Intended and Unintended
  • 47. Effects Min Chen1 and David C. Grabowski2 Abstract This study examines whether the Hospital Readmissions Reduction Program (HRRP), which penalizes hospitals with excess readmissions for certain conditions, has reduced hospital readmissions and led to unintended consequences. Our analyses of Florida hospital administrative data between 2008 and 2014 find that the HRRP resulted in a reduction in the likelihood of readmissions by 1% to 2% for traditional Medicare (TM) beneficiaries with heart failure, pneumonia, or chronic obstructive pulmonary disease. Readmission rates for Medicare Advantage (MA) beneficiaries and privately insured patients with heart attack and heart failure decreased even more than TM patients with the same target condition (e.g., for heart attack, the likelihood for TM beneficiaries to be remitted is 2.2% higher than MA beneficiaries and 2.3% higher than privately insured patients). We do not find any evidence of cost-shifting, delayed readmission, or selection on discharge disposition or patient income. However, the HRRP reduced the likelihood of Hispanic patients with target conditions being admitted by 2% to 4%. Keywords Medicare, readmissions, hospital, discharge
  • 48. This article, submitted to Medical Care Research and Review on 30 June 2017, was revised and accepted for publication on November 6, 2017. 1Florida International University, Miami, FL, USA 2Harvard Medical School, Boston, MA, USA Corresponding Author: Min Chen, College of Business, Florida International University, 11200 SW 8th Street, Miami, FL 33199, USA. Email: [email protected] 744611MCRXXX10.1177/1077558717744611Medical Care Research and ReviewChen and Grabowski research-article2017 https://us.sagepub.com/en-us/journals-permissions https://journals.sagepub.com/home/mcr mailto:[email protected] http://crossmark.crossref.org/dialog/?doi=10.1177%2F10775587 17744611&domain=pdf&date_stamp=2017-12-03 644 Medical Care Research and Review 76(5) Introduction Hospital readmissions are common and costly. In 2011, the U.S. Medicare program paid for 1.8 million 30-day readmissions with a total cost of $24 billion (Hines, Barrett, Marguerit, Jiang, Joanna, & Steiner, 2014). Some readmissions could be prevented with better quality of care (Axon & Williams, 2011), and the Medicare Payment
  • 49. Advisory Commission (MedPAC) estimates that a 10% reduction in avoidable read- missions would save the Medicare program at least $1 billion (MedPAC, 2013). To achieve both better outcomes for patients and greater savings for Medicare, the Affordable Care Act (ACA) created the Hospital Readmissions Reduction Program (HRRP), which applies financial penalties to acute care hospitals with higher-than- expected readmission rates among Medicare fee-for-service (FFS) beneficiaries in the 30-days following discharge for certain target conditions. Since October 2012, the HRRP has targeted three conditions: acute myocardial infarction (AMI), congestive heart failure, and pneumonia. Beginning in October 2014, total hip or knee replacement and chronic obstructive pulmonary disease (COPD) were also included in the program. The Centers for Medicare and Medicaid Services (CMS) calculates the average risk-adjusted, 30-day hospital-readmission rates for patients with each targeted condition and penalizes hospitals that perform worse than the national average. For Fiscal Year (FY) 2013, the maximum penalty for a hospital with excess readmissions was 1% of its total Medicare base payment. The penalty went up to 2% of the Medicare base payment for FY 2014, and 3% for FY 2015 forward (CMS, 2016). New Contribution
  • 50. Prior studies have examined the initial three target conditions (i.e., AMI, heart failure, and pneumonia) and suggested that the HRRP has lowered 30- day readmissions among Medicare FFS beneficiaries (Carey & Lin, 2015; Gerhardt et al., 2013; Zuckerman, Sheingold, Orav, Ruhter, & Epstein, 2016). Using Medicare FFS claims data, two recent articles compared the changes in readmission rates by hospital penalty status and confirmed that hospitals with the lowest pre-HRRP performance had the greatest improvement (Desai et al., 2016; Wasfy et al., 2017). How readmissions change among Medicare Advantage beneficiaries and privately insured patients, how- ever, is still somewhat unclear and vitally important. Because the HRRP penalties only apply to traditional Medicare patients, one way that a hospital could recoup lost Medicare reimbursements as a result of excess readmissions would be to readmit more privately insured or Medicare Advantage patients. In this study, we exploit a state- based all-payer dataset (through 2014) to examine the overall impact of the HRRP on readmissions among traditional Medicare, Medicare Advantage, and privately insured patients, respectively. We examine not only the aforementioned three originally tar- geted conditions but also the two new penalty conditions (i.e., COPD and total hip or knee replacement). Furthermore, we explore several other potential consequences of the HRRP across
  • 51. targeted and nontargeted conditions. First, we examine the impact of the HRRP on Chen and Grabowski 645 readmissions post–30 days to detect if the HRRP has simply delayed readmissions. Next, we examine whether the HRRP led to any “cherry picking” of low-risk patients at admission. Finally, we examine whether the HRRP led to increased skilled nursing facility (SNF) or home health agency (HHA) discharges. Conceptual Framework The HRRP is a very direct policy instrument. Hospitals are financially penalized for excess 30-day readmissions for the target conditions. Medicare’s goal in implementing the HRRP was to encourage hospitals to reduce 30-day readmissions through better hospital care. In response to the HRRP, we hypothesize that hospitals will lower read- missions for these target conditions assuming the cost of reducing readmissions is below the amount of the readmission penalty. We also assume that hospitals want to avoid any negative reputation effects associated with being penalized (Winborn, Alencherril, & Pagán, 2014), which might lead them to lower readmissions even if the cost of doing so exceeds the readmission penalty. Because the HRRP is a relatively blunt policy, we expect it to
  • 52. incent hospitals to change their behaviors in both intended and unintended ways. In terms of unintended consequences, strong potential exists for what economists term the multitasking prob- lem in which providers direct their efforts toward those metrics for which they might be penalized while shirking on those metrics for which they are not penalized. Under the HRRP, hospitals would have the incentive to push any readmissions out past day 30 when they are no longer penalized for the readmission. Critics have suggested that hospitals might dodge the HRRP penalties by increasingly placing returning patients within 30 days of discharge on observation status (Himmelstein & Woolhandler, 2015; Noel-Miller & Lind, 2015). Observation stays are billed as outpatient services rather than readmissions to acute care and would not be counted in the HRRP penalty calcu- lation. Between 2006 and 2013, observation stays increased by 96% for Medicare patients (MedPAC, 2015). One recent study, however, did not find a statistically significant increase in observation stays for targeted versus nontargeted conditions (Zuckerman et al., 2016). Another unintended consequence would be to discharge patients with a low risk of readmission to costlier postacute care settings because the hospitals are only at risk for readmissions under the HRRP and not postdischarge spending. Thus, at the margin, hospitals have the incentive to increase discharges to home
  • 53. health and skilled nursing facilities for the HRRP target conditions if such discharges would help hospitals reduce readmission rates. From Medicare’s perspective, spending on these postacute services would likely more than offset any potential savings from decreased 30-day readmissions. Finally, the HRRP’s readmission measures adjust for demographic characteristics associated with higher rates of hospital readmissions (such as age) and severity. However, they do not allow risk adjustment based on patients’ race, ethnicity, or socio- economic status. Because patients with low socioeconomic status are found to have higher readmission rates than the overall population (Hu, Gonsahn, & Nerenz, 2014), 646 Medical Care Research and Review 76(5) hospitals may respond to the omission of these risk factors by selecting patients on race and socioeconomic status associated with lower rates of hospital readmissions. Method Data and Outcome Variables We construct our hospital admissions and readmissions measures using the State Inpatient Discharge data, collected and maintained by the
  • 54. Florida Agency for Health Care Administration. The data contain detailed information on all inpatient stays in Florida from Quarter 1 of 2008 to Quarter 4 of 2014 and a unique patient identifier that allows us to track a patient’s historical visits across hospitals over time. In addition, we used Medicare Hospital Compare data released in July 2009 (for the period July 2005– June 2008) to examine baseline risk-adjusted readmission rates at the inpatient pro- spective payment system (IPPS) hospitals in the United States. We adapt methods used in the prior studies to construct index hospitalization and 30-day all-cause readmission at the patient level. Specifically, we code index hospital- izations as stays in which no inpatient discharge had occurred within the previous 30 days. Hence, a hospitalization is either an index stay or a readmission. We then iden- tify target conditions by the principal diagnosis or procedure of the index hospitaliza- tion, using Healthcare Cost and Utilization Project’s (HCUP’s) Clinical Classifications Software (CCS). CCS is a tool that collapses diagnosis and procedure codes from the International Classification of Diseases, 9th Revision, Clinical Modification (ICD-9-CM).1 We used the single level CCS diagnosis code 100 for AMI, 108 for heart failure, 122 for pneumonia, and 127 for COPD. The CCS procedure code used for total hip and knee replacement is 152-153. The ICD-9 codes used to identify total hip and knee replacement are 81.51 (primary hip replacement)
  • 55. and 81.54 (primary knee replacement). In addition, we follow the prior literature (Carey & Lin, 2015; Mellor, Daly, & Smith, 2016) and select gastrointestinal conditions with Medicare Severity Diagnosis Related Group (MS-DRG) codes 329-331, 377-379, and 391-392 to be our control group of Medicare index hospitalizations.2 Similarly, we define two additional indicator variables when readmission occurred within 45 days or 60 days, respectively, and compared them to the 30-day readmission to identify if readmission occurred within 31 to 45 days or 31 to 60 days. Finally, we use the disposition of the patient at discharge to code dummy variables indicating whether the patient was discharged to an SNF or HHA. Control Variables To control for heterogeneity associated with changes in readmission and other out- comes over time, our models include a rich set of patient-level covariates. The covari- ates include demographics such as sex, age group, race, primary payer, income category, and rural/urban location. We also constructed time- varying clinical measures for severity adjustment, including (1) indicators of high severity with major Chen and Grabowski 647
  • 56. complications/comorbidities based on the MS-DRG codes and (2) the number of comorbid conditions compiled from a set of 29 binary variables identifying coexisting medical conditions that are not directly related to the main reason for index admission (refer to HCUP’s Elixhauser Comorbidity Software for details).3 We identify and exclude certain index hospitalizations following the rules specified in the technical reports of constructing 30-day all cause readmission rates prepared for CMS: (1) hospitalizations during which patients died, (2) discharged against medical advice, and (3) discharged or transferred to another acute care facility. For AMI admis- sions, we also excluded cases with same-day discharges. The analysis sample contains 951,215 index admissions from 156 hospitals. Statistical Analysis We use a difference-in-differences (DD) method to compare changes in outcomes of patients in the treatment group before and after the HRRP relative to changes in out- comes of the control group. The treatment group consists of Medicare FFS beneficia- ries aged at least 65 years old and with one of the five HRRP target conditions as the primary diagnosis for their index admission. For each condition we use three different comparison groups for a total of 15 models. The first comparison group consists of hospital admissions among Medicare FFS patients aged 65 years
  • 57. and older and with gastrointestinal conditions as their primary diagnosis. The second comparison group includes hospitalizations of each of the five target conditions among Medicare Advantage patients aged 65 years and older. The third comparison group comprises privately insured patients with those five target conditions. We estimate the following model: Y Post Treatment Post Treatment X Hospi iht t i t i it = + + + + ∗ +α µ µ µ β 1 2 3 � ttalh iht+ε (1) where Yiht is an indicator for a study outcome for patient i at hospital h in time period t. More specifically, we first examine if the patient was readmitted within 30 days of discharge and if there is any delayed readmission after 30 days but within 45 or 60
  • 58. days of discharge. We also examine if the patient was discharged to a costlier postacute care setting (i.e., a SNF or a HHA). Finally, we examine whether the HRRP reduced the likelihood of admitting minority patients or lower income patients. Minority patients are indicated by whether the patient is Black or of Hispanic ethnicity. We iden- tify a patient to be in a lower income region if the patient resides in a ZIP code wherein the estimated annual median household income is in the bottom two quartiles. Each of these outcome measures represents a separate regression. Postt is a dummy variable set to 1 if the observation is from the posttreatment period in either the treatment or a comparison group. We use 2008-2009 as the pre- HRRP period and 2012-2014 as the post-HRRP period for AMI, heart failure, and pneumonia. For the two newly added conditions (i.e., COPD and total hip or knee replacement), we use 2014 as the post-HRRP period. Treatmenti indicates whether the 648 Medical Care Research and Review 76(5) index admission was a hospitalization targeted by the HRRP, and equals zero if the index admission was part of a comparison group. The interaction effect of Postt * Targeti represents our key variable of interest, the DD estimate of the impact of the HRRP. Xit is a vector that captures the time-varying patient
  • 59. characteristics (listed in Table 1). The hospital fixed effects (Hospitalh) are used to control for the unobserved, time-invariant differences across hospitals. Thus, we use pre-HRRP levels for the target admissions and concurrent changes from the precontract to postcontract period in the nontarget admissions to establish counterfactuals that would be expected in the absence of HRRP program, and we esti- mate changes that differed from this expectation (i.e., the differential change or the change attributable to the HRRP). For all the regression analyses, the standard errors are clustered at the level of the hospital to allow for an arbitrary covariance matrix within the clusters. Because penalties are based on whether a hospital’s readmission rate exceeds the national average, hospitals with a baseline readmission rate above the threshold are at greater risk of the penalty and thus have stronger incentives to improve. In July 2009, the CMS Hospital Compare website began to publicly report IPPS hospitals’ perfor- mance in 30-day readmission rates for AMI, heart failure, and pneumonia, respectively. For each IPPS hospital with more than 25 cases, its performance is classified into three categories: “better than U.S. national rate,” “no different than U.S. National Rate,” or “worse than U.S. national rate.” We use the national rate for the period July 2005 to June 2008 obtained from CMS’s Hospital Compare data as the
  • 60. baseline threshold rate and compare the hospital specific average 30-day readmission rates to the national average to define if a hospital is “at risk” for any penalty.4 Given that penalties are based on a hospital’s past 3-year average readmission performance, partial responses might be observed immediately after ACA passage but before penalties go into effect. Using historic readmission rates prior to ACA passage allows us to test the full effects of the HRRP. To examine how the impact of HRRP varies across hospitals with differ- ent risks of facing the penalty, we divide the sample into two groups based on whether patients were admitted into a hospital with its baseline readmission rate above the threshold rate, and then we re-estimate the DD model on both of the subsamples. We further compare this DD estimate of patients treated at hospitals at risk for HRRP penalties versus those patients treated at hospitals not at risk for penalties. More formally, we estimate the triple difference model (DDD) specified below: Y Post Target Risk Post Target Post Risk iht t i h t i t h = + + +
  • 61. + ∗ ∗ ∗ ∗ α µ µθ 1 2 µµ γ γ γ β 3 1 2 3 Target Risk Post Target Risk X Year i h t i h it t iht ∗ + + + + + +ε (2) Compared with Equation (1), the added variable Riskh is an indicator variable that specifies whether a hospital is at risk for HRRP penalties, which equals to 1 if hospital h’s baseline readmission rate is above the national average and 0 otherwise. The inter- action effect of Postt * Targeti * Riskh represents our key variable of interest, the triple difference estimate of the impact of the HRRP.
  • 126. d de vi at io ns a re in b ra ck et s. 650 Medical Care Research and Review 76(5) As noted above, the DDD approach implicitly assumes that hospitals at-risk and not at-risk for the HRRP share the same readmission shocks in a given hospital and year that are unrelated to the HRRP policy. The DD approach, which instead used as controls the within-hospital readmission shocks among patients not included in the HRRP program, may actually be preferable. Because little basis exists for distin-
  • 127. guishing these approaches ex ante, these models are probably best viewed as com- plementary approaches for exploring the validity of this study’s key results. We conduct additional analyses to explore potential sources of bias. We compare trends in each outcome between the targeted and nontargeted admissions during the pre-HRRP period. Similar pre-HRRP trends would support our assumption that changes from the pre-HRRP to post-HRRP periods would have been similar for the target and nontarget conditions in the absence of the HRRP program. Considering that CMS began publicly reporting hospital performance in July 2009 and hospitals might start to respond by changing their behavior since then, we restrict the pre-HRRP period to be the first two quarters of 2009 and reestimated all the specifications using the alternative sample and the results stay robust. Results We observe several notable trends when examining the 30-day all cause readmis- sions by condition from 2008 to 2014 (see Figure 1). First, the 30-day readmission rates of FFS patients followed similar trends from 2008 to 2009 across the five target conditions and gastrointestinal condition. Second, the 30-day readmission rates of FFS patients with each of the five target conditions decreased or stayed relatively stable from 2012 to 2014, while the FFS patients with
  • 128. gastrointestinal conditions Figure 1. Thirty-day all-cause readmission trend by condition. Note. HF = heart failure; PN = pneumonia; HIP = total hip or knee replacement; GI = gastrointestinal conditions. Chen and Grabowski 651 experienced an increase in their 30-day readmission rate during the same time period. Finally, within the same condition, the 30-day readmission rates of FFS and Medicare Advantage patients followed similar trends from 2008 to 2009. We there- fore use 2008-2009 as the pre-HRRP comparison period. When comparing across payers for a given target condition, we also observe that Medicare readmissions rates were consistently higher than the rates for privately insured patients. Table 1 reports the descriptive statistics of the whole sample and by each of the five target conditions as well as the gastrointestinal condition. Compared with the national average, our sample has slightly higher 30-day all-cause readmission rates in AMI and heart failure and comparable readmission rates in pneumonia, COPD, and total hip or knee replacement. We next examine the DD estimates on HRRP targeted admissions using three dif- ferent comparison groups (see Table 2). Compared with
  • 129. Medicare FFS patients with gastrointestinal conditions as the primary diagnosis, there was a 1% to 2% decrease in 30-day readmissions for comparable heart failure, pneumonia, and COPD patients. However, when compared with Medicare Advantage patients with the same target condition, we observe a statistically significant increase in 30- day Medicare FFS read- mission for AMI, heart failure, and pneumonia. Similarly, when compared with privately insured patients, 30-day readmissions for Medicare FFS patients admitted with AMI and heart failure increased. The results reveal that although the HRRP tar- geted Medicare FFS patients only, hospital readmission rates declined substantially in the MA and privately insured population after the HRRP, especially among cardiac related admissions. This may suggest that there are spillover effects from the HRRP extending to MA and privately insured patients. We then restrict our attention to MA and privately insured patients admitted with one of the five HRRP target conditions and compare changes in their readmissions to those of MA and privately insured Table 2. Difference-in-Differences (DID) Estimates of the Effect of the Hospital Readmissions Reduction Program on Medicare FFS 30-Day Readmissions. Medicare FFS patients with GI conditions as
  • 130. control Medicare FFS with Medicare Advantage, same condition as control Medicare FFS with private insurance, same condition as control DID impact DID impact DID impact (1) (2) (3) (1) Heart attack −0.004 (0.005) 0.022*** (0.008) 0.023*** (0.007) (2) Heart failure −0.007** (0.004) 0.012** (0.005) 0.020*** (0.008) (3) Pneumonia −0.006* (0.003) 0.010* (0.006) 0.007 (0.005) (4) Chronic obstructive pulmonary disease −0.018** (0.005) 0.005 (0.007) −0.006 (0.008) (5) Total hip or knee angioplasty 0.013 (0.008) 0.01 (0.011) 0.002 (0.007) Note. FFS = fee-for-service; GI = gastrointestinal. All models include control variables listed in Table 1 as well as hospital fixed effects. The standard errors are clustered at hospital level. Robust standard errors in parentheses. *p < .1. **p < .05. ***p < .01.
  • 131. 652 Medical Care Research and Review 76(5) patients with gastrointestinal conditions, respectively. The DD estimates reported in Appendix Table A1 confirmed that after passage of the HRRP, hospitals reduced car- diac-related readmissions not only for Medicare FFS patients, but also for MA and privately insured patients. Next, we reran the DD estimation conditional on hospitals’ baseline readmission performance (see Table 3). Compared with admissions with gastrointestinal condi- tions, index hospitalizations with target conditions at a hospital “at risk” for penalties had statistically significant lower …