SlideShare a Scribd company logo
1 of 37
The Review of Economics and Statistics VOL. XCIII MAY 2011 NUMBER 2
INSIDE THE WAR ON POVERTY: THE IMPACT OF FOOD STAMPS
ON BIRTH OUTCOMES
Douglas Almond, Hilary W. Hoynes, and Diane Whitmore Schanzenbach*
Abstract—This paper evaluates the health impacts of a signature initiative of the War on
Poverty: the introduction of the modern Food Stamp Pro- gram (FSP). Using variation in the
month FSP began operating in each U.S. county, we find that pregnancies exposed to FSP three
months prior to birth yielded deliveries with increased birth weight, with the largest gains at the
lowest birth weights. We also find small but statistically insig- nificant improvements in neonatal
mortality. We conclude that the sizable increase in income from FSP improved birth outcomes
for both whites and African Americans, with larger impacts for African American mothers.
I. Introduction
IN this paper, we evaluate the health consequences of a sizable improvement in the resources
available to Ameri-
ca’s poorest. In particular, we examine the impact of the Food Stamp Program (FSP), which
in 2007 provided $34 billion in payments to about 13 million households, on infant health. Our
paper makes two distinct contributions. First, although the goal of the FSP is to increase the
nutri- tion of the poor, few papers have examined its impact on health outcomes. Second,
building on work by Hoynes and Schanzenbach (2009), we argue that the FSP treatment
represents an exogenous increase in income for the poor. Our analysis therefore represents a
causal estimate of the impact of income on health, an important topic with little convincing
evidence due to concerns about endogeneity and reverse causality (Currie, 2009).
We use the natural experiment afforded by the nation- wide rollout of the modern FSP during the
1960s and early 1970s. Our identification strategy uses the sharp timing of the county-by-county
rollout of the FSP, which was initially constrained by congressional funding authorizations (and
ultimately became available in all counties by 1975). Speci- fically, we use information on the
month the FSP began operating in each of the roughly 3,100 U.S. counties and examine the
impact of the FSP rollout on mean birth weight, low birth weight, gestation, and neonatal
mortality.
Throughout the history of the FSP, the program para- meters have been set by the U.S.
Department of Agriculture (USDA) and are uniform across states. In the absence of the state-
level variation often leveraged by economists to eval- uate transfer programs, previous FSP
research has typically resorted to strong assumptions as to the comparability of FSP participants
and eligible nonparticipants (Currie, 2003). Not surprisingly, the literature is far from settled as
to what casual impact (if any) the FSP has on nutrition and health.
Hoynes and Schanzenbach (2009) use this county rollout to examine the impact of the FSP on
food consumption using the PSID. They found that the introduction of the FSP increased total
food spending and decreased out-of-pocket food spending. Importantly, consistent with the
predictions of canonical microeconomic theory, the magnitude of the increase in food
expenditures was similar to an equivalent- sized income transfer, implying that most recipient
house- holds were inframarginal (that is, they would spend more on the subsidized good than the
face value of the in-kind transfer). As one of the largest antipoverty programs in the United
States—comparable in cost to the earned income tax credit (EITC) and substantially larger than
Temporary Assistance to Needy Families (TANF)—understanding FSP effects is valuable both
in its own right and for what it reveals about the relationship between income and health.1
We focus on birth outcomes for several reasons. First, families represent an important subgroup
of the food stamp caseload. Over 60% of food stamp households include chil-
Received for publication February 4, 2009. Revision accepted for publi- cation December 9,
2009.
* Almond: Columbia University and NBER; Hoynes: University of California, Davis and
NBER; Schanzenbach: Northwestern University and NBER.
We thank Justin McCrary for providing the Chay-Greenstone-McCrary geography crosswalk and
Karen Norberg for advice on cause-of-death codes. This work was supported by a USDA Food
Assistance Research Grant (awarded by the Joint Center for Poverty Research at Northwestern
University and University of Chicago), the Population Research Center at the University of
Chicago, and USDA FANRP Project 235, ‘‘Impact of Food Stamps and WIC on Health and
Long Run Economic Outcomes.’’ We also thank Ken Chay, Janet Currie, Ted Joyce,
Bob LaLonde, Doug Miller, Bob Whitaker, and seminar participants at the Harris School, Dart-
mouth, MIT, LSE, the California Center of Population Research (UCLA), Duke, Cornell, UC
Irvine, IIES (Stockholm University), the NBER Sum- mer Institute, and the SF Fed Summer
Institute for helpful comments. Alan Barreca, Rachel Henry Currans-Sheehan, Elizabeth
Munnich, Ankur Patel, and Charles Stoecker provided excellent research assistance, and Usha
Patel entered the regionally aggregated vital statistics data for 1960 through 1975.
The online appendix referred to throughout the article is available at
http://www.mitpressjournals.org/doi/suppl/10.1162/REST_a_00089.
1 The cost of the FSP was $33 billion in 2006 (compared to $24 billion for TANF, $33 billion
for the EITC, and $5.4 billion for WIC, the Special Supplemental Nutrition Program for Women,
Infants and Children).
The Review of Economics and Statistics, May 2011, 93(2): 387–403
� 2011 by the President and Fellows of Harvard College and the Massachusetts Institute of
Technology
dren, and one-third have at least one preschool-age child. Second, birth outcomes improved
substantially during the late 1960s and early 1970s. Third, to the extent that the FSP improved
birth outcomes, later-life health outcomes of these cohorts may have also benefited (Barker,
1992; Black, Devereux, & Salvanes, 2007). Finally, the vital statistics data used in this project
are ideally suited for analyzing FSP rollout: the birth (death) microdata contain the county of
birth (death) and the month of birth (death). This, com- bined with the large sample sizes (for
example, more than 1 million birth records per year in the data set), allows us to use the discrete
nature of the FSP rollout with significant statistical power.
We find that infant outcomes improve with FSP introduc- tion. Changes in mean birth weight are
small, increasing roughly half a percent for blacks and whites who partici- pated in the program
(effect of the treatment on the treated). Impacts were larger at the bottom of the birth weight
distri- bution, reducing the incidence of low birth weight among the treated by 7% for whites and
between 5% and 11% for blacks. Changes in this part of the birth weight distribution are
important because they are closely linked to other new- born health measures. Although not all
treatment effects are statistically significant, they point consistently to improve- ments in birth
weight following the introduction of the FSP. We also find that the FSP introduction leads to a
reduction in neonatal mortality, although these results rarely reach statistical significance. We
find very small (but precisely estimated) impacts of the FSP on fertility, suggesting that the
results are not biased by endogenous sample selection. All results are robust to various sets of
controls, such as county fixed effects, state-by-year fixed effects, and county- specific linear
trends. Moreover, FSP impact estimates are robust to and little changed by county-by-year
controls for federal spending on other social programs, suggesting our basic identification
strategy is clean. Finally, we present an event study analysis that further supports the validity of
the identification strategy.
Food stamps are the fundamental safety net in the United States. Unlike other means-tested
programs, there is no additional targeting to specific subpopulations. Current benefits average
about $200 per recipient household per month. Our analysis constitutes the first evidence that
despite the fact that if did not target pregnant mothers (or even women), introduction of the FSP
improved newborn health.
II. Introduction of the Food Stamp Program
The modern FSP began with President Kennedy’s 1961 announcement of a pilot food stamp
program that was to be established in 8 impoverished counties. The pilot programs were
expanded to 43 counties in 1962 and 1963. The suc- cess with these pilot programs led to the
Food Stamp Act of 1964 (FSA), which gave local areas the authority to start up the FSP in their
county. As with the current FSP, the pro-
gram was federally funded, and benefits were redeemable at approved retail food stores. In the
period following the pas- sage of the FSA, a steady stream of counties initiated such programs,
and federal spending on the FSP more than doubled between 1967 and 1969 (from $115 million
to $250 million). Support for requiring counties to participate in FSP grew due to a national
spotlight on hunger (Berry, 1984). This interest culminated in passage of 1973 amend- ments to
the Food Stamp Act, which mandated that all counties offer FSP by 1975.
Figure 1 plots the percentage of counties with an FSP from 1960 to 1975.2 During the pilot
phase (1961–1964), FSP coverage increased slowly. Beginning in 1964, pro- gram growth
accelerated, and coverage expanded at a steady pace until all counties were covered in 1974.
Furthermore, there was substantial heterogeneity in the tim- ing of adoption of the FSP, both
within and across states. The map in figure 2 shades counties according to the date of FSP
adoption (darker shading denotes a later start-up date). Our basic identification strategy considers
the month of FSP adoption for each county the FSP ‘‘treatment.’’3
For our identification strategy to yield causal estimates of the program, it is key to establish that
the timing of FSP adoption appears to be exogenous. Prior to the FSP, some counties provided
food aid through the Commodity Distri- bution Program (CDP), which took surplus food
purchased by the federal government as part of an agricultural price support policy and
distributed those goods to the poor. The 1964 Food Stamp Act allowed counties to voluntarily set
up an FSP, but the act also stated that no county could run both the FSP and the CDP. Thus, for
counties that pre- viously ran a CDP, adoption of the FSP implies termination of the CDP.4 The
political accounts of the time suggest that debates about adopting the FSP pitted powerful
agricultural interests (which favored the CDP) against advocates for the poor (who favored the
FSP; see MacDonald, 1977; Berry, 1984).5 In particular, counties with strong support for farm-
2 Counties are weighted by their 1970 population. Note this is not the food stamp caseload, but
represents the percentage of the U.S. population that lived in a county with an FSP.
3 This timing lines up exceptionally well with county-level FSP spend- ing as measured in the
Regional Economic Information System data. See online appendix table 3.
4 This transition in nutritional assistance would tend to bias FSP impact estimates downward, but
we do not think this bias is substantial because of the limited scope of the CDP. The CDP was
not available in all coun- ties, and recipients often had to travel long distances to pick up the
items. Further, the commodities were distributed infrequently and inconsistently, and provided a
narrow set of commodities. The most frequently available were flour, cornmeal, rice, dried milk,
peanut butter, and rolled wheat (Citizens’ Board of Inquiry 1968). In contrast, food stamp
benefits can be used to purchase all food items (except hot foods for immediate consump- tion,
alcoholic beverages, and vitamins).
5 In fact, as Berry (1984) and Ripley (1969) noted, passage of the 1964 Food Stamp Act was
achieved through classic legislative logrolling. The farm interest coalition (southern Democrats,
Republicans) wanted to pass an important cotton-wheat subsidy bill while advocates for the poor
(northern Democrats) wanted to pass the FSA. Neither had majorities, yet they made an
arrangement, supported each others’ bills, and both bills passed.
388 THE REVIEW OF ECONOMICS AND STATISTICS
ing interests (such as southern or rural counties) may be late adopters of the FSP. Counties with
strong support for the low-income population (such as northern, urban counties
with large populations of poor) may adopt FSP earlier in the period. This systematic variation in
food stamp adoption could lead to spurious estimates of the program impact if
FIGURE 2.—FOOD STAMP PROGRAM START DATE BY COUNTY (1961–1975)
Authors’ tabulations of food stamp administrative data (U.S. Department of Agriculture,
various years). The shading corresponds to the county FSP start date, where darker shading
indicates later county imple- mentation.
FIGURE 1.—WEIGHTED PERCENTAGE OF COUNTIES WITH A FOOD STAMP
PROGRAM, 1960–1975
Authors’ tabulations of food stamp administrative data (U.S. Department of Agriculture,
various years). Counties are weighted by their 1960 population.
389INSIDE THE WAR ON POVERTY
those same county characteristics are associated with differ- ential trends in the outcome
variables.
In earlier work (Hoynes & Schanzenbach, 2009), we documented that larger counties with a
greater fraction of the population that was urban, black, or low income indeed implemented the
FSP earlier, consistent with the historical accounts. We sought to predict FSP adoption date with
1960 county characteristics—those recorded immediately prior to the pilot FSP phase. That
analysis showed that larger coun- ties and those with a higher share of black, elderly, young, or
low income implemented earlier and those where more of the land was used in farming
implement later.6 Neverthe- less, the county characteristics explain very little of the var- iation in
adoption dates (see online appendix figure 1). This is consistent with the characterization of
funding limits con- trolling the movement of counties off the waiting list to start up their FSP:
‘‘The program was quite in demand, as con- gressmen wanted to reap the good will and
publicity that accompanied the opening of a new project. At this time there was always a long
waiting list of counties that wanted to join the program. Only funding controlled the growth of
the pro- gram as it expanded’’ (Berry, 1984, pp. 36–37).
We view the weakness of this model fit as a strength when it comes to our identification
approachin that much of the variation in the implementation of FSP appears to be idiosyncratic.
Nonetheless, in order to control for possible differences in trends across counties that are
spuriously cor- related with the county treatment effect, all of our regres- sions include
interactions of these 1960 pretreatment county characteristics with time trends as in Acemoglu,
Autor, and Lyle (2004) and Hoynes and Schanzenbach (2009).
FSP introduction took place during a period of tremen- dous expansion in cash and noncash
transfer programs as the War on Poverty and Great Society programs were expanding. To
disentangle the FSP from these other pro- grams, the county-by-month variation in FSP rollout is
key. Further, given that virtually all means-tested programs are administered at the state level,
our controls for state-by-year fixed effects should absorb these program impacts. To be sure,
however, our models include controls for per capita real county government (non–food stamp)
transfers.7
III. Background Literature
The goal of the FSP is to improve nutrition among the low-income population. As such, many
studies have exam- ined the impact of the FSP on nutritional availability and intake, food
consumption, food expenditures, and food inse-
curity (see Currie, 2003, and Fraker, 1990, for reviews of the literature).
Almost all existing studies of the impact of the FSP use research designs that rely on
comparisons of program parti- cipants to nonparticipants at the individual level. This approach is
subject to the usual criticisms regarding selec- tion into the program. For example, a number of
researchers (Currie, 2003; Currie & Moretti, 2008; Fraker, 1990) have pointed out that if food
stamp recipients are healthier, are more motivated, or have better access to health care than other
eligible women, then comparisons between partici- pants and nonparticipants could produce
positive program estimates even if the true effect is 0. Conversely, if food stamp participants are
more disadvantaged than other families, such comparisons may understate the program’s
impact. In fact, as Currie (2003) reported, several studies, including Basiotis, Cramer-LeBlanc,
and Kennedy (1998) and Butler and Raymond (1996), find that food stamp parti- cipation leads
to a reduction in nutritional intake. These unexpected results are almost certainly driven by
negative selection in participation.
Many researchers who evaluate the impact of other gov- ernment programs avoid these selection
problems by com- paring outcomes across individuals living in states with different levels of
benefit generosity or other program parameters. A long literature on the effects of cash assis-
tance programs is based on this type of identification strat- egy (Moffitt, 1992; Blank, 2002).
Unfortunately, the FSP is a federal program for which there is very little geo- graphic variation
(aside from the variation we use in this paper) or variation in eligibility criteria or benefit levels,
so prior researchers have had to employ alternative approaches.
Identification issues aside, it is noteworthy that few FSP studies examine the impact on health
outcomes. We are aware of two studies. Currie and Cole (1991) examine the impact of the FSP
on birth weight using sibling comparisons and instrumental variable methods and find no
significant impacts of the FSP. Our work is closer to that of Currie and Moretti (2008), who use
the county rollout of FSP in Califor- nia to analyze birth outcomes. They find that FSP introduc-
tion was associated with a reduction in birth weight, which was driven particularly by first births
among teens and by changes for Los Angeles County. As discussed below, this negative effect is
possible if the FSP led to fertility changes or increases in the survival of low-birth-weight
fetuses. The timing of FSP assignment in Currie and Moretti (2008) differs from ours in that they
consider FSP availability at the begin- ning of pregnancy and its impact on birth weight, whereas
we focus on availability toward the end of pregnancy.8
The literature (see the review in Currie, 2009) provides few estimates of the causal impact of
income on birth
6 For more detail, see table 1 in Hoynes and Schanzenbach (2009). 7 The Special Supplemental
Food Program for Women, Infants and
Children (WIC), available to low-income pregnant women and children up to age 5 in families,
was introduced in 1974. Given the timing of WIC implementation relative to FSP, there is little
concern that the introduc- tion of WIC biases our estimates of the introduction of FSP, and
results limited to pre-1974 are qualitatively similar.
8 Table 3 shows the sensitivity of our impact estimates to the timing of FSP assignment.
390 THE REVIEW OF ECONOMICS AND STATISTICS
weight. Cramer (1995) finds that mothers with more income have higher-birth-weight babies,
although income is identi- fied cross-sectionally. Kehrer and Wolin (1979) find evi- dence that
the Gary Income Maintenance Experiment may have improved birth weight. However sample
sizes are small (N ¼ 404 births), and although positive effects were found for woman as being
and high risk for low birth weight (young, smokers, short birth interval), perverse effects were
found for woman classified as being of low risk low birth weight. Currie and Cole (1993), using
IV and mother-fixed effects estimators, find that AFDC income leads to improvements in birth
weight. Baker (2008) uses the 1993 expansion in the EITC, which disproportionately benefited
families with two or more children, finding a 7 gram increase in the birth weight of subsequent
children. In general, the literature has been plagued by imprecise esti- mates due to small sample
sizes as well as a lack of well- identified sources of variation in income. As a result, we argue
that our paper provides some of the best evidence to date on the impact of income on birth
outcomes.
IV. Food Stamps and Infant Health
The FSP introduction represents an exogenous and siz- able increase in income for the poor.
Canonical microeco- nomic theory predicts that in-kind transfers like food stamps will have the
same impact on spending as an equiva- lent cash transfer for consumers who are inframarginal.
Hoynes and Schanzenbach (2009) use the same FSP rollout identification approach and data
from the PSID to examine the impacts of food stamps on food expenditures; they find that
recipients of food stamps behave as if the benefits were paid in cash. Therefore, not only can we
think of the FSP introduction as a large income transfer, we can think of it as for the most part
the equivalent of a cash income transfer.
With this framing, an increase in income could lead to changes in infant health through many
channels. We would expect that spending on all normal goods would increase, therefore leading
to increases in food consumption regard- less of whether the benefits are paid in cash or in kind.
We have little information on how particular subcategories of food demand change with FSP
availability: Hoynes and Schanzenbach (2009) are able to measure impacts on total food
expenditures, but cannot provide information on the quantity or quality of food consumed (or
other goods).
The medical literature on the determinants of birth weight provides a useful structure for thinking
about the possible channels for the health effects of the FSP. As Kra- mer (1987a, 1987b)
suggested, birth weight is usefully decomposed into that related to the gestation length (prema-
turity, or GL) and growth conditional on gestation length (intrauterine growth, or IUG). Of the
two, GL is thought to be more difficult to manipulate, though empirically more important than
IUG in affecting birth weight in developed countries (Kramer, 1987a, 1987b). Maternal nutrition
and cigarette smoking are the two most important determinants
of IUG that are potentially modifiable (Kramer, 1987a, 1987b). Finally, there is evidence that
birth weight is gener- ally most responsive to nutritional changes affecting the third trimester of
pregnancy.9 Kramer (1987a) writes, ‘‘It is important to analyze additional health measures
in addition to birth weight: A final reminder concerns the need for future research to keep sight
of the truly important out- comes of infant and child mortality, morbidity, and func- tional
performance. After all, birth weight and gestational age are important only insofar as they affect
these out- comes’’ (p. 510).
We examine impacts on neonatal mortality because it is commonly linked to the health
environment during preg- nancy; it is therefore plausible that FSP transfers may have been a
factor. Estimates from Almond, Chay, and Lee (2005) indicate that a 1 pound increase in birth
weight causes neonatal mortality to fall by 7 deaths per 1,000 births, or 24%. Postneonatal
mortality, by contrast, is viewed as being more determined by postbirth factors.10
This discussion suggests that we would expect FSP to affect birth weight and neonatal mortality
but not necessarily gestational length. One obvious channel for food stamp impacts is through
improvements in nutrition. The introduc- tion of the FSP transfer increases total family resources
and is predicted to increase the quality and quantity of food con- sumed, thereby leading to
improvements in infant health. The increased transfer income could also encourage behaviors
that could harm infant health, such as smoking or drinking.11
Health improvements may work through other channels as well, for instance, reducing stress
(such as financial stress) experienced by the mother, which itself may have a direct impact on
birth weight. We explore these issues by separately testing for FSP impacts on length of
gestation and birth weight and by exploring the sensitivity of our impact estimates to the timing
of FSP assignment by pregnancy trimester.
Overall, we expect that access to the FSP should improve infant health. The same forces that
improve infant health, however, could also lead to a change in the composition of births. In
particular, if improvements in fetal health lead to fewer fetal deaths, there could be a negative
compositional effect on birth weight from the improved survivability of marginal fetuses. This
could bias downward the estimated
9 See the literature review of Rush et al. (1980). For example, the cohort exposed to the Dutch
famine in the third trimester had lower average birth weight than cohorts exposed earlier in
pregnancy (Painter, Rosebooma, & Bleker, 2005).
10 The initial health at birth is generally much better among infants who die in the postneonatal
period than among infants dying in the first month of life. For example, while 72% of all
neonatal deaths had a low birth weight (below 2,500 grams), only 20% of all postneonatal deaths
were low-birth-weight infants (Starfield, 1985). Postneonatal deaths tend to be caused by
negative events after birth, most often by infectious diseases and accidents (Grossman &
Jacobowitz, 1981). Further, postneonatal deaths may be more responsive to hospital access than
neonatal deaths (see Almond, Chay, & Greenstone, 2007).
11 Although recipients cannot purchase cigarettes directly with FSP benefits, the increase in
resources to the household may increase cigarette consumption, which would work to reduce
birth weight.
391INSIDE THE WAR ON POVERTY
effects of the FSP on birth weight and infant mortality.12 In addition, if FSP introduction leads
to increases in fertility for disadvantaged women, this could also lead to negative compositional
effect and a subsequent downward bias on the estimates.13 To evaluate such channels, we test
for impacts of the FSP on total births (finding no effect).
V. Data
The data for our analysis are combined from several sources. The key treatment or policy
variable is the month and year that each county implemented a food stamp pro- gram, which
comes from USDA annual reports on county food stamp caseloads (USDA, various years).
These adminis- trative FSP data are combined with two microdata sets on births and deaths from
the National Center for Health Statis- tics. In some cases, we augment the core microdata with
digi- tized print vital statistics documents to extend analysis to the years preceding the beginning
of the microdata. These data are merged with other county-level data from several sources.
A. Vital Statistics Natality Data
These data are coded from birth certificates and are avail- able beginning in 1968. Depending on
the state-year, these data are either a 100% or 50% sample of births, and there are about 2 million
observations per year. Reported birth outcomes include birth weight, gender, plurality, and (in
some state-years) gestational length. Data on the month and county of birth permit linkage of
natality outcomes to the month the FSP was introduced in a given county. There are also
(limited) demographic variables, including age and race of the mother and (in some states and
years) mother’s educa- tion and marital status. Online appendix table 1 provides information
on the availability of these variables over time.
We use the natality data and collapse the data to county- race-quarter cells covering the years
1968 to 1977. We use quarters (rather than months) to keep the sample size man- ageable. The
results are unchanged if we instead use county- race-month cells. We end the sample in 1977,
two years after all counties have implemented the FSP and before the pro- gram changes enacted
in 1978 led to increases in take-up.
Unfortunately, natality microdata are available only beginning in 1968. By 1968, half of the
population lived in counties with on FSP in place. In the interest of examining the full FSP
rollout, we obtained annual print vital statistics documents and digitized the available data. With
these print documents, we augment the microdata with counts of the total number of births by
county and year (not available by race) for 1959 to 1967 and counts of births by birth weight
ranges by state, race and year (not available by county) for 1959 to 1967.14
B. Vital Statistics Death Data
These data are coded from death certificates and are available beginning in 1959. The data
encompass the uni- verse of death certificates (except in 1972, when they are a 50% sample) and
report the age and race of the decedent, the cause of death, and the month and county of death.
We collapse the data to county-race-quarter cells covering the years 1959 to 1977.
Our mortality measure is the neonatal mortality rate, defined as deaths in the first 28 days of life
per 1,000 live births. We focus on deaths from all causes, as this gives us the most power (further
cutting of the county-quarter-race cells by detailed cause of death leads to many very thin cells)
and is unaffected by changes in the coding of cause of death (conversion from ICD-7 to ICD-8)
in 1968. We have attempted to identify causes of death that could be affected by nutritional
deficiencies and also present results for these and other deaths.15 We consider nutritional causes
both because the FSP was targeted at those in nutritional risk and widespread concerns about
nutritional status among the poor during this period. Online appendix table 2 lists the broad
categories for cause of death.
Our main neonatal results use the natality microdata to form the denominator (live births in the
same county-race- quarter). This limits the sample to the years 1968 to 1977. In an extension, we
use the digitized vital statistics docu- ments and county-year counts of births to construct the
denominator for live births and therefore neonatal death rates (for all races) for 1959 to 1977.16
C. County Population Data
The SEER population data are used to construct esti- mates of the population of women ages 15
to 44 by county- race-year.17 These are used with the natality data to con-
12 The estimates described in table 5 imply an imprecise 1% to 2% increase in the number of
births among the treated. If we assume this increase is accounted for by reductions in early
prenatal (embryonic) mor- tality, only to appear as deaths after birth during infancy, this would
imply nearly a doubling of the infant mortality rate, which stood close to 2% nationally in 1970.
Such an increase is not observed and would obviously overwhelm any reductions in infant
mortality among those who would have survived until birth absent the FSP. That said, our data
clearly do not allow us to distinguish between births that reflect a prevented embryo- nic or fetal
death versus induced conceptions. But the magnitudes involved suggest that postponement of
intrauterine mortality to the first year of life could not have been the norm or the infant mortality
rate would have risen substantially. Thus, if we take the table 5 point estimates at face value
(despite the large standard errors), either mortality was post- poned beyond infancy or the
number of conceptions increased.
13 The existing literature suggests that the elasticity of fertility with respect to additional
transfers from income support programs is very small (Moffitt, 1998).
14 For historical vital statistics documents, see http://www.cdc.gov/
nchs/products/pubs/pubd/vsus/1963/1963.htm.
15 We thank Karen Norberg for helping us identify the cause of death classifications. We are
responsible for any classification errors.
16 We need quarterly births by race-county to match the quarterly deaths in the numerator. We
use the distribution of births by quarter for each county in 1968 and assume that quarterly pattern
holds for all years 1959–1967. In practice the ‘‘seasonality’’ of births across
quarters is mini- mal.
17 See National Cancer Institute, http://seer.cancer.gov/popdata/ download.html.
392 THE REVIEW OF ECONOMICS AND STATISTICS
struct fertility rates, defined as births per 1,000 women ages 15 to 44. Our main results use
fertility rates by county-race- quarter for 1968 to 1977. We also use the digitized annual counts
of births by county to construct fertility rates by county-year (not race, not quarter) for the full
period 1959 to 1977.
D. County Control Variables
The 1960 City and County Data Book, which compiles data from the 1960 Census of Population
and Census of Agriculture, is used to measure economic, demographic, and agricultural variables
for the counties’ pretreatment (before FSP is rolled out) period. In particular, we use the
percentage of the 1960 population that lives in an urban area, is black, is less than 5 years old, is
65 years or over, has income less than $3,000 (in 1959 dollars), the percen- tage of land in the
county that is farmland, and log of the county population. We use the Bureau of Economic
Analy- sis, Regional Economic Information System (REIS) data to construct annual, county real
per capita income, and gov- ernment transfers to individuals, including cash public assistance
benefits (Aid to Families with Dependent Chil- dren AFDC; Supplemental Security Income, SSI;
and Gen- eral Assistance), medical spending (Medicare and military health care), and cash
retirement and disability payments.18
These data are available electronically beginning in 1968. We extended the REIS data to 1959 by
hand-entering data from microfiche for 1959, 1962, and 1965 to 1968.19
VI. Methodology
We estimate the impact of the introduction of the FSP on county-level birth outcomes, infant
mortality, and fertility, separately by race. Specifically, we estimate the following model:
Yct ¼ aþ dFSPct þ bCB60c � tþ cXct
þ gc þ dt þ lst þ ect: ð1Þ
Yct (race suppressed) is a measure of infant health or fer- tility defined in county c at time t. In
all specifications, we include unrestricted fixed effects for county gc and time dt.
We examine the sensitivity to including state-by-year fixed effects lst or county-specific linear
time trends, which are not shown in equation (1).
FSPct is the food stamp treatment variable equal to 1 if the county has a food stamp program in
place. The timing of the treatment dummy depends on the particular outcome variable used. For
the analysis of births, we assign FSP ¼ 1 if there is an FSP in place at the beginning of the
quarter prior to birth to proxy for beginning of the third trimester.20
We assign the treatment at the beginning of the third trime- ster following the evidence that this
period is the most important for determining birth weight. However, we explore the sensitivity to
changing the timing of the FSP treatment. Neonatal deaths are thought to be tied primarily to
prenatal conditions, and we therefore use the same FSP timing (we use the age at death and
measure the FSP as of three months prior to birth, to proxy for the beginning of the third
trimester). We have less guidance for the correct timing for FSP treatment for fertility; we
explore FSP avail- ability between three quarters prior to birth (to proxy for conception) and
seven quarters prior to birth.
The vector Xct contains the annual county-level controls from the REIS, including real per capita
transfers and the log of real annual county per capita income. CB60c are the 1960 county
characteristics, which we interact with a linear time trend to control for differential trends in
health out- comes that might be correlated with the timing of FSP adoption.
We consider several outcome variables in our main spe- cifications. First, using the natality data,
we measure infant health at birth as continuous mean birth weight in grams and fraction low
birth weight (less than 2,500 grams, or about 5.5 pounds). These measures are means within
county-race-quarter. Second, using the mortality data, we examine impacts on neonatal mortality
rates (per 1,000 live births) for all causes and for those likely to be affected by nutritional
deficiencies.
All estimates are weighted using the number of births in the county-race-quarter, and the
standard errors are clus- tered by county. Further, to protect against estimation pro- blems
associated with thinness in the data, for the natality (mortality) analysis, we drop all county-race-
quarter cells where there are fewer than 25 (50) births.21 The results are not sensitive to this
sample selection. We also drop Alaska because of difficulties in matching FSP service areas with
counties.
18 Beginning in 1969, the REIS data permit more detailed categories for tabulating government
transfers (including the ability to capture Medicaid spending). However, because the natality data
begin in 1968 and the mor- tality data begin in 1959, we have adopted these three categories. In
ana- lyses of the data limited to 1969 and after, the results are robust to adding more detailed
categories. The REIS data also measure food stamp transfer payments, but for obvious reasons,
we do not use this as a control in our model. We have, however, used the REIS data as a check
on our USDA- measured county food stamp start dates. REIS-measured per capita spend- ing on
FSP sharply increases precisely at the USDA-measured implemen- tation date. In the year prior
to FSP introduction, 99% of counties report no spending on FSP; in the year of introduction, this
falls to 1.3% and is less than 0.3% in subsequent years (online appendix table 3).
19 We used linear interpolation to fill in the missing years. We thank Gary Kennedy of the
Bureau of Economic Analysis for providing the REIS data microfiche.
20 To be precise, because we collapse the data to the county-quarter, the FSP variable can
sometimes equal something other than a 0 or 1. The natality data are available at the monthly
level, and we use that to assign FSP status as of three months prior to birth (proxy for beginning
of the third trimester). When the data are collapsed to the county-quarter, this policy variable is
averaged among the three months of observations in that cell. Therefore, the policy variable
ranges from 0 to 1, with most values at 0 or 1.
21 Neonatal mortality rates average 12 (19) per 1,000 births for whites (blacks) during our
sample period. We use a higher threshold for the mor- tality analysis because of the low
incidence of infant mortality.
393INSIDE THE WAR ON POVERTY
VII. Results for Natality
Table 1 presents the main results for mean birth weight and the fraction of births that are low
birth weight (LBW) for 1968 to 1977. Results are presented separately for whites and blacks. For
each outcome, we report estimates from four specifications with different controls. Column 1
includes county and time (year � quarter) fixed effects, county per capita income, REIS
county-level per capita transfers, and 1960 county characteristics interacted with linear time. The
remaining columns control for trends in three ways: column 2 with state-specific linear time
trends, column 3 with unrestricted state-by-year fixed effects, and (4) with county- specific linear
time trends. In this and all subsequent tables, the number of observations refers to county-quarter
cells.22
The first four columns in panel A report the impact of hav- ing FSP in place in the third trimester
of pregnancy on mean birth weight for births to white women. These columns indi- cate a small,
statistically significant increase in birth weight for whites caused by exposure to FSP during the
third trime- ster. The results are extremely robust across specifications, including controlling for
county-specific linear time trends. When the estimated coefficient is divided by mean birth
weight, the resulting effect size is a 0.06% to 0.08% increase in birth weight, labeled in this and
subsequent tables as ‘‘% Impact (coef/mean)’’. As shown in panel B, the impact of
FSP exposure on birth weight is 50% to 150% larger for blacks than whites. That, combined with
a smaller average birth weight for blacks, implies an impact between 0.1% and 0.2% on blacks
(about twice the impact on whites).
Only a subset of women who give birth are likely to be affected by FSP. While the coefficients
reported are valid estimates of the population impact of FSP, we also want to know the impact
among FSP recipients (treatment on the treated). To calculate the implied impact on those who
take up the FSP, we divide the parameters by an estimate of the FSP participation rate for this
sample.23 We can inflate the estimated effect by these participation rates for an estimate of
treatment on the treated. The results indicate that the impact of FSP on participants’ birth
weight (labeled ‘‘Estimate, inflated’’) is between 15 and 20 grams for whites and 13
to 42 grams for blacks. The estimate expressed as a percentage of mean birth weight (labeled
‘‘% Impact inflated’’) is between 0.5% and 0.6% for whites and between 0.4% and
1.4% for blacks.
TABLE 1.—IMPACTS OF FOOD STAMP INTRODUCTION ON BIRTH OUTCOMES, BY
RACE
(1) (2) (3) (4) (5) (6) (7) (8)
Birth Weight (in Grams) Fraction below 2,500 Grams
A: Whites Average FSP (0/1) 2.039 2.635 2.089 2.175 �0.0006 �0.0006 �0.0006
�0.0006
(0.947)* (0.896)** (1.039)* (0.975)** (0.0003)* (0.0003)* (0.0003)* (0.0004) % impact
(coef/mean) 0.06% 0.08% 0.06% 0.06% �1.02% �1.02% �0.97% �0.97% Estimate
inflated 15.68 20.27 16.07 16.73 �0.0047 �0.0047 �0.0045 �0.0045 % impact inflated
0.47% 0.61% 0.48% 0.50% �7.82% �7.82% �7.44% �7.44% Observations 97,785
97,785 97,785 97,785 97,785 97,785 97,785 97,785 R2 0.54 0.55 0.55 0.56 0.17 0.17 0.18 0.19
Mean of dependent variable 3,350 3,350 3,350 3,350 0.06 0.06 0.06 0.06
B: Blacks Average FSP (0/1) 3.454 4.120 5.466 1.665 �0.0015 �0.0016 �0.0019
�0.0009
(2.660) (2.317) (2.579)* (2.330) (0.0010) (0.0010) (0.0012) (0.0012) % impact (coef/mean)
0.11% 0.13% 0.18% 0.05% �1.13% �1.22% �1.49% �0.68% Estimate inflated 26.57
31.69 42.05 12.80 �0.0113 �0.0122 �0.0149 �0.0068 % impact inflated 0.86% 1.02%
1.36% 0.41% �8.70% �9.41% �11.48% �5.21% Observations 27,374 27,374 27,374
27,374 27,374 27,374 27,374 27,374 R2 0.32 0.33 0.34 0.35 0.15 0.15 0.17 0.18 mean of
Dependent variable 3,097 3,097 3,097 3,097 0.13 0.13 0.13 0.13 1960 CCDB � linear time X
X X X X X REIS controls X X X X X X X X County per capita real income X X X X X X X X
Year quarter fixed effects X X X X X X X X County fixed effects X X X X X X X X State �
linear time X X State � year fixed effects X X County � linear time X X
Each parameter is from a separate regression of the outcome variable on the food stamp
implementation dummy. The treatment is assigned as of three months prior to birth (proxy for
beginning of the third trime- ster). The estimation sample includes means by race-county-quarter
for years including 1968–1977 where cells with fewer than 25 births are dropped. In addition
to the fixed effects, controls include 1960 county vari- ables (log of population, percentage of
land in farming, percentage of population black, urban, age below 5, age above 65, and with
income less than $3,000), each interacted with a linear time trend, per capita county transfer
income (public assistance, medical care, and retirement and disability benefits), and county real
per capita income. Estimates are weighted using the number of births in the cell and are clustered
on county. Standard errors are in parentheses. Inflated impacts divide the parameter estimate by
an estimate of the food stamp participation rate for the regression sample.
22 Note that with 3,142 counties and 40 quarters of data, the maximum number of observations
would be about 125,000. As described above, we drop cells with fewer than 25 births. This
reduces the sample of blacks much more than whites because blacks are more geographically
concen- trated. Despite dropping many counties, this sample represents 98% of white births and
94% of black births.
23 We do not have information about food stamp participation in the natality data or sufficient
data to impute eligibility (for example, income). Instead, we use the 1980 Current Population
Survey and calculate FSP participation rates for women with a child under 5 years old.
(Participa- tion rates look very similar if we alternatively use the presence of a child below age 1
or 3.) The estimated participation rate for women with young children (under age 5) is 0.13 for
whites and 0.41 for blacks.
394 THE REVIEW OF ECONOMICS AND STATISTICS
The results for birth weight (and the other outcomes described below) are very robust to adding
more controls to the model. We view the specification with state-by-year unrestricted fixed
effects as very encouraging, as we have controlled for a whole host of possibly contemporaneous
changes to labor markets, government programs, and other things that vary at the state-year
level. While not shown here, the county-level variables for government transfers and
pretreatment variables do little to change the results. This provides further evidence that the food
stamp rollout is exogenous, thereby validating the research design. Finally, we also find the
results robust to adding county linear time trends (with some reduction for blacks). On the
downside, the poor explanatory power of our control variables in pre- dicting the timing of FSP
(described in section II) means that the precision of our impact estimates is not noticeably
improved by including these regression controls. For the remainder of the tables, we adopt the
specification with state-by-year fixed effects as our base case specification. Results (not
presented here) are the same if log of birth weight is used as the dependent variable instead.
Columns 5 through 8 repeat the exercise, this time with the fraction low birth weight (less than
2,500 grams) as the depen- dent variable. Exposure to FSP reduces LBW by a statistically
significant 1% for whites (7–8% when inflated by participa- tion rate) and a less precisely
estimated 0.7% to 1.5% for blacks (5% to 12% when inflated by participation rate).
To further investigate the impact of the FSP on the distri- bution of birth weight, we estimated a
series of models relating FSP introduction to the probability that birth weight is below a given
gram threshold: 1,500; 2,000; 2,500; 3,000; 3,250; 3,500; 3,750; 4,000; 4,500 (Duflo 2001). We
use the specification in column 3 with state-by-year fixed effects; the estimates and 95%
confidence intervals are pre- sented in Figure 3 (we plot ‘‘% Impacts [coef/mean]’’
not inflated by program participation). Figure 3A displays the results and confidence intervals for
whites. We find that the largest percentage reduction in probability of birth weight below a
certain threshold comes at very low thresholds of 1,500 and 2,000 grams. The impacts become
gradually smaller as the birth weight threshold is increased to 2,500 grams and above, until there
is no difference for births below 3,750 grams. Results are larger for blacks (figure 3B), showing
a 6% decrease in the probability of a birth less than 1,500 grams, and an impact that declines at
higher birth weights.24
Online appendix table 4 presents estimates for three addi- tional outcome variables: the fraction
of births that are less than 1,500 grams, have gestation length less than 37 weeks (preterm
births), and are female. These results show that FSP leads to a small and statistically insignificant
decrease in preterm births and the fraction of births that are female. While small they are and
statistically insignificant, this is consistent with recent work finding that prenatal nutritional
deprivation tips the sex ratio in favor of girls (Mathews, Johnson, & Neil, 2008).25
One limitation of these results is that microdata on births by county are available only starting in
1968, at which point almost half of the population was already covered by the
24 In order to gauge the magnitude of these effects, it is useful to com- pare the estimated effects
to those implied by the previous literature. Cra- mer (1995) finds that a 1% change in the
income-to-poverty ratio leads to a 1.05 gram increase in mean birth weight. The Hoynes and
Schanzen- bach (2009) estimates of the magnitude of food stamp benefits are $1,900 annually
for participants (in 2005 dollars). Scaling those to match the units available in the literature (and
treating FSP benefits as their face- value cash equivalent) implies that food stamps increased the
family income-to-poverty ratio of participants by 15%. The implied treatment- on-treated effect
would therefore be approximately 16 grams, which is quite similar to the effects found in table 1.
FIGURE 3.—EFFECTS OF FSP IMPLEMENTATION ON DISTRIBUTION OF BIRTH
WEIGHT, PERCENTAGE IMPACTS (COEFFICIENT/MEAN)
The graph shows estimates and 95% confidence intervals for the estimate of the impact of FSP
imple- mentation on the fraction of births in the county-quarter cell that is below each specified
number of grams. The specification is given by column 3 in table 1.
25 In results not shown here, we find that birth-weight models are little changed by controlling
for gestation (known as an IUG model). We also estimated models where the dependent variable
is the fraction of births below a gestation-varying threshold (known as small-for-gestational-age
models; Fenton, 2003). These models yielded results very similar to the LBW regressions.
395INSIDE THE WAR ON POVERTY
FSP. In online appendix table 5 we use data from 1959 to 1977 to examine the impact of the FSP
rollout on low birth weight and very low birth weight. To push the period back to 1959, we are
limited to use of data at the state-race-year level (see the discussion in section V). Controls
include state and year fixed effects, REIS variables, and state-speci- fic linear time trends;
standard errors are clustered on state.26 We first present results for 1968 to 1977, where the data
are identical to those used in table 1 but are collapsed to the state level. The results show
imprecise but qualita- tively similar effects of FSP measured with this noisier treatment variable.
(For example, the county analysis in table 1 shows a �1.0 percent impact on LBW for whites
and �1.5 percent for blacks compared to �0.4 percent for whites and �1.6 percent for
blacks for the state and year data in online appendix table 5). We then show the results for the
full period (1959–1977) and the post-pilot program period (1964–1977). Whenever
estimating models for the full FSP ramp-up period, we look separately at the period from 1964
because the pilot counties were clearly not exo- geneously chosen. Using these earlier (but more
aggre- gated) data, we get qualitatively similar (and statistically indistinguishable) results across
the different time periods, suggesting that missing the pre-1968 period in our main results may
not qualitatively affect our conclusions.
A. Impacts by Likelihood of Treatment
We next explore whether the impacts of the FSP are lar- ger among subsets of the sample that are
more likely to be affected by the FSP. The natality data include education of
the mother and presence of the father, but because of miss- ing data (not all states collected this
information in earlier years), we lose a substantial fraction of the sample (see, online appendix
table 1). Nonetheless, we have estimated models by age of mother, education of mother, and pre-
sence of the father (results not shown). Overall, the results showed that the impacts are larger for
older mothers (age 25 and over). None of the education results are statistically significant. This
analysis did reveal that black mothers with no father present experience much larger impacts
than all black women. This is consistent with the high participation rates among this group (0.70
compared to 0.50 for all blacks).
In lieu of detailed demographic variables, in table 2 we break counties into quartiles based on
1970 poverty rates, where we expect larger impacts in high-poverty counties. The results are
quite striking: the gains are concentrated in the highest-poverty counties. Large, statistically
significant effects are present in the highest-quartile poverty counties, while smaller and
insignificant effects are presents in the lowest-poverty counties. (Due to the relatively large stan-
dard errors, we cannot reject that they are equal.)
There is some suggestion in the historical accounts that the impact might be different across
geographic regions or might differ by race across regions. In particular, participa- tion in the
program in the early years (after the county’s initial adoption of FSP) was probably higher in
urban coun- ties and in the North. Barriers to accessing food stamps might have also differed
between North and South and may have interacted with race (Citizens’ Board, 1968). Table 3
shows that the impact of FSP is larger and more statistically significant for both blacks and
whites in urban counties. Interestingly, blacks appear to have larger effects outside the South,
while whites appear to have larger effects in the South. These differences parallel the regional
trends: Blacks
TABLE 2.—IMPACT OF FOOD STAMP INTRODUCTION ON BIRTH OUTCOMES, BY
QUARTILE OF POVERTY RATES
(1) (2) (3) (4) Low-Poverty Counties (Lowest Quartile) High-Poverty Counties (Highest
Quartile)
Birth Weight Low Birth Weight Birth Weight Low Birth Weight
Average FSP (0/1) 1.871 �0.001 3.409* �0.0012* (2.013) (0.001) (1.750) (0.0006)
% impact (coef/mean) 0.06% �1.23% 0.10% �1.50% Observations 8,339 8,339 56,055
56,055 R2 0.78 0.38 0.56 0.26 Mean of dependent variable 3333 0.07 3303 0.08 Subsample
population 0.23 0.23 0.26 0.26 1960 CCDB � linear time X X X X REIS controls X X X X
County per capita real income X X X X Year � quarter fixed effects X X X X County fixed
effects X X X X State � year fixed effects X X X X
Each parameter is from a separate regression of the outcome variable on the food stamp
implementation dummy. The treatment is assigned as of three months prior to birth. The
estimation sample includes means by county-quarter for years including 1968–1977 where
cells with fewer than 25 births are dropped. Controls include county, year � quarter and state
� year fixed effects, 1960 county variables (log of population, percentage of land in farming,
percentage of population black, urban, under age 5, over age 65 and with income less than
$3,000), each interacted with a linear time trend, per capita county transfer income (public
assistance, medical care, and retirement and disability benefits), and county real per capita
income. Estimates are weighted using the number of births in the cell and are clustered on
county. Standard errors are in par- entheses. Inflated impacts divide the parameter estimate by an
estimate of the food stamp participation rate for the regression sample. Quartiles are assigned
using 1970 county poverty rates (weighted using county population).
26 To construct state-level FSP treatment, we use the 1968 counts of number of births by county-
month and calculate (for each state and year using the program variables) the percentage of
births in the state that were in counties with FSP in place three months prior to birth.
396 THE REVIEW OF ECONOMICS AND STATISTICS
saw larger reductions in low birth weight (and neonatal mortality) in the North, while whites saw
larger declines in the South. The FSP impacts by South/non-South, however, are less precisely
estimated than the results by urban/nonur- ban.27
B. Investigation of the Timing of Impacts
To explore the possible channels for the impacts of the FSP transfer, table 4 reestimates the mean
birth weight models varying the timing of the exposure to the FSP. The baseline
specification—reprinted from column 3 of table 1—assigns the policy introduction as three
months prior to birth, to proxy for beginning of the third trimester. Columns 2 and 3 of table 4
moves assignment of FSP treatment to two and three quarters before birth, respectively. Moving
the treatment from third to second trimester reduces the impact of FSP substantially, though
there is still a statisti- cally significant impact on birth weight for blacks. Further- more,
assigning treatment at three quarters before birth (proxy for conception) yields even smaller and
statistically insignificant impacts. The results in columns 4 and 5 show that conditional on third-
trimester exposure, additional exposure earlier in the pregnancy has no additional benefits.
Similar results are found for fraction low and very low birth weight. Recalling from section IV
that the medical litera- ture suggests that nutrition has its greatest impact on birth weight during
the third trimester, we view these estimates
as suggestive that nutrition is playing an important channel for the FSP transfer’s benefits. In
addition, these results pro- vide evidence that our model is not simply capturing a spur- ious
correlation between FSP introduction and trends in infant outcomes at the county level.28
To further test for spurious trending in the county birth outcomes that might be loading on to
FSP, we include a one-year lead of the policy variable for each of the birth outcome variables in
online appendix table 6. There is no impact of the policy lead, and the results for the main policy
variable are qualitatively unchanged.
As described above, we use the month that the county implemented the FSP to measure food
stamp availability during these pregnancies. If there was a lag in ramping up county food stamp
programs, then our difference-in-differ- ence estimates will underestimate the true (eventual)
pro- gram impacts. The administrative ramp-up was aided by the fact that the new FSP offices
were often set up in the same building as the county welfare office. To directly evaluate the
ramp-up in FSP operations, figure 4 shows food stamp caseloads per capita by year relative to
start year (the case- load data are available only by year). The figure separately plots caseloads
for counties beginning operations in the first half versus second half of the caseload reporting
year. This
TABLE 3.—IMPACTS OF FSP INTRODUCTION ON INFANT OUTCOMES, BY
GEOGRAPHY
(1) (2) (3) (4) (5) (6) (7) (8) South Non-South Urban Counties Nonurban Counties
Birth Weight LBW Birth Weight LBW Birth Weight LBW Birth Weight LBW
A: Whites Avearage FSP (0/1) 2.403 �0.0011 1.771 �0.0003 2.364 �0.0008 0.508
�0.0002
(1.612) (0.0005)** (1.322) (0.0004) (1.247)* (0.0004)** (1.615) (0.0006) % impact (coef/mean)
0.07% �1.57% 0.05% �0.48% 0.07% �1.13% 0.02% �0.25% Observations 44,194
44,194 53,591 53,591 32,282 32,282 65,503 65,503 Subsample population 0.29 0.29 0.69 0.69
0.73 0.73 0.25 0.25
B: Blacks Average FSP (0/1) 3.527 �0.0023 7.003 �0.0009 8.371 �0.0034 �0.745
0.0023
(3.134) (0.0014)* (3.992)* (0.0022) (2.846)** (0.0013)** (5.219) (0.0023) % impact
(coef/mean) 0.11% �1.76% 0.23% �0.69% 0.27% �2.59% �0.02% 1.74% Observations
20,837 20,837 6,537 6,537 13,090 13,090 14,284 14,284 Subsample population 0.49 0.49 0.45
0.45 0.77 0.77 0.17 0.17 1960 CCDB � linear time X X X X X X X X REIS controls X X X X
X X X X County per capita real income X X X X X X X X Year � quarter fixed effects X X X
X X X X X County fixed effects X X X X X X X X State � year fixed effects X X X X X X X
X
Each parameter is from a separate regression of the outcome variable on the food stamp
implementation dummy. The treatment is assigned as of the three months prior to birth. The
estimation sample includes means by county-quarter for years including 1968–1977 where
cells with fewer than 25 births are dropped. Controls include county, year � quarter and state
� year fixed effects, 1960 county variables (log of popula- tion, percentage of land in farming,
percentage of population black, urban, under age 5, over age 65, and with income less than
$3,000), each interacted with a linear time trend, per capita county transfer income (public
assistance, medical care, and retirement and disability benefits), and county real per capita
income. Estimates are weighted using the number of births in the cell and are clustered on
county. Standard errors are in parentheses. Inflated impacts divide the parameter estimate by an
estimate of the food stamp participation rate for the regression sample. Subsample population
reports the percentage of total births that are included in the regression. Urban counties are
defined as those with greater than 50% of the 1960 population living in an urban area.
27 We define the county as urban if more than 50% of the 1960 popula- tion in the county lives
in an urban area.
28 Note that the reduction in the magnitude of the birth-weight impact may explain the
difference between our results and those of Currie and Moretti (2008). Their study of birth
outcomes in California assigned the FSP treatment nine months prior to birth and found
comparatively limited impacts on birth weight. Another explanation for larger effects in the third
trimester is if initial FSP participation is concentrated there (rather than earlier).
397INSIDE THE WAR ON POVERTY
figure suggests that rapid ramp-up was achieved and that the ramp-up is only slightly faster in
the counties with more lead time (implementation earlier in the year). Further, note
that over half of the ‘‘steady-state’’ caseload is achieved in the first year, even for
counties that begin operation late in the reporting year.
TABLE 4.—SENSITIVITY OF BIRTH WEIGHT OUTCOMES TO CHANGING THE
TIMING OF THE POLICY INTRODUCTION
(1) (2) (3) (4) (5)
Main Policy Effect: FSP—Beginning of
Third Trimester FSP—Beginning of Second Trimester
FSP—Beginning of First Trimester
FSP—Beginning of Third Trimester
Second Policy Effect: – – – FSP—Beginning of Second Trimester
FSP—Beginning of First Trimester
A: Whites Average FSP (0/1) 2.085 1.696 1.288 2.556 2.434
(1.020)** (1.024)* (0.993) (1.640) (1.268)* Average FSP (0/1) – – – �0.533 �0.454
Second policy variable (1.650) (1.232) Observations 97,785 97,785 97,785 97,785 97,785 R2
0.55 0.55 0.55 0.55 0.55 Mean of dependent variable 3,350 3,350 3,350 3,350 3,350
B: Blacks Average FSP (0/1) 5.447 4.704 2.071 5.334 8.108
(2.532)** (2.464)* (2.396) (4.596) (3.444)** Average FSP (0/1) – – – 0.130 �3.515
Second policy variable (4.450) (3.268) Observations 27,374 27,374 27,374 27,374 27,374 R2
0.34 0.34 0.34 0.34 0.34 Mean of dependent variable 3,097 3,097 3,097 3,097 3,097 1960 CCDB
� linear time X X X X X REIS controls X X X X X County per capita real income X X X X X
Year � quarter fixed effects X X X X X County fixed effects X X X X X State � year fixed
effects X X X X X
Dependent variable is equal to birth weight in grams. Each parameter is from a separate
regression of the outcome variable on the food stamp implementation dummy. The specifications
vary by changing the tim- ing of food stamp implementation. Base case is in column 1, where the
timing is as of three months prior to the birth (to proxy for beginning of the third trimester). The
alternative specifications include timing as of six months (second trimester) or nine months (first
trimester) prior to birth. In specifications 4, we estimate jointly the treatment effects at the third
and second trimesters, and in column 5, we estimate jointly the impacts measured at the third and
first trimesters. All of the other control variables and sample definitions are described in the
notes to table 1.
FIGURE 4.—PERCENTAGE OF COUNTY POPULATION ON FOOD STAMPS BY
NUMBER OF YEARS SINCE PROGRAM START
The graph is an unweighted regression of county-year food stamp caseloads on a series of
dummy variables tracking year relative to county FSP implementation year. County caseload is
expressed as a share of the 1960 population. Source for caseload data is USDA (various years).
398 THE REVIEW OF ECONOMICS AND STATISTICS
C. Event Study
The pattern of estimates in table 4 suggests that the FSP treatment effect is identified by the
discrete jump in FSP at implementation and its impact on birth weight. In particu- lar, we
showed in table 4 that as the timing of the treatment is shifted earlier in pregnancy, the estimated
FSP effect on birth weight decreased substantially in magnitude. If instead identification were
coming from some other trends in county outcomes that are correlated with FSP start month,
then we would expect less sensitivity in the results to the trimester to which the FSP treatment is
assigned. However, there remains a concern that our results are driven by trends in county birth
outcomes that are correlated with FSP implementation in a way that county linear trends do not
capture.
This proposition can be evaluated more directly in an event study analysis. Specifically, we fit
the following equa- tion,
Yct ¼ aþ X8
i¼�6
pi1ðsct ¼ iÞ þ gc þ dt
þcXct þ /c � tþ ect; ð2Þ
where sct denotes the event quarter, defined so that s ¼ 0 for births that occur in the same
quarter as the FSP began operation in that county, s ¼ 1 for births one quarter after the FSP
began operation, and so on. For s � � 1, pregnan- cies were untreated by a local program
(births were before the program started). The coefficients are measured relative to the omitted
coefficient (s ¼ �2).29 Our event study model includes fixed effects for county and time,
county REIS variables, and county-specific linear time trends.
In order to eliminate potential compositional effects, we restrict the sample to a balanced panel
of counties having births for all fifteen event quarters: six quarters before implementation and
eight quarters after. Because our natal- ity data begin with January 1968, this means we exclude
from the event study analysis all counties with an FSP before July 1969.
Figure 5 plots the event and quarter coefficients from estimating equation (2) on the fraction of
low-birth-weight births. The figure also reports the number of county and quarter observations in
the balanced sample and the differ- ence-in-difference estimate on this sample.30 Panel A reports
estimates for blacks and panel B for whites. These figures show an absence of a strong pretrend
and evidence
of a trend break at the quarter the FSP is introduced, imply- ing an improvement in infant
outcomes. That such a prompt increase in birth weight is observed with FSP inception indicates
that potential confounders would have to mimic the timing of FSP rollout extremely closely. Not
shown here, the event study results are nearly identical if we exclude the county controls,
providing further evidence of the exogeneity of the treatment. We view this as more evi- dence
of the validity of our identification strategy.31
D. Further Robustness Checks
The main results are robust to various additional specifi- cation checks. One potential concern is
that the FSP intro- duction is correlated with unobserved county health invest- ments (such as the
expansion of access to hospitals in the South as in Almond, Chay, and Greenstone 2007) and our
REIS controls fail to pick this up. To test this, we use the natality data to estimate the impact of
FSP implementation on the fraction of births in a hospital or attended by a physi- cian. These
results indicate very small and statistically insignificant improvements with FSP implementation
(online appendix table 7).
Finally, the same forces that improve infant health could also lead to greater survival of low-
birth-weight fetuses. In addition, the FSP may lead to increased fertility among dis- advantaged
women (if children are a normal good). Both factors, through endogeneous sample selection,
could bias the estimates downward. We consider this by evaluating whether FSP introduction is
associated with any change in live births. The dependent variable is the number of births in the
race, county, and quarter divided by the number of women aged 15 to 44, and the regressions are
weighted by the population of women in each cell. Table 5 presents sev- eral estimates, which
vary depending on the timing of the FSP treatment: between three quarters prior to birth (proxy
for conception) and seven quarters prior to birth (one year prior to conception). Across the table,
we find positive but very small and statistically insignificant effects of FSP on births. When
these point estimates are inflated by the FSP participation rate, the estimate of the treatment on
the trea- ted is about 1% for whites and 2% for blacks. When we stratify the results by quartiles
of county poverty rates, we also find small and statistically insignificant impacts among those
living in the highest poverty counties (online appen- dix table 8).
VIII. Mortality Results
Table 6 shows the main results for neonatal mortality rate for 1968 to 1977. We present three
outcomes: death rate for all causes, deaths possibly due to nutritional deficiencies,
29 Because of the discrete nature of the event study model, the s’s are formed by aggregating
months to a quarter. For example, if the FSP started (or birth occurred) in January, February, or
March 1970, then the FSP started (or birth occurred) in 1970 quarter 1. Therefore when s ¼ 0
(birth quarter ¼ policy commencement quarter), the pregnancy could actually have been
treated for between zero and three months.
30 The difference-in-difference estimate is comparable to the results pre- sented in table 1. We
present them here because the samples used for the event study differ from the main results (due
to balancing of the sample).
31 Similar patterns are observed when the dependent variable is average birth weight (online
appendix figure 2) and the share of births below 1,500 grams (available on request).
399INSIDE THE WAR ON POVERTY
and other deaths (for definition see the data section and online appendix table 2). Because
neonatal deaths are thought to be related primarily to prenatal conditions (parti- cularly prior to
major technological advances in neonatal care in the 1970s and 1980s), we time the FSP
treatment as of a quarter prior to birth (to proxy for the beginning of the third trimester). In these
models, we drop any race-county- quarter cell where there are fewer than fifty births. Results are
weighted by the number of births in the cell.
The neonatal mortality rate averages about twelve deaths per 1,000 births for whites and nineteen
for blacks, with about half of the deaths where the cause of death indicates those possibly
affected by nutritional deficiencies. The results for whites and blacks show that the FSP leads to
a reduction in infant mortality, with larger impacts for deaths possibly affected by nutritional
deficiencies. None of the estimates, however, are statistically significant. Overall, the effect of
the treatment on the treated (percentage impact,
FIGURE 5.—EFFECTS OF FSP IMPLEMENTATION ON LOW BIRTH WEIGHT:
RESULTS FOR EVENT STUDY ANALYSIS
Each figure plots coefficients from an event-study analysis. Coefficients are defined as quarters
relative to the quarter the FSP is implemented in the county. The sample is a balanced county
sample, where a county is included only if there are six quarters of pre- and eight quarters of
post-implementation data. The specification includes controls for county, county � linear time,
quarter, 1960 county controls interacted with time, county per capita transfers, and county real
per capita income. The ‘‘diff-in-diff treatment effect’’ is comparable to the results
presented in table 1. We present them here because the samples used for the event study differ
from the main results.
400 THE REVIEW OF ECONOMICS AND STATISTICS
inflated) for all causes is about 4% for whites and between 4% and 8% for blacks. These
estimates are roughly in line with the birth weight–neonatal mortality rate relationship
estimated by Almond et al. (2005): for whites, we estimate
a very similar birth weight-mortality relationship, although the relationship between birth weight
and mortality we esti- mate for blacks is substantially stronger than in Almond et al. (2005).
Finally, we view the results for ‘‘other deaths’’
TABLE 6.—IMPACT OF FSP ON NEONATAL MORTALITY RATE (DEATHS PER 1,000
LIVE BIRTHS)
(1) (2) (3) (4) (5) (6) (7) (8) (9)
All Deaths Deaths Linked to Nutrition Other Deaths
A: Whites Average FSP (0/1) �0.0625 �0.0158 �0.0806 �0.0492 �0.0784 �0.0376
�0.0133 0.0626 �0.0430
(0.1050) (0.1194) (0.1242) (0.0771) (0.0839) (0.0913) (0.0834) (0.0936) (0.0960) % impact
(coef / mean) �0.52% �0.13% �0.67% �0.79% �1.25% �0.60% �0.23% 1.09%
�0.75% % impact, inflated �4.01% �1.01% �5.17% �6.04% �9.63% �4.62%
�1.79% 8.39% �5.76% Observations 73,577 73,577 73,676 73,577 73,577 73,676 73,577
73,577 73,676 R2 0.16 0.16 0.18 0.10 0.11 0.13 0.12 0.12 0.15 Mean of dependent variable
12.00 12.00 12.00 6.26 6.26 6.26 5.74 5.74 5.74
B: Blacks Average FSP (0/1) �0.3898 �0.0067 �0.6551 �0.4128 �0.3098 �0.4233
0.0231 0.3032 �0.2317
(0.4095) (0.4610) (0.4793) (0.2865) (0.2953) (0.3334) (0.2729) (0.3348) (0.2977) % impact
(coef / mean) �2.06% �0.04% �3.46% �4.58% �3.43% �4.69% 0.23% 3.06%
�2.34% % impact, inflated �4.47% �0.08% �7.52% �9.95% �7.47% �10.20%
0.51% 6.65% �5.08% Observations 17,655 17,655 17,695 17,655 17,655 17,695 17,655
17,655 17,695 R2 0.42 0.44 0.43 0.34 0.36 0.36 0.26 0.29 0.28 Mean of dependent variable
18.94 18.94 18.94 9.02 9.02 9.02 9.91 9.91 9.91 1960 CCDB � linear time X X X X X X REIS
controls X X X X X X X X X County per capita real income X X X X X X X X X Year �
quarter fixed effects X X X X X X X X X County fixed effects X X X X X X X X X State �
linear time X X X State � year fixed effects X X X County � linear time X X X
Each parameter is from a separate regression of the neonatal mortality rate (deaths in first 28
days per 1,000 live births) on the FS implementation. The treatment is assigned as of three
months prior to birth (proxy for beginning of the third trimester). The sample includes means by
race-county-quarter for years including 1968–1977 where cells with fewer than fifty births are
dropped. In addition to the fixed effects, controls include 1960 county variables (log of
population, percentage of land in farming, percentage of population black, urban, below age 5,
over age 65, and with income less than $3,000), each interacted with a linear time trend, per
capita county transfer income (public assistance, medical care, and retirement and disability
benefits), and county real per capita income. Estimates are weighted using the number of births
in the cell and are clustered on county. Standard errors are in parentheses. Inflated impacts divide
the parameter estimate by an estimate of the food stamp participation rate for the regression
sample.
TABLE 5.—IMPACT OF FSP INTRODUCTION ON FERTILITY RATE (BIRTHS PER
1,000 WOMEN AGES 15–44)
(1) (2) (3) (4) (5) FSP Implemented as of X Quarters prior to Birth
3 Quarters 4 Quarters 5 Quarters 6 Quarters 7 Quarters
A: Whites Average FSP (0/1) 0.013 �0.004 0.007 0.031 0.035
(0.078) (0.074) (0.071) (0.074) (0.070) % impact (coef/mean) 0.06% �0.02% 0.04% 0.16%
0.18% % impact, inflated 0.50% �0.14% 0.28% 1.22% 1.40% Observations 120,293 120,293
120,293 120,293 120,293 Mean of dependent variable 19.40 19.40 19.40 19.40 19.40
B: Blacks Average FSP (0/1) 0.211 0.157 0.276 0.307 0.227
(0.221) (0.206) (0.193) (0.190) (0.183) % impact (coef/mean) 0.80% 0.60% 1.05% 1.17% 0.86%
% impact, inflated 1.75% 1.30% 2.29% 2.54% 1.88% Observations 44,044 44,044 44,044
44,044 44,044 Mean of dependent variable 26.24 26.24 26.24 26.24 26.24 1960 CCDB �
linear time X X X X X REIS controls X X X X X County per capita real income X X X X X
Year � quarter fixed effects X X X X X County fixed effects X X X X X State � year fixed
effects X X X X X
Each parameter is from a separate regression of the outcome variable on the food stamp
implementation dummy. The columns vary by the timing of the FSP implementation. The
estimation sample includes means by race-county-quarter for 1968–1977. Controls include
county, year-by-quarter and state-by-year fixed effects, 1960 county variables (log of population,
percentage of land in farming, percentage of population black, urban, under age 5, over age 65,
and income less than $3,000), each interacted with a linear time trend, per capita county transfer
income (public assistance, medical care, and retirement and disability benefits), and county real
per capita income. Estimates are weighted using the population in the cell and are clustered on
county. Standard errors are in parentheses. Inflated impacts divide the parameter estimate by an
estimate of the food stamp participation rate for the regression sample.
401INSIDE THE WAR ON POVERTY
(not affected by nutritional deficiencies), which are opposite signed and much smaller in
magnitude (although again sta- tistically significant), as favorable evidence that the mortal- ity
estimates are coming from the FSP. Online appendix table 9 separates the mortality effects by
quartiles of the county poverty rate, and while imprecisely estimated finds a negative effect in
the highest-poverty counties but a posi- tive one in the lowest-poverty counties that were
unlikely to experience a substantial FSP treatment.
Online appendix table 10 presents results for all races for the full period from 1959. We are
unable to present results by race here because the denominator (live births by county and time) is
not available by race prior to 1968. The first three columns replicate the results in table 6 for
1968 to 1977 for all races. In the subsequent columns (for 1959– 1977 and 1964–1977), we
find results very similar to those for 1968 to 1977. Overall, FSP implementation leads to a
reduction in neonatal mortality, although not statistically significantly so.
IX. Interpretation and Conclusion
The uniformity of the FSP was designed to buffer the dis- cretion states exercised in setting rules
and benefit levels of other antipoverty programs. This uniformity was deliber- ately preserved
through the major reforms to welfare under the 1996 Personal Responsibility and Work
Opportunity Reconciliation Act (Currie, 2003). An unintended conse- quence of this regularity
has been to circumscribe the pol- icy variation that researchers typically use to identify pro- gram
impacts. As a result, surprisingly little is known about FSP effects.
In contrast to other major U.S. antipoverty programs, the FSP was rolled out county by county.
This feature of imple- mentation allows us to separate the introduction of food stamps from the
other major policy changes of the late 1960s and early 1970s. Although FSP benefits were (and
are) paid in vouchers that themselves could be used only to purchase food, because the voucher
typically represented less than households spent on food (covering just the ‘‘thrifty food
plan’’), recipients were inframarginal and ben- efits were essentially a cash transfer
(Hoynes & Schanzen- bach, 2009).
Across the board, our point estimates show that this near- cash transfer improved infant
outcomes. In particular, we find increases in mean birth weight for whites and blacks, with larger
impacts estimated at the bottom of the birth weight distribution (that is, low birth weight and
very low birth weight). Consistent with expectations, we find larger birth weight effects for black
mothers and those living in high-poverty areas—populations where FSP participation is more
common. Consistent with epidemiological studies, FSP availability in the third trimester had the
largest birth weight impact. We conclude that despite not targeting preg- nant women, the
introduction of the FSP increased birth weight. This finding is all the more noteworthy given the
mixed success that randomized interventions have had in raising birth weights (Rush, Stein, &
Susser, 1980; Lumley & Donohue, 2006).
While the point estimates for gestation length and neona- tal mortality would also suggest
improved health at birth, estimated effects are imprecise, despite the large samples from vital
statistics data. One interpretation is that statistical power is lost when analyzing gestation length
(incomplete reporting by states) and mortality (rare). Leaving the impre- cision issue aside,
gestation length and mortality appear less affected than the likelihood of low and very low birth
weight.
At a minimum, our results indicate that the FSP had an immediate first-stage impact on
newborns. Furthermore, these estimated impacts (as reflected by birth weight) are much larger in
high-poverty counties. Our findings reveal that an exogenous increase in income during a well-
defined period, pregnancy, can improve infant health. Future work should consider whether this
FSP-induced birth weight improvement is reflected in subsequent outcomes and how poverty and
birth weight may mediate this relationship.
REFERENCES
Acemoglu, Daron, David Autor, and David Lyle, ‘‘Women, War and Wages: The Impact of
Female Labor Supply on the Wage Struc- ture at Mid-Century,’’ Journal of Political
Economy, 112 (2004), 497–551.
Almond, Douglas, Kenneth Y. Chay, and Michael Greenstone, ‘‘Civil Rights, the War on
Poverty, and Black-White Convergence in Infant Mortality in the Rural South and
Mississippi,’’ MIT Depart- ment of Economics working paper no. 07–04: (2007).
Almond, Douglas, Kenneth Y. Chay, and David S. Lee, ‘‘The Costs of Low Birth
Weight,’’ Quarterly Journal of Economics, 120 (2005), 1031–1084.
Baker, Kevin, ‘‘Do Cash Transfer Programs Improve Infant Health: Evi- dence from the
1993 Expansion of the Earned Income Tax Credit,’’ manuscript, University of Notre
Dame (2008).
Barker, D.J.P., Fetal and Infant Origins of Adult Disease (London: British Medical Journal,
1992).
Bastiotis, P., C. S. Cramer-LeBlanc, and E. T. Kennedy, ‘‘Maintaining Nutritional Security
and Diet Quality: The Role of the Food Stamp Program and WIC,’’ Family Economics
and Nutritional Review, 11 (1998), 4–16.
Berry, Jeffrey M., Feeding Hungry People: Rulemaking in the Food Stamp Program (New
Brunswick, NJ: Rutgers University Press, 1984).
Black, Sandra E., Paul J. Devereux, and Kjell G. Salvanes, ‘‘From the Cradle to the Labor
Market? The Effect of Birth Weight on Adult Outcomes,’’ Quarterly Journal of
Economics 122 (2007), 409– 439.
Blank, Rebecca, ‘‘Evaluating Welfare Reform in the United States,’’ Jour- nal of
Economic Literature 40 (2002), 1105–1166.
Butler, J. S., and J. E. Raymond, ‘‘The Effect of the Food Stamp Program on Nutrient
Intake,’’ Economic Inquiry 34 (1996), 781–798.
Citizens’ Board of Inquiry into Hunger and Malnutrition in the United States, Hunger,
U.S.A. (Boston: Beacon Press, 1968).
Cramer, James, ‘‘Racial and Ethnic Differences in Birth Weight: The Role of Income and
Financial Assistance,’’ Demography 32 (1995), 231–247.
Currie, Janet, ‘‘Food and Nutrition Programs,’’ in Robert Moffitt (Ed.), Means-
Tested Transfer Programs in the U.S. (Cambridge, MA: NBER, 2003).
——— ‘‘Healthy, Wealthy, and Wise: Socioeconomic Status, Poor Health in Childhood,
and Human Capital Development,’’ Journal of Economic Literature 47 (2009),
87–122.
402 THE REVIEW OF ECONOMICS AND STATISTICS
Currie, Janet, and Nancy Cole, ‘‘Does Participation in Transfer Programs during Pregnancy
Improve Birth Weight?’’ NBER working paper no. 3832 (1991).
——— ‘‘Welfare and Child Health: The Link between AFDC Participa- tion and Birth
Weight,’’ American Economic Review 83 (1993), 971–985.
Currie, Janet, Enrico Moretti, ‘‘Did the Introduction of Food Stamps Affect Birth Outcomes
in California?’’ in R. Schoeni, J. House, G. Kaplan, and H. Pollack, (Eds.), Making
Americans Healthier: Social and Economic Policy as Health Policy, (New York: Russell Sage
Press, 2008).
Duflo, Esther, ‘‘Schooling and Labor Market Consequences of School Construction in
Indonesia: Evidence from an Unusual Policy Experiment,’’ American Economic Review
91 (2001), 795–813.
Fenton, Tanis, ‘‘A New Growth Chart for Preterm Babies: Babson and Benda’s Chart
Updated with Recent Data and a New Format,’’ BMC Pediatrics 3:13 (2003),
http://www.biomedcentral.com/1471¼2431/3/13.
Fraker, Thomas, ‘‘Effects of Food Stamps on Food Consumption: A Review of the
Literature’’ (Washington, DC: Mathematica Policy Research, 1990).
Grossman, Michael, and Steven Jacobowitz, ‘‘Variations in Infant Mortal- ity Rates among
Counties of the United States: The Roles of Public Policies and Programs,’’ Demography
18 (1981), 695–713.
Hoynes, Hilary W., and Diane Whitmore Schanzenbach, ‘‘Consumption Responses to In-
Kind Transfers: Evidence from the Introduction of the Food Stamp Program,’’ American
Economic Journal: Applied Economics 1 (2009), 109–139.
Kehrer, Barbara H., and Charles M. Wolin, ‘‘Impact of Income Mainte- nance on Low Birth
Weight: Evidence from the Gary Experi- ment,’’ Journal of Human Resources 14 (1979),
434–462.
Kramer, Michael S., ‘‘Intrauterine Growth and Gestational Determi- nants,’’
Pediatrics 80 (1987a), 502–511.
——— ‘‘Determinants of Low Birth Weight: Methodological Assessment and Meta-
Analysis,’’ Bulletin of the World Health Organization 65 (1987b), 633–737.
Lumley, Judith, and Lisa Donohue, ‘‘Aiming to Increase Birth Weight: A Randomised Trial
of Pre-Pregnancy Information, Advice and Counseling in Inner-Urban Melbourne,’’
BMC Public Health 6:299 (2006), http://www.biomedcentral.com/1471¼2458/6/299.
MacDonald, Maurice, Food, Stamps, and Income Maintenance (Madison, WI: Institute for
Poverty Research, 1977).
Mathews, Fiona, Paul J. Johnson, and Andrew Neil, ‘‘You Are What Your Mother Eats:
Evidence for Maternal Preconception Diet Influen- cing Foetal Sex in Humans,’’
Proceedings of the Royal Society 275 (2008), 1661–1668.
Moffitt, Robert, ‘‘Incentive Effects of the US Welfare System,’’ Journal of
Economic Literature, 30 (1992), 1–61.
——— ‘‘The Effect of Welfare on Marriage and Fertility,’’ in Robert Moffitt
(Ed.), Welfare, the Family, and Reproductive Behavior, (Washington, DC: National Research
Council, 1998).
Painter, Rebecca C., Tessa J. Rosebooma, and Otto P. Bleker, ‘‘Prenatal Exposure to the
Dutch Famine and Disease in Later Life: An Over- view,’’ Reproductive Toxicology 20
(2005), 345–352.
Ripley, Randall B., ‘‘Legislative Bargaining and the Food Stamp Act, 1964,’’ in
Frederick N. Cleaveland, (Ed.), Congress and Urban Problems: A Casebook on the Legislative
Process (Washington, DC: Brooking Institution, 1969).
Rush, David, Zena Stein, and Mervyn Susser, Diet in Pregnancy: A Ran- domized Controlled
Trial of Nutritional Supplements (New York: Alan R. Liss, 1980).
Starfield, Barbara, ‘‘Postneonatal Mortality,’’ Annual Review of Public Health 6
(1985), 21–40.
U.S. Congressional Budget Office, ‘‘The Food Stamp Program: Income or Food
Supplementation?’’ (Washington, DC: U.S. Government Printing Office, 1977).
U.S. Department of Agriculture, ‘‘Food Stamp Program, Year-End Parti- cipation and
Bonus Coupons Issues,’’ technical report, Food and Nutrition Service, (various years).
U.S. Department of Health, Education and Welfare, ‘‘Vital Statistics of the United States,
Volume I’’ (1959–1967).
403INSIDE THE WAR ON POVERTY
Copyright of Review of Economics & Statistics is the property of MIT Press and its content may
not be copied
or emailed to multiple sites or posted to a listserv without the copyright holder's express written
permission.
However, users may print, download, or email articles for individual use.
Copyright © 2018 by Elsevier Inc. All rights reserved.
Pagana: Mosby’s Manual of Diagnostic and Laboratory Tests, 6th Edition
AIDS (Acquired Immunodeficiency Syndrome)
Case Studies
The patient, a 30-year-old homosexual man, complained of unexplained weight loss, chronic
diarrhea, and respiratory congestion during the past 6 months. Physical examination revealed
right-sided pneumonitis. The following studies were performed:
Studies Results
Complete blood cell count (CBC), p. 156
Hemoglobin (Hgb), p. 251 12 g/dL (normal: 14–18 g/dL)
Hematocrit (Hct), p. 248 36% (normal: 42%–52%)
Chest x-ray, p. 956 Right-sided consolidation affecting the posterior
lower lung
Bronchoscopy, p. 526 No tumor seen
Lung biopsy, p. 688 Pneumocystis jiroveci pneumonia (PCP)
Stool culture, p. 797 Cryptosporidium muris
Acquired immunodeficiency syndrome
(AIDS) serology, p. 265
p24 antigen Positive
Enzyme-linked immunosorbent assay
(ELISA)
Positive
Western blot Positive
Lymphocyte immunophenotyping, p. 274
Total CD4 280 (normal: 600–1500 cells/L)
CD4% 18% (normal: 60%–75%)
CD4/CD8 ratio 0.58 (normal: >1.0)
Human immune deficiency virus (HIV)
viral load, p. 265
75,000 copies/mL
Diagnostic Analysis
The detection of Pneumocystis jiroveci pneumonia (PCP) supports the diagnosis of AIDS. PCP
is
an opportunistic infection occurring only in immunocompromised patients and is the most
common infection in persons with AIDS. The patient’s diarrhea was caused by
Cryptosporidium
muris, an enteric pathogen, which occurs frequently with AIDS and can be identified on a stool
culture. The AIDS serology tests made the diagnoses. His viral load is significant, and his
prognosis is poor.
The patient was hospitalized for a short time for treatment of PCP. Several months after he was
discharged, he developed Kaposi sarcoma. He developed psychoneurologic problems eventually
and died 18 months after the AIDS diagnosis.
Case Studies
Copyright © 2018 by Elsevier Inc. All rights reserved.
2
Critical Thinking Questions
1. What is the relationship between levels of CD4 lymphocytes and the likelihood of
clinical complications from AIDS?
2. Why does the United States Public Health Service recommend monitoring CD4
counts every 3–6 months in patients infected with HIV?
3. This is patient seems to be unaware of his diagnosis of HIV/AIDS. How would you
approach to your patient to inform about his diagnosis?
4. Is this a reportable disease in Florida? If yes. What is your responsibility as a
provider?
.
Copyright © 2018 by Elsevier Inc. All rights reserved.
Pagana: Mosby’s Manual of Diagnostic and Laboratory Tests, 6th Edition
Iron-Deficiency Anemia
Case Study
A 72-year-old man developed chest pain whenever he was physically active. The pain ceased on
stopping his activity. He has no history of heart or lung disease. His physical examination was
normal except for notable pallor.
Studies Result
Electrocardiogram (EKG), p. 485 Ischemia noted in anterior leads
Chest x-ray study, p. 956 No active disease
Complete blood count (CBC), p.
156
Red blood cell (RBC) count, p.
396
2.1 million/mm (normal: 4.7–6.1 million/mm)
RBC indices, p. 399
Mean corpuscular volume
(MCV)
72 mm 3 (normal: 80–95 mm
3 )
Mean corpuscular hemoglobin
(MCH)
22 pg (normal: 27–31 pg)
Mean corpuscular hemoglobin
concentration (MCHC)
21 pg (normal: 27–31 pg)
Red blood cell distribution width
(RDW)
9% (normal: 11%–14.5%)
Hemoglobin (Hgb), p. 251 5.4 g/dL (normal: 14–18 g/dL)
Hematocrit (Hct), p. 248 18% (normal: 42%–52%)
White blood cell (WBC) count, p.
466
7800/mm 3 (normal: 4,500–10,000/mcL)
WBC differential count, p. 466 Normal differential
Platelet count (thrombocyte
count), p. 362
Within normal limits (WNL) (normal: 150,000–
400,000/mm 3 )
Half-life of RBC 26–30 days (normal)
Liver/spleen ratio, p. 750 1:1 (normal)
Spleen/pericardium ratio <2:1 (normal)
Reticulocyte count, p. 407 3.0% (normal: 0.5%–2.0%)
Haptoglobin, p. 245 122 mg/dL (normal: 100–150 mg/dL)
Blood typing, p. 114 O+
Iron level studies, p. 287
Iron 42 (normal: 65–175 mcg/dL)
Total iron-binding capacity
(TIBC)
500 (normal: 250–420 mcg/dL)
Transferrin (siderophilin) 200 mg/dL (normal: 215–365 mg/dL)
Transferrin saturation 15% (normal: 20%–50%)
Case Studies
Copyright © 2018 by Elsevier Inc. All rights reserved.
2
Ferritin, p. 211 8 ng/mL (normal: 12–300 ng/mL)
Vitamin B12, p. 460 140 pg/mL (normal: 100–700 pg/mL)
Folic acid, p. 218 12 mg/mL (normal: 5–20 mg/mL or 14–34 mmol/L)
Diagnostic Analysis
The patient was found to be significantly anemic. His angina was related to his anemia. His
normal RBC survival studies and normal haptoglobin eliminated the possibility of hemolysis..
His RBCs were small and hypochromic. His iron studies were compatible with iron deficiency.
His marrow was inadequate for the degree of anemia because his iron level was reduced.
On transfusion of O-positive blood, his angina disappeared. While receiving his third unit of
packed RBCs, he developed an elevated temperature to 38.5°C, muscle aches, and back pain.
The transfusion was stopped, and the following studies were performed:
Studies Results
Hgb, p. 251 7.6 g/dL
Hct, p. 248 24%
Direct Coombs test, p. 157 Positive; agglutination (normal: negative)
Platelet count, p. 362 85,000/mm 3
Platelet antibody, p. 360 Positive (normal: negative)
Haptoglobin, p. 245 78 mg/dL
Diagnostic Analysis
The patient was experiencing a blood transfusion incompatibility reaction. His direct Coombs
test and haptoglobin studies indicated some hemolysis because of the reaction. His platelet count
dropped because of antiplatelet antibodies, probably the same ABO antibodies that caused the
RBC reaction.
He was given iron orally over the next 3 weeks, and his Hgb level improved. A rectal
examination indicated that his stool was positive for occult blood. Colonoscopy indicated a right-
side colon cancer, which was removed 4 weeks after his initial presentation. He tolerated the
surgery well.
Critical Thinking Questions
1. What was the cause of this patient's iron-deficiency anemia?
2. Explain the relationship between anemia and angina.
3. Would your recommend B12 and Folic Acid to this patient? Explain your rationale for
the answer
4. What other questions would you ask to this patient and what would be your rationale for
them?

More Related Content

Similar to The Review of Economics and StatisticsVOL- XCIII MAY 2011 NUMBER 2INSI.docx

Early_Obesity_Prevention_TBF_November_2014
Early_Obesity_Prevention_TBF_November_2014Early_Obesity_Prevention_TBF_November_2014
Early_Obesity_Prevention_TBF_November_2014Allison Bauer
 
Kearney levine-trends-nov2013-new nber
Kearney levine-trends-nov2013-new nberKearney levine-trends-nov2013-new nber
Kearney levine-trends-nov2013-new nberharamaya university
 
Honors_thesis _Taryn_Schubert_2009
Honors_thesis _Taryn_Schubert_2009Honors_thesis _Taryn_Schubert_2009
Honors_thesis _Taryn_Schubert_2009Taryn Schubert
 
A comparative analysis of fertility differentials in cross river state
A comparative analysis of fertility differentials in cross river stateA comparative analysis of fertility differentials in cross river state
A comparative analysis of fertility differentials in cross river stateAlexander Decker
 
A comparative analysis of fertility differentials in cross river state
A comparative analysis of fertility differentials in cross river stateA comparative analysis of fertility differentials in cross river state
A comparative analysis of fertility differentials in cross river stateAlexander Decker
 
Population Cultural Considerations and Genetic Predispositions.docx
Population Cultural Considerations and Genetic Predispositions.docxPopulation Cultural Considerations and Genetic Predispositions.docx
Population Cultural Considerations and Genetic Predispositions.docxstudywriters
 
Childhood Obesity Powerpoint
Childhood Obesity PowerpointChildhood Obesity Powerpoint
Childhood Obesity Powerpointyvonne ritchie
 
Running head MATERNAL, INFANT AND CHILD HEALTH .docx
Running head MATERNAL, INFANT AND CHILD HEALTH                   .docxRunning head MATERNAL, INFANT AND CHILD HEALTH                   .docx
Running head MATERNAL, INFANT AND CHILD HEALTH .docxcowinhelen
 
Understanding the Effect of the GAVI Initiative on Reported Vaccination Cover...
Understanding the Effect of the GAVI Initiative on Reported Vaccination Cover...Understanding the Effect of the GAVI Initiative on Reported Vaccination Cover...
Understanding the Effect of the GAVI Initiative on Reported Vaccination Cover...UWGlobalHealth
 
Running head PICOT STATEMENT 1PICOT STATEMENT 3PICOT .docx
Running head PICOT STATEMENT 1PICOT STATEMENT 3PICOT .docxRunning head PICOT STATEMENT 1PICOT STATEMENT 3PICOT .docx
Running head PICOT STATEMENT 1PICOT STATEMENT 3PICOT .docxtoltonkendal
 
Carter 1 Carter8Shanta CarterRechelle Chr.docx
Carter 1             Carter8Shanta CarterRechelle Chr.docxCarter 1             Carter8Shanta CarterRechelle Chr.docx
Carter 1 Carter8Shanta CarterRechelle Chr.docxannandleola
 
IOSR Journal of Pharmacy (IOSRPHR), www.iosrphr.org, call for paper, research...
IOSR Journal of Pharmacy (IOSRPHR), www.iosrphr.org, call for paper, research...IOSR Journal of Pharmacy (IOSRPHR), www.iosrphr.org, call for paper, research...
IOSR Journal of Pharmacy (IOSRPHR), www.iosrphr.org, call for paper, research...iosrphr_editor
 
HOSPITAL-AT-HOME (HOME CARE) FOR PRENATAL AND POSTNATAL(MATERNAL)C
HOSPITAL-AT-HOME (HOME CARE) FOR PRENATAL AND POSTNATAL(MATERNAL)CHOSPITAL-AT-HOME (HOME CARE) FOR PRENATAL AND POSTNATAL(MATERNAL)C
HOSPITAL-AT-HOME (HOME CARE) FOR PRENATAL AND POSTNATAL(MATERNAL)CLizbethQuinonez813
 
Note Compare and contrast public health funding (and resulting im.docx
Note Compare and contrast public health funding (and resulting im.docxNote Compare and contrast public health funding (and resulting im.docx
Note Compare and contrast public health funding (and resulting im.docxcurwenmichaela
 
End of Module 1 Project 12292014
End of Module 1 Project 12292014End of Module 1 Project 12292014
End of Module 1 Project 12292014Camlus Otieno
 
Improving the Measurement of Poverty
Improving the Measurement of PovertyImproving the Measurement of Poverty
Improving the Measurement of PovertyZiaullah Mirza
 

Similar to The Review of Economics and StatisticsVOL- XCIII MAY 2011 NUMBER 2INSI.docx (20)

Rapid Decline in Childhood Undernutrition in Brazil and the Role of Policies ...
Rapid Decline in Childhood Undernutrition in Brazil and the Role of Policies ...Rapid Decline in Childhood Undernutrition in Brazil and the Role of Policies ...
Rapid Decline in Childhood Undernutrition in Brazil and the Role of Policies ...
 
Early_Obesity_Prevention_TBF_November_2014
Early_Obesity_Prevention_TBF_November_2014Early_Obesity_Prevention_TBF_November_2014
Early_Obesity_Prevention_TBF_November_2014
 
Kearney levine-trends-nov2013-new nber
Kearney levine-trends-nov2013-new nberKearney levine-trends-nov2013-new nber
Kearney levine-trends-nov2013-new nber
 
Honors_thesis _Taryn_Schubert_2009
Honors_thesis _Taryn_Schubert_2009Honors_thesis _Taryn_Schubert_2009
Honors_thesis _Taryn_Schubert_2009
 
A comparative analysis of fertility differentials in cross river state
A comparative analysis of fertility differentials in cross river stateA comparative analysis of fertility differentials in cross river state
A comparative analysis of fertility differentials in cross river state
 
A comparative analysis of fertility differentials in cross river state
A comparative analysis of fertility differentials in cross river stateA comparative analysis of fertility differentials in cross river state
A comparative analysis of fertility differentials in cross river state
 
Population Cultural Considerations and Genetic Predispositions.docx
Population Cultural Considerations and Genetic Predispositions.docxPopulation Cultural Considerations and Genetic Predispositions.docx
Population Cultural Considerations and Genetic Predispositions.docx
 
Childhood Obesity Powerpoint
Childhood Obesity PowerpointChildhood Obesity Powerpoint
Childhood Obesity Powerpoint
 
Meiler_Final_Paper
Meiler_Final_PaperMeiler_Final_Paper
Meiler_Final_Paper
 
Running head MATERNAL, INFANT AND CHILD HEALTH .docx
Running head MATERNAL, INFANT AND CHILD HEALTH                   .docxRunning head MATERNAL, INFANT AND CHILD HEALTH                   .docx
Running head MATERNAL, INFANT AND CHILD HEALTH .docx
 
WHO_.pdf
WHO_.pdfWHO_.pdf
WHO_.pdf
 
Understanding the Effect of the GAVI Initiative on Reported Vaccination Cover...
Understanding the Effect of the GAVI Initiative on Reported Vaccination Cover...Understanding the Effect of the GAVI Initiative on Reported Vaccination Cover...
Understanding the Effect of the GAVI Initiative on Reported Vaccination Cover...
 
POL 466 Capstone
POL 466 CapstonePOL 466 Capstone
POL 466 Capstone
 
Running head PICOT STATEMENT 1PICOT STATEMENT 3PICOT .docx
Running head PICOT STATEMENT 1PICOT STATEMENT 3PICOT .docxRunning head PICOT STATEMENT 1PICOT STATEMENT 3PICOT .docx
Running head PICOT STATEMENT 1PICOT STATEMENT 3PICOT .docx
 
Carter 1 Carter8Shanta CarterRechelle Chr.docx
Carter 1             Carter8Shanta CarterRechelle Chr.docxCarter 1             Carter8Shanta CarterRechelle Chr.docx
Carter 1 Carter8Shanta CarterRechelle Chr.docx
 
IOSR Journal of Pharmacy (IOSRPHR), www.iosrphr.org, call for paper, research...
IOSR Journal of Pharmacy (IOSRPHR), www.iosrphr.org, call for paper, research...IOSR Journal of Pharmacy (IOSRPHR), www.iosrphr.org, call for paper, research...
IOSR Journal of Pharmacy (IOSRPHR), www.iosrphr.org, call for paper, research...
 
HOSPITAL-AT-HOME (HOME CARE) FOR PRENATAL AND POSTNATAL(MATERNAL)C
HOSPITAL-AT-HOME (HOME CARE) FOR PRENATAL AND POSTNATAL(MATERNAL)CHOSPITAL-AT-HOME (HOME CARE) FOR PRENATAL AND POSTNATAL(MATERNAL)C
HOSPITAL-AT-HOME (HOME CARE) FOR PRENATAL AND POSTNATAL(MATERNAL)C
 
Note Compare and contrast public health funding (and resulting im.docx
Note Compare and contrast public health funding (and resulting im.docxNote Compare and contrast public health funding (and resulting im.docx
Note Compare and contrast public health funding (and resulting im.docx
 
End of Module 1 Project 12292014
End of Module 1 Project 12292014End of Module 1 Project 12292014
End of Module 1 Project 12292014
 
Improving the Measurement of Poverty
Improving the Measurement of PovertyImproving the Measurement of Poverty
Improving the Measurement of Poverty
 

More from harrym15

What is the rule of law- What are its implications for police officers.docx
What is the rule of law- What are its implications for police officers.docxWhat is the rule of law- What are its implications for police officers.docx
What is the rule of law- What are its implications for police officers.docxharrym15
 
What is existentialism in education-.docx
What is existentialism in education-.docxWhat is existentialism in education-.docx
What is existentialism in education-.docxharrym15
 
Principles of ManagementPrinciples of ManagementPrinciples of Manageme.docx
Principles of ManagementPrinciples of ManagementPrinciples of Manageme.docxPrinciples of ManagementPrinciples of ManagementPrinciples of Manageme.docx
Principles of ManagementPrinciples of ManagementPrinciples of Manageme.docxharrym15
 
The OJ Simpson murder trial introduced jurors- and those following the.docx
The OJ Simpson murder trial introduced jurors- and those following the.docxThe OJ Simpson murder trial introduced jurors- and those following the.docx
The OJ Simpson murder trial introduced jurors- and those following the.docxharrym15
 
MEMORANDUM DATE- TO- Tundra Medical System Surgeon and Anesthesi.docx
MEMORANDUM   DATE-   TO-   Tundra Medical System Surgeon and Anesthesi.docxMEMORANDUM   DATE-   TO-   Tundra Medical System Surgeon and Anesthesi.docx
MEMORANDUM DATE- TO- Tundra Medical System Surgeon and Anesthesi.docxharrym15
 
My best holiday.docx
My best holiday.docxMy best holiday.docx
My best holiday.docxharrym15
 
leadership.docx
leadership.docxleadership.docx
leadership.docxharrym15
 
in the uploaded file.docx
in the uploaded file.docxin the uploaded file.docx
in the uploaded file.docxharrym15
 
MAN 4504 Operational Decision MakingInsert DateInsert NameFlorida Stat.docx
MAN 4504 Operational Decision MakingInsert DateInsert NameFlorida Stat.docxMAN 4504 Operational Decision MakingInsert DateInsert NameFlorida Stat.docx
MAN 4504 Operational Decision MakingInsert DateInsert NameFlorida Stat.docxharrym15
 
GUEST EDITORIALSocial Work and Implementation of theAffordable Care Ac.docx
GUEST EDITORIALSocial Work and Implementation of theAffordable Care Ac.docxGUEST EDITORIALSocial Work and Implementation of theAffordable Care Ac.docx
GUEST EDITORIALSocial Work and Implementation of theAffordable Care Ac.docxharrym15
 
In a 4-page paper- written in APA format using appropriate spelling-gr.docx
In a 4-page paper- written in APA format using appropriate spelling-gr.docxIn a 4-page paper- written in APA format using appropriate spelling-gr.docx
In a 4-page paper- written in APA format using appropriate spelling-gr.docxharrym15
 
Grand Canyon UniversityDNP-830A- Data AnalysisOctober 6- 202210 Strate.docx
Grand Canyon UniversityDNP-830A- Data AnalysisOctober 6- 202210 Strate.docxGrand Canyon UniversityDNP-830A- Data AnalysisOctober 6- 202210 Strate.docx
Grand Canyon UniversityDNP-830A- Data AnalysisOctober 6- 202210 Strate.docxharrym15
 
Discusision Post-- please answer each question with the header in bold.docx
Discusision Post-- please answer each question with the header in bold.docxDiscusision Post-- please answer each question with the header in bold.docx
Discusision Post-- please answer each question with the header in bold.docxharrym15
 
For the first replyYou will respond to another classmate with a substa.docx
For the first replyYou will respond to another classmate with a substa.docxFor the first replyYou will respond to another classmate with a substa.docx
For the first replyYou will respond to another classmate with a substa.docxharrym15
 
Copyright 2018 by Elsevier Inc- All rights reserved- Pagana- Mosbys M.docx
Copyright  2018 by Elsevier Inc- All rights reserved- Pagana- Mosbys M.docxCopyright  2018 by Elsevier Inc- All rights reserved- Pagana- Mosbys M.docx
Copyright 2018 by Elsevier Inc- All rights reserved- Pagana- Mosbys M.docxharrym15
 
SEE ATTACHMENT.docx
SEE ATTACHMENT.docxSEE ATTACHMENT.docx
SEE ATTACHMENT.docxharrym15
 
Criteria Ratings PointsTopic-domainsandconcepts35 to -31 ptsAdvancedCl.docx
Criteria Ratings PointsTopic-domainsandconcepts35 to -31 ptsAdvancedCl.docxCriteria Ratings PointsTopic-domainsandconcepts35 to -31 ptsAdvancedCl.docx
Criteria Ratings PointsTopic-domainsandconcepts35 to -31 ptsAdvancedCl.docxharrym15
 
Respond to this post! Metropolitan Ministries is a nonprofit organizat.docx
Respond to this post! Metropolitan Ministries is a nonprofit organizat.docxRespond to this post! Metropolitan Ministries is a nonprofit organizat.docx
Respond to this post! Metropolitan Ministries is a nonprofit organizat.docxharrym15
 
Ch- 2 Discussion Questions1- Explain why IT is both a business pressur.docx
Ch- 2 Discussion Questions1- Explain why IT is both a business pressur.docxCh- 2 Discussion Questions1- Explain why IT is both a business pressur.docx
Ch- 2 Discussion Questions1- Explain why IT is both a business pressur.docxharrym15
 
Chapter 4Evaluating the Competition in RetailingDunne-Lusch-Carver- Re.docx
Chapter 4Evaluating the Competition in RetailingDunne-Lusch-Carver- Re.docxChapter 4Evaluating the Competition in RetailingDunne-Lusch-Carver- Re.docx
Chapter 4Evaluating the Competition in RetailingDunne-Lusch-Carver- Re.docxharrym15
 

More from harrym15 (20)

What is the rule of law- What are its implications for police officers.docx
What is the rule of law- What are its implications for police officers.docxWhat is the rule of law- What are its implications for police officers.docx
What is the rule of law- What are its implications for police officers.docx
 
What is existentialism in education-.docx
What is existentialism in education-.docxWhat is existentialism in education-.docx
What is existentialism in education-.docx
 
Principles of ManagementPrinciples of ManagementPrinciples of Manageme.docx
Principles of ManagementPrinciples of ManagementPrinciples of Manageme.docxPrinciples of ManagementPrinciples of ManagementPrinciples of Manageme.docx
Principles of ManagementPrinciples of ManagementPrinciples of Manageme.docx
 
The OJ Simpson murder trial introduced jurors- and those following the.docx
The OJ Simpson murder trial introduced jurors- and those following the.docxThe OJ Simpson murder trial introduced jurors- and those following the.docx
The OJ Simpson murder trial introduced jurors- and those following the.docx
 
MEMORANDUM DATE- TO- Tundra Medical System Surgeon and Anesthesi.docx
MEMORANDUM   DATE-   TO-   Tundra Medical System Surgeon and Anesthesi.docxMEMORANDUM   DATE-   TO-   Tundra Medical System Surgeon and Anesthesi.docx
MEMORANDUM DATE- TO- Tundra Medical System Surgeon and Anesthesi.docx
 
My best holiday.docx
My best holiday.docxMy best holiday.docx
My best holiday.docx
 
leadership.docx
leadership.docxleadership.docx
leadership.docx
 
in the uploaded file.docx
in the uploaded file.docxin the uploaded file.docx
in the uploaded file.docx
 
MAN 4504 Operational Decision MakingInsert DateInsert NameFlorida Stat.docx
MAN 4504 Operational Decision MakingInsert DateInsert NameFlorida Stat.docxMAN 4504 Operational Decision MakingInsert DateInsert NameFlorida Stat.docx
MAN 4504 Operational Decision MakingInsert DateInsert NameFlorida Stat.docx
 
GUEST EDITORIALSocial Work and Implementation of theAffordable Care Ac.docx
GUEST EDITORIALSocial Work and Implementation of theAffordable Care Ac.docxGUEST EDITORIALSocial Work and Implementation of theAffordable Care Ac.docx
GUEST EDITORIALSocial Work and Implementation of theAffordable Care Ac.docx
 
In a 4-page paper- written in APA format using appropriate spelling-gr.docx
In a 4-page paper- written in APA format using appropriate spelling-gr.docxIn a 4-page paper- written in APA format using appropriate spelling-gr.docx
In a 4-page paper- written in APA format using appropriate spelling-gr.docx
 
Grand Canyon UniversityDNP-830A- Data AnalysisOctober 6- 202210 Strate.docx
Grand Canyon UniversityDNP-830A- Data AnalysisOctober 6- 202210 Strate.docxGrand Canyon UniversityDNP-830A- Data AnalysisOctober 6- 202210 Strate.docx
Grand Canyon UniversityDNP-830A- Data AnalysisOctober 6- 202210 Strate.docx
 
Discusision Post-- please answer each question with the header in bold.docx
Discusision Post-- please answer each question with the header in bold.docxDiscusision Post-- please answer each question with the header in bold.docx
Discusision Post-- please answer each question with the header in bold.docx
 
For the first replyYou will respond to another classmate with a substa.docx
For the first replyYou will respond to another classmate with a substa.docxFor the first replyYou will respond to another classmate with a substa.docx
For the first replyYou will respond to another classmate with a substa.docx
 
Copyright 2018 by Elsevier Inc- All rights reserved- Pagana- Mosbys M.docx
Copyright  2018 by Elsevier Inc- All rights reserved- Pagana- Mosbys M.docxCopyright  2018 by Elsevier Inc- All rights reserved- Pagana- Mosbys M.docx
Copyright 2018 by Elsevier Inc- All rights reserved- Pagana- Mosbys M.docx
 
SEE ATTACHMENT.docx
SEE ATTACHMENT.docxSEE ATTACHMENT.docx
SEE ATTACHMENT.docx
 
Criteria Ratings PointsTopic-domainsandconcepts35 to -31 ptsAdvancedCl.docx
Criteria Ratings PointsTopic-domainsandconcepts35 to -31 ptsAdvancedCl.docxCriteria Ratings PointsTopic-domainsandconcepts35 to -31 ptsAdvancedCl.docx
Criteria Ratings PointsTopic-domainsandconcepts35 to -31 ptsAdvancedCl.docx
 
Respond to this post! Metropolitan Ministries is a nonprofit organizat.docx
Respond to this post! Metropolitan Ministries is a nonprofit organizat.docxRespond to this post! Metropolitan Ministries is a nonprofit organizat.docx
Respond to this post! Metropolitan Ministries is a nonprofit organizat.docx
 
Ch- 2 Discussion Questions1- Explain why IT is both a business pressur.docx
Ch- 2 Discussion Questions1- Explain why IT is both a business pressur.docxCh- 2 Discussion Questions1- Explain why IT is both a business pressur.docx
Ch- 2 Discussion Questions1- Explain why IT is both a business pressur.docx
 
Chapter 4Evaluating the Competition in RetailingDunne-Lusch-Carver- Re.docx
Chapter 4Evaluating the Competition in RetailingDunne-Lusch-Carver- Re.docxChapter 4Evaluating the Competition in RetailingDunne-Lusch-Carver- Re.docx
Chapter 4Evaluating the Competition in RetailingDunne-Lusch-Carver- Re.docx
 

Recently uploaded

mini mental status format.docx
mini    mental       status     format.docxmini    mental       status     format.docx
mini mental status format.docxPoojaSen20
 
MENTAL STATUS EXAMINATION format.docx
MENTAL     STATUS EXAMINATION format.docxMENTAL     STATUS EXAMINATION format.docx
MENTAL STATUS EXAMINATION format.docxPoojaSen20
 
Alper Gobel In Media Res Media Component
Alper Gobel In Media Res Media ComponentAlper Gobel In Media Res Media Component
Alper Gobel In Media Res Media ComponentInMediaRes1
 
Concept of Vouching. B.Com(Hons) /B.Compdf
Concept of Vouching. B.Com(Hons) /B.CompdfConcept of Vouching. B.Com(Hons) /B.Compdf
Concept of Vouching. B.Com(Hons) /B.CompdfUmakantAnnand
 
Class 11 Legal Studies Ch-1 Concept of State .pdf
Class 11 Legal Studies Ch-1 Concept of State .pdfClass 11 Legal Studies Ch-1 Concept of State .pdf
Class 11 Legal Studies Ch-1 Concept of State .pdfakmcokerachita
 
Incoming and Outgoing Shipments in 1 STEP Using Odoo 17
Incoming and Outgoing Shipments in 1 STEP Using Odoo 17Incoming and Outgoing Shipments in 1 STEP Using Odoo 17
Incoming and Outgoing Shipments in 1 STEP Using Odoo 17Celine George
 
Call Girls in Dwarka Mor Delhi Contact Us 9654467111
Call Girls in Dwarka Mor Delhi Contact Us 9654467111Call Girls in Dwarka Mor Delhi Contact Us 9654467111
Call Girls in Dwarka Mor Delhi Contact Us 9654467111Sapana Sha
 
Paris 2024 Olympic Geographies - an activity
Paris 2024 Olympic Geographies - an activityParis 2024 Olympic Geographies - an activity
Paris 2024 Olympic Geographies - an activityGeoBlogs
 
The Most Excellent Way | 1 Corinthians 13
The Most Excellent Way | 1 Corinthians 13The Most Excellent Way | 1 Corinthians 13
The Most Excellent Way | 1 Corinthians 13Steve Thomason
 
Introduction to AI in Higher Education_draft.pptx
Introduction to AI in Higher Education_draft.pptxIntroduction to AI in Higher Education_draft.pptx
Introduction to AI in Higher Education_draft.pptxpboyjonauth
 
Sanyam Choudhary Chemistry practical.pdf
Sanyam Choudhary Chemistry practical.pdfSanyam Choudhary Chemistry practical.pdf
Sanyam Choudhary Chemistry practical.pdfsanyamsingh5019
 
CARE OF CHILD IN INCUBATOR..........pptx
CARE OF CHILD IN INCUBATOR..........pptxCARE OF CHILD IN INCUBATOR..........pptx
CARE OF CHILD IN INCUBATOR..........pptxGaneshChakor2
 
BASLIQ CURRENT LOOKBOOK LOOKBOOK(1) (1).pdf
BASLIQ CURRENT LOOKBOOK  LOOKBOOK(1) (1).pdfBASLIQ CURRENT LOOKBOOK  LOOKBOOK(1) (1).pdf
BASLIQ CURRENT LOOKBOOK LOOKBOOK(1) (1).pdfSoniaTolstoy
 
call girls in Kamla Market (DELHI) 🔝 >༒9953330565🔝 genuine Escort Service 🔝✔️✔️
call girls in Kamla Market (DELHI) 🔝 >༒9953330565🔝 genuine Escort Service 🔝✔️✔️call girls in Kamla Market (DELHI) 🔝 >༒9953330565🔝 genuine Escort Service 🔝✔️✔️
call girls in Kamla Market (DELHI) 🔝 >༒9953330565🔝 genuine Escort Service 🔝✔️✔️9953056974 Low Rate Call Girls In Saket, Delhi NCR
 
microwave assisted reaction. General introduction
microwave assisted reaction. General introductionmicrowave assisted reaction. General introduction
microwave assisted reaction. General introductionMaksud Ahmed
 
_Math 4-Q4 Week 5.pptx Steps in Collecting Data
_Math 4-Q4 Week 5.pptx Steps in Collecting Data_Math 4-Q4 Week 5.pptx Steps in Collecting Data
_Math 4-Q4 Week 5.pptx Steps in Collecting DataJhengPantaleon
 
Presiding Officer Training module 2024 lok sabha elections
Presiding Officer Training module 2024 lok sabha electionsPresiding Officer Training module 2024 lok sabha elections
Presiding Officer Training module 2024 lok sabha electionsanshu789521
 
Enzyme, Pharmaceutical Aids, Miscellaneous Last Part of Chapter no 5th.pdf
Enzyme, Pharmaceutical Aids, Miscellaneous Last Part of Chapter no 5th.pdfEnzyme, Pharmaceutical Aids, Miscellaneous Last Part of Chapter no 5th.pdf
Enzyme, Pharmaceutical Aids, Miscellaneous Last Part of Chapter no 5th.pdfSumit Tiwari
 

Recently uploaded (20)

mini mental status format.docx
mini    mental       status     format.docxmini    mental       status     format.docx
mini mental status format.docx
 
MENTAL STATUS EXAMINATION format.docx
MENTAL     STATUS EXAMINATION format.docxMENTAL     STATUS EXAMINATION format.docx
MENTAL STATUS EXAMINATION format.docx
 
Alper Gobel In Media Res Media Component
Alper Gobel In Media Res Media ComponentAlper Gobel In Media Res Media Component
Alper Gobel In Media Res Media Component
 
Concept of Vouching. B.Com(Hons) /B.Compdf
Concept of Vouching. B.Com(Hons) /B.CompdfConcept of Vouching. B.Com(Hons) /B.Compdf
Concept of Vouching. B.Com(Hons) /B.Compdf
 
Class 11 Legal Studies Ch-1 Concept of State .pdf
Class 11 Legal Studies Ch-1 Concept of State .pdfClass 11 Legal Studies Ch-1 Concept of State .pdf
Class 11 Legal Studies Ch-1 Concept of State .pdf
 
Incoming and Outgoing Shipments in 1 STEP Using Odoo 17
Incoming and Outgoing Shipments in 1 STEP Using Odoo 17Incoming and Outgoing Shipments in 1 STEP Using Odoo 17
Incoming and Outgoing Shipments in 1 STEP Using Odoo 17
 
Call Girls in Dwarka Mor Delhi Contact Us 9654467111
Call Girls in Dwarka Mor Delhi Contact Us 9654467111Call Girls in Dwarka Mor Delhi Contact Us 9654467111
Call Girls in Dwarka Mor Delhi Contact Us 9654467111
 
Paris 2024 Olympic Geographies - an activity
Paris 2024 Olympic Geographies - an activityParis 2024 Olympic Geographies - an activity
Paris 2024 Olympic Geographies - an activity
 
The Most Excellent Way | 1 Corinthians 13
The Most Excellent Way | 1 Corinthians 13The Most Excellent Way | 1 Corinthians 13
The Most Excellent Way | 1 Corinthians 13
 
Introduction to AI in Higher Education_draft.pptx
Introduction to AI in Higher Education_draft.pptxIntroduction to AI in Higher Education_draft.pptx
Introduction to AI in Higher Education_draft.pptx
 
Model Call Girl in Bikash Puri Delhi reach out to us at 🔝9953056974🔝
Model Call Girl in Bikash Puri  Delhi reach out to us at 🔝9953056974🔝Model Call Girl in Bikash Puri  Delhi reach out to us at 🔝9953056974🔝
Model Call Girl in Bikash Puri Delhi reach out to us at 🔝9953056974🔝
 
Sanyam Choudhary Chemistry practical.pdf
Sanyam Choudhary Chemistry practical.pdfSanyam Choudhary Chemistry practical.pdf
Sanyam Choudhary Chemistry practical.pdf
 
CARE OF CHILD IN INCUBATOR..........pptx
CARE OF CHILD IN INCUBATOR..........pptxCARE OF CHILD IN INCUBATOR..........pptx
CARE OF CHILD IN INCUBATOR..........pptx
 
BASLIQ CURRENT LOOKBOOK LOOKBOOK(1) (1).pdf
BASLIQ CURRENT LOOKBOOK  LOOKBOOK(1) (1).pdfBASLIQ CURRENT LOOKBOOK  LOOKBOOK(1) (1).pdf
BASLIQ CURRENT LOOKBOOK LOOKBOOK(1) (1).pdf
 
Model Call Girl in Tilak Nagar Delhi reach out to us at 🔝9953056974🔝
Model Call Girl in Tilak Nagar Delhi reach out to us at 🔝9953056974🔝Model Call Girl in Tilak Nagar Delhi reach out to us at 🔝9953056974🔝
Model Call Girl in Tilak Nagar Delhi reach out to us at 🔝9953056974🔝
 
call girls in Kamla Market (DELHI) 🔝 >༒9953330565🔝 genuine Escort Service 🔝✔️✔️
call girls in Kamla Market (DELHI) 🔝 >༒9953330565🔝 genuine Escort Service 🔝✔️✔️call girls in Kamla Market (DELHI) 🔝 >༒9953330565🔝 genuine Escort Service 🔝✔️✔️
call girls in Kamla Market (DELHI) 🔝 >༒9953330565🔝 genuine Escort Service 🔝✔️✔️
 
microwave assisted reaction. General introduction
microwave assisted reaction. General introductionmicrowave assisted reaction. General introduction
microwave assisted reaction. General introduction
 
_Math 4-Q4 Week 5.pptx Steps in Collecting Data
_Math 4-Q4 Week 5.pptx Steps in Collecting Data_Math 4-Q4 Week 5.pptx Steps in Collecting Data
_Math 4-Q4 Week 5.pptx Steps in Collecting Data
 
Presiding Officer Training module 2024 lok sabha elections
Presiding Officer Training module 2024 lok sabha electionsPresiding Officer Training module 2024 lok sabha elections
Presiding Officer Training module 2024 lok sabha elections
 
Enzyme, Pharmaceutical Aids, Miscellaneous Last Part of Chapter no 5th.pdf
Enzyme, Pharmaceutical Aids, Miscellaneous Last Part of Chapter no 5th.pdfEnzyme, Pharmaceutical Aids, Miscellaneous Last Part of Chapter no 5th.pdf
Enzyme, Pharmaceutical Aids, Miscellaneous Last Part of Chapter no 5th.pdf
 

The Review of Economics and StatisticsVOL- XCIII MAY 2011 NUMBER 2INSI.docx

  • 1. The Review of Economics and Statistics VOL. XCIII MAY 2011 NUMBER 2 INSIDE THE WAR ON POVERTY: THE IMPACT OF FOOD STAMPS ON BIRTH OUTCOMES Douglas Almond, Hilary W. Hoynes, and Diane Whitmore Schanzenbach* Abstract—This paper evaluates the health impacts of a signature initiative of the War on Poverty: the introduction of the modern Food Stamp Pro- gram (FSP). Using variation in the month FSP began operating in each U.S. county, we find that pregnancies exposed to FSP three months prior to birth yielded deliveries with increased birth weight, with the largest gains at the lowest birth weights. We also find small but statistically insig- nificant improvements in neonatal mortality. We conclude that the sizable increase in income from FSP improved birth outcomes for both whites and African Americans, with larger impacts for African American mothers. I. Introduction IN this paper, we evaluate the health consequences of a sizable improvement in the resources available to Ameri- ca’s poorest. In particular, we examine the impact of the Food Stamp Program (FSP), which in 2007 provided $34 billion in payments to about 13 million households, on infant health. Our paper makes two distinct contributions. First, although the goal of the FSP is to increase the nutri- tion of the poor, few papers have examined its impact on health outcomes. Second, building on work by Hoynes and Schanzenbach (2009), we argue that the FSP treatment represents an exogenous increase in income for the poor. Our analysis therefore represents a causal estimate of the impact of income on health, an important topic with little convincing evidence due to concerns about endogeneity and reverse causality (Currie, 2009). We use the natural experiment afforded by the nation- wide rollout of the modern FSP during the 1960s and early 1970s. Our identification strategy uses the sharp timing of the county-by-county rollout of the FSP, which was initially constrained by congressional funding authorizations (and ultimately became available in all counties by 1975). Speci- fically, we use information on the month the FSP began operating in each of the roughly 3,100 U.S. counties and examine the impact of the FSP rollout on mean birth weight, low birth weight, gestation, and neonatal mortality. Throughout the history of the FSP, the program para- meters have been set by the U.S. Department of Agriculture (USDA) and are uniform across states. In the absence of the state- level variation often leveraged by economists to eval- uate transfer programs, previous FSP research has typically resorted to strong assumptions as to the comparability of FSP participants and eligible nonparticipants (Currie, 2003). Not surprisingly, the literature is far from settled as to what casual impact (if any) the FSP has on nutrition and health.
  • 2. Hoynes and Schanzenbach (2009) use this county rollout to examine the impact of the FSP on food consumption using the PSID. They found that the introduction of the FSP increased total food spending and decreased out-of-pocket food spending. Importantly, consistent with the predictions of canonical microeconomic theory, the magnitude of the increase in food expenditures was similar to an equivalent- sized income transfer, implying that most recipient house- holds were inframarginal (that is, they would spend more on the subsidized good than the face value of the in-kind transfer). As one of the largest antipoverty programs in the United States—comparable in cost to the earned income tax credit (EITC) and substantially larger than Temporary Assistance to Needy Families (TANF)—understanding FSP effects is valuable both in its own right and for what it reveals about the relationship between income and health.1 We focus on birth outcomes for several reasons. First, families represent an important subgroup of the food stamp caseload. Over 60% of food stamp households include chil- Received for publication February 4, 2009. Revision accepted for publi- cation December 9, 2009. * Almond: Columbia University and NBER; Hoynes: University of California, Davis and NBER; Schanzenbach: Northwestern University and NBER. We thank Justin McCrary for providing the Chay-Greenstone-McCrary geography crosswalk and Karen Norberg for advice on cause-of-death codes. This work was supported by a USDA Food Assistance Research Grant (awarded by the Joint Center for Poverty Research at Northwestern University and University of Chicago), the Population Research Center at the University of Chicago, and USDA FANRP Project 235, ‘‘Impact of Food Stamps and WIC on Health and Long Run Economic Outcomes.’’ We also thank Ken Chay, Janet Currie, Ted Joyce, Bob LaLonde, Doug Miller, Bob Whitaker, and seminar participants at the Harris School, Dart- mouth, MIT, LSE, the California Center of Population Research (UCLA), Duke, Cornell, UC Irvine, IIES (Stockholm University), the NBER Sum- mer Institute, and the SF Fed Summer Institute for helpful comments. Alan Barreca, Rachel Henry Currans-Sheehan, Elizabeth Munnich, Ankur Patel, and Charles Stoecker provided excellent research assistance, and Usha Patel entered the regionally aggregated vital statistics data for 1960 through 1975. The online appendix referred to throughout the article is available at http://www.mitpressjournals.org/doi/suppl/10.1162/REST_a_00089. 1 The cost of the FSP was $33 billion in 2006 (compared to $24 billion for TANF, $33 billion for the EITC, and $5.4 billion for WIC, the Special Supplemental Nutrition Program for Women, Infants and Children). The Review of Economics and Statistics, May 2011, 93(2): 387–403 � 2011 by the President and Fellows of Harvard College and the Massachusetts Institute of Technology
  • 3. dren, and one-third have at least one preschool-age child. Second, birth outcomes improved substantially during the late 1960s and early 1970s. Third, to the extent that the FSP improved birth outcomes, later-life health outcomes of these cohorts may have also benefited (Barker, 1992; Black, Devereux, & Salvanes, 2007). Finally, the vital statistics data used in this project are ideally suited for analyzing FSP rollout: the birth (death) microdata contain the county of birth (death) and the month of birth (death). This, com- bined with the large sample sizes (for example, more than 1 million birth records per year in the data set), allows us to use the discrete nature of the FSP rollout with significant statistical power. We find that infant outcomes improve with FSP introduc- tion. Changes in mean birth weight are small, increasing roughly half a percent for blacks and whites who partici- pated in the program (effect of the treatment on the treated). Impacts were larger at the bottom of the birth weight distri- bution, reducing the incidence of low birth weight among the treated by 7% for whites and between 5% and 11% for blacks. Changes in this part of the birth weight distribution are important because they are closely linked to other new- born health measures. Although not all treatment effects are statistically significant, they point consistently to improve- ments in birth weight following the introduction of the FSP. We also find that the FSP introduction leads to a reduction in neonatal mortality, although these results rarely reach statistical significance. We find very small (but precisely estimated) impacts of the FSP on fertility, suggesting that the results are not biased by endogenous sample selection. All results are robust to various sets of controls, such as county fixed effects, state-by-year fixed effects, and county- specific linear trends. Moreover, FSP impact estimates are robust to and little changed by county-by-year controls for federal spending on other social programs, suggesting our basic identification strategy is clean. Finally, we present an event study analysis that further supports the validity of the identification strategy. Food stamps are the fundamental safety net in the United States. Unlike other means-tested programs, there is no additional targeting to specific subpopulations. Current benefits average about $200 per recipient household per month. Our analysis constitutes the first evidence that despite the fact that if did not target pregnant mothers (or even women), introduction of the FSP improved newborn health. II. Introduction of the Food Stamp Program The modern FSP began with President Kennedy’s 1961 announcement of a pilot food stamp program that was to be established in 8 impoverished counties. The pilot programs were expanded to 43 counties in 1962 and 1963. The suc- cess with these pilot programs led to the Food Stamp Act of 1964 (FSA), which gave local areas the authority to start up the FSP in their county. As with the current FSP, the pro- gram was federally funded, and benefits were redeemable at approved retail food stores. In the period following the pas- sage of the FSA, a steady stream of counties initiated such programs, and federal spending on the FSP more than doubled between 1967 and 1969 (from $115 million to $250 million). Support for requiring counties to participate in FSP grew due to a national spotlight on hunger (Berry, 1984). This interest culminated in passage of 1973 amend- ments to the Food Stamp Act, which mandated that all counties offer FSP by 1975.
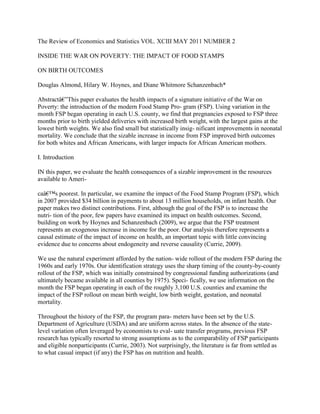
  • 4. Figure 1 plots the percentage of counties with an FSP from 1960 to 1975.2 During the pilot phase (1961–1964), FSP coverage increased slowly. Beginning in 1964, pro- gram growth accelerated, and coverage expanded at a steady pace until all counties were covered in 1974. Furthermore, there was substantial heterogeneity in the tim- ing of adoption of the FSP, both within and across states. The map in figure 2 shades counties according to the date of FSP adoption (darker shading denotes a later start-up date). Our basic identification strategy considers the month of FSP adoption for each county the FSP ‘‘treatment.’’3 For our identification strategy to yield causal estimates of the program, it is key to establish that the timing of FSP adoption appears to be exogenous. Prior to the FSP, some counties provided food aid through the Commodity Distri- bution Program (CDP), which took surplus food purchased by the federal government as part of an agricultural price support policy and distributed those goods to the poor. The 1964 Food Stamp Act allowed counties to voluntarily set up an FSP, but the act also stated that no county could run both the FSP and the CDP. Thus, for counties that pre- viously ran a CDP, adoption of the FSP implies termination of the CDP.4 The political accounts of the time suggest that debates about adopting the FSP pitted powerful agricultural interests (which favored the CDP) against advocates for the poor (who favored the FSP; see MacDonald, 1977; Berry, 1984).5 In particular, counties with strong support for farm- 2 Counties are weighted by their 1970 population. Note this is not the food stamp caseload, but represents the percentage of the U.S. population that lived in a county with an FSP. 3 This timing lines up exceptionally well with county-level FSP spend- ing as measured in the Regional Economic Information System data. See online appendix table 3. 4 This transition in nutritional assistance would tend to bias FSP impact estimates downward, but we do not think this bias is substantial because of the limited scope of the CDP. The CDP was not available in all coun- ties, and recipients often had to travel long distances to pick up the items. Further, the commodities were distributed infrequently and inconsistently, and provided a narrow set of commodities. The most frequently available were flour, cornmeal, rice, dried milk, peanut butter, and rolled wheat (Citizens’ Board of Inquiry 1968). In contrast, food stamp benefits can be used to purchase all food items (except hot foods for immediate consump- tion, alcoholic beverages, and vitamins). 5 In fact, as Berry (1984) and Ripley (1969) noted, passage of the 1964 Food Stamp Act was achieved through classic legislative logrolling. The farm interest coalition (southern Democrats, Republicans) wanted to pass an important cotton-wheat subsidy bill while advocates for the poor (northern Democrats) wanted to pass the FSA. Neither had majorities, yet they made an arrangement, supported each others’ bills, and both bills passed. 388 THE REVIEW OF ECONOMICS AND STATISTICS ing interests (such as southern or rural counties) may be late adopters of the FSP. Counties with strong support for the low-income population (such as northern, urban counties
  • 5. with large populations of poor) may adopt FSP earlier in the period. This systematic variation in food stamp adoption could lead to spurious estimates of the program impact if FIGURE 2.—FOOD STAMP PROGRAM START DATE BY COUNTY (1961–1975) Authors’ tabulations of food stamp administrative data (U.S. Department of Agriculture, various years). The shading corresponds to the county FSP start date, where darker shading indicates later county imple- mentation. FIGURE 1.—WEIGHTED PERCENTAGE OF COUNTIES WITH A FOOD STAMP PROGRAM, 1960–1975 Authors’ tabulations of food stamp administrative data (U.S. Department of Agriculture, various years). Counties are weighted by their 1960 population. 389INSIDE THE WAR ON POVERTY those same county characteristics are associated with differ- ential trends in the outcome variables. In earlier work (Hoynes & Schanzenbach, 2009), we documented that larger counties with a greater fraction of the population that was urban, black, or low income indeed implemented the FSP earlier, consistent with the historical accounts. We sought to predict FSP adoption date with 1960 county characteristics—those recorded immediately prior to the pilot FSP phase. That analysis showed that larger coun- ties and those with a higher share of black, elderly, young, or low income implemented earlier and those where more of the land was used in farming implement later.6 Neverthe- less, the county characteristics explain very little of the var- iation in adoption dates (see online appendix figure 1). This is consistent with the characterization of funding limits con- trolling the movement of counties off the waiting list to start up their FSP: ‘‘The program was quite in demand, as con- gressmen wanted to reap the good will and publicity that accompanied the opening of a new project. At this time there was always a long waiting list of counties that wanted to join the program. Only funding controlled the growth of the pro- gram as it expanded’’ (Berry, 1984, pp. 36–37). We view the weakness of this model fit as a strength when it comes to our identification approachin that much of the variation in the implementation of FSP appears to be idiosyncratic. Nonetheless, in order to control for possible differences in trends across counties that are spuriously cor- related with the county treatment effect, all of our regres- sions include interactions of these 1960 pretreatment county characteristics with time trends as in Acemoglu, Autor, and Lyle (2004) and Hoynes and Schanzenbach (2009). FSP introduction took place during a period of tremen- dous expansion in cash and noncash transfer programs as the War on Poverty and Great Society programs were expanding. To disentangle the FSP from these other pro- grams, the county-by-month variation in FSP rollout is key. Further, given that virtually all means-tested programs are administered at the state level, our controls for state-by-year fixed effects should absorb these program impacts. To be sure,
  • 6. however, our models include controls for per capita real county government (non–food stamp) transfers.7 III. Background Literature The goal of the FSP is to improve nutrition among the low-income population. As such, many studies have exam- ined the impact of the FSP on nutritional availability and intake, food consumption, food expenditures, and food inse- curity (see Currie, 2003, and Fraker, 1990, for reviews of the literature). Almost all existing studies of the impact of the FSP use research designs that rely on comparisons of program parti- cipants to nonparticipants at the individual level. This approach is subject to the usual criticisms regarding selec- tion into the program. For example, a number of researchers (Currie, 2003; Currie & Moretti, 2008; Fraker, 1990) have pointed out that if food stamp recipients are healthier, are more motivated, or have better access to health care than other eligible women, then comparisons between partici- pants and nonparticipants could produce positive program estimates even if the true effect is 0. Conversely, if food stamp participants are more disadvantaged than other families, such comparisons may understate the program’s impact. In fact, as Currie (2003) reported, several studies, including Basiotis, Cramer-LeBlanc, and Kennedy (1998) and Butler and Raymond (1996), find that food stamp parti- cipation leads to a reduction in nutritional intake. These unexpected results are almost certainly driven by negative selection in participation. Many researchers who evaluate the impact of other gov- ernment programs avoid these selection problems by com- paring outcomes across individuals living in states with different levels of benefit generosity or other program parameters. A long literature on the effects of cash assis- tance programs is based on this type of identification strat- egy (Moffitt, 1992; Blank, 2002). Unfortunately, the FSP is a federal program for which there is very little geo- graphic variation (aside from the variation we use in this paper) or variation in eligibility criteria or benefit levels, so prior researchers have had to employ alternative approaches. Identification issues aside, it is noteworthy that few FSP studies examine the impact on health outcomes. We are aware of two studies. Currie and Cole (1991) examine the impact of the FSP on birth weight using sibling comparisons and instrumental variable methods and find no significant impacts of the FSP. Our work is closer to that of Currie and Moretti (2008), who use the county rollout of FSP in Califor- nia to analyze birth outcomes. They find that FSP introduc- tion was associated with a reduction in birth weight, which was driven particularly by first births among teens and by changes for Los Angeles County. As discussed below, this negative effect is possible if the FSP led to fertility changes or increases in the survival of low-birth-weight fetuses. The timing of FSP assignment in Currie and Moretti (2008) differs from ours in that they consider FSP availability at the begin- ning of pregnancy and its impact on birth weight, whereas we focus on availability toward the end of pregnancy.8 The literature (see the review in Currie, 2009) provides few estimates of the causal impact of income on birth
  • 7. 6 For more detail, see table 1 in Hoynes and Schanzenbach (2009). 7 The Special Supplemental Food Program for Women, Infants and Children (WIC), available to low-income pregnant women and children up to age 5 in families, was introduced in 1974. Given the timing of WIC implementation relative to FSP, there is little concern that the introduc- tion of WIC biases our estimates of the introduction of FSP, and results limited to pre-1974 are qualitatively similar. 8 Table 3 shows the sensitivity of our impact estimates to the timing of FSP assignment. 390 THE REVIEW OF ECONOMICS AND STATISTICS weight. Cramer (1995) finds that mothers with more income have higher-birth-weight babies, although income is identi- fied cross-sectionally. Kehrer and Wolin (1979) find evi- dence that the Gary Income Maintenance Experiment may have improved birth weight. However sample sizes are small (N ¼ 404 births), and although positive effects were found for woman as being and high risk for low birth weight (young, smokers, short birth interval), perverse effects were found for woman classified as being of low risk low birth weight. Currie and Cole (1993), using IV and mother-fixed effects estimators, find that AFDC income leads to improvements in birth weight. Baker (2008) uses the 1993 expansion in the EITC, which disproportionately benefited families with two or more children, finding a 7 gram increase in the birth weight of subsequent children. In general, the literature has been plagued by imprecise esti- mates due to small sample sizes as well as a lack of well- identified sources of variation in income. As a result, we argue that our paper provides some of the best evidence to date on the impact of income on birth outcomes. IV. Food Stamps and Infant Health The FSP introduction represents an exogenous and siz- able increase in income for the poor. Canonical microeco- nomic theory predicts that in-kind transfers like food stamps will have the same impact on spending as an equiva- lent cash transfer for consumers who are inframarginal. Hoynes and Schanzenbach (2009) use the same FSP rollout identification approach and data from the PSID to examine the impacts of food stamps on food expenditures; they find that recipients of food stamps behave as if the benefits were paid in cash. Therefore, not only can we think of the FSP introduction as a large income transfer, we can think of it as for the most part the equivalent of a cash income transfer. With this framing, an increase in income could lead to changes in infant health through many channels. We would expect that spending on all normal goods would increase, therefore leading to increases in food consumption regard- less of whether the benefits are paid in cash or in kind. We have little information on how particular subcategories of food demand change with FSP availability: Hoynes and Schanzenbach (2009) are able to measure impacts on total food expenditures, but cannot provide information on the quantity or quality of food consumed (or other goods).
  • 8. The medical literature on the determinants of birth weight provides a useful structure for thinking about the possible channels for the health effects of the FSP. As Kra- mer (1987a, 1987b) suggested, birth weight is usefully decomposed into that related to the gestation length (prema- turity, or GL) and growth conditional on gestation length (intrauterine growth, or IUG). Of the two, GL is thought to be more difficult to manipulate, though empirically more important than IUG in affecting birth weight in developed countries (Kramer, 1987a, 1987b). Maternal nutrition and cigarette smoking are the two most important determinants of IUG that are potentially modifiable (Kramer, 1987a, 1987b). Finally, there is evidence that birth weight is gener- ally most responsive to nutritional changes affecting the third trimester of pregnancy.9 Kramer (1987a) writes, ‘‘It is important to analyze additional health measures in addition to birth weight: A final reminder concerns the need for future research to keep sight of the truly important out- comes of infant and child mortality, morbidity, and func- tional performance. After all, birth weight and gestational age are important only insofar as they affect these out- comes’’ (p. 510). We examine impacts on neonatal mortality because it is commonly linked to the health environment during preg- nancy; it is therefore plausible that FSP transfers may have been a factor. Estimates from Almond, Chay, and Lee (2005) indicate that a 1 pound increase in birth weight causes neonatal mortality to fall by 7 deaths per 1,000 births, or 24%. Postneonatal mortality, by contrast, is viewed as being more determined by postbirth factors.10 This discussion suggests that we would expect FSP to affect birth weight and neonatal mortality but not necessarily gestational length. One obvious channel for food stamp impacts is through improvements in nutrition. The introduc- tion of the FSP transfer increases total family resources and is predicted to increase the quality and quantity of food con- sumed, thereby leading to improvements in infant health. The increased transfer income could also encourage behaviors that could harm infant health, such as smoking or drinking.11 Health improvements may work through other channels as well, for instance, reducing stress (such as financial stress) experienced by the mother, which itself may have a direct impact on birth weight. We explore these issues by separately testing for FSP impacts on length of gestation and birth weight and by exploring the sensitivity of our impact estimates to the timing of FSP assignment by pregnancy trimester. Overall, we expect that access to the FSP should improve infant health. The same forces that improve infant health, however, could also lead to a change in the composition of births. In particular, if improvements in fetal health lead to fewer fetal deaths, there could be a negative compositional effect on birth weight from the improved survivability of marginal fetuses. This could bias downward the estimated 9 See the literature review of Rush et al. (1980). For example, the cohort exposed to the Dutch famine in the third trimester had lower average birth weight than cohorts exposed earlier in pregnancy (Painter, Rosebooma, & Bleker, 2005).
  • 9. 10 The initial health at birth is generally much better among infants who die in the postneonatal period than among infants dying in the first month of life. For example, while 72% of all neonatal deaths had a low birth weight (below 2,500 grams), only 20% of all postneonatal deaths were low-birth-weight infants (Starfield, 1985). Postneonatal deaths tend to be caused by negative events after birth, most often by infectious diseases and accidents (Grossman & Jacobowitz, 1981). Further, postneonatal deaths may be more responsive to hospital access than neonatal deaths (see Almond, Chay, & Greenstone, 2007). 11 Although recipients cannot purchase cigarettes directly with FSP benefits, the increase in resources to the household may increase cigarette consumption, which would work to reduce birth weight. 391INSIDE THE WAR ON POVERTY effects of the FSP on birth weight and infant mortality.12 In addition, if FSP introduction leads to increases in fertility for disadvantaged women, this could also lead to negative compositional effect and a subsequent downward bias on the estimates.13 To evaluate such channels, we test for impacts of the FSP on total births (finding no effect). V. Data The data for our analysis are combined from several sources. The key treatment or policy variable is the month and year that each county implemented a food stamp pro- gram, which comes from USDA annual reports on county food stamp caseloads (USDA, various years). These adminis- trative FSP data are combined with two microdata sets on births and deaths from the National Center for Health Statis- tics. In some cases, we augment the core microdata with digi- tized print vital statistics documents to extend analysis to the years preceding the beginning of the microdata. These data are merged with other county-level data from several sources. A. Vital Statistics Natality Data These data are coded from birth certificates and are avail- able beginning in 1968. Depending on the state-year, these data are either a 100% or 50% sample of births, and there are about 2 million observations per year. Reported birth outcomes include birth weight, gender, plurality, and (in some state-years) gestational length. Data on the month and county of birth permit linkage of natality outcomes to the month the FSP was introduced in a given county. There are also (limited) demographic variables, including age and race of the mother and (in some states and years) mother’s educa- tion and marital status. Online appendix table 1 provides information on the availability of these variables over time. We use the natality data and collapse the data to county- race-quarter cells covering the years 1968 to 1977. We use quarters (rather than months) to keep the sample size man- ageable. The results are unchanged if we instead use county- race-month cells. We end the sample in 1977, two years after all counties have implemented the FSP and before the pro- gram changes enacted in 1978 led to increases in take-up.
  • 10. Unfortunately, natality microdata are available only beginning in 1968. By 1968, half of the population lived in counties with on FSP in place. In the interest of examining the full FSP rollout, we obtained annual print vital statistics documents and digitized the available data. With these print documents, we augment the microdata with counts of the total number of births by county and year (not available by race) for 1959 to 1967 and counts of births by birth weight ranges by state, race and year (not available by county) for 1959 to 1967.14 B. Vital Statistics Death Data These data are coded from death certificates and are available beginning in 1959. The data encompass the uni- verse of death certificates (except in 1972, when they are a 50% sample) and report the age and race of the decedent, the cause of death, and the month and county of death. We collapse the data to county-race-quarter cells covering the years 1959 to 1977. Our mortality measure is the neonatal mortality rate, defined as deaths in the first 28 days of life per 1,000 live births. We focus on deaths from all causes, as this gives us the most power (further cutting of the county-quarter-race cells by detailed cause of death leads to many very thin cells) and is unaffected by changes in the coding of cause of death (conversion from ICD-7 to ICD-8) in 1968. We have attempted to identify causes of death that could be affected by nutritional deficiencies and also present results for these and other deaths.15 We consider nutritional causes both because the FSP was targeted at those in nutritional risk and widespread concerns about nutritional status among the poor during this period. Online appendix table 2 lists the broad categories for cause of death. Our main neonatal results use the natality microdata to form the denominator (live births in the same county-race- quarter). This limits the sample to the years 1968 to 1977. In an extension, we use the digitized vital statistics docu- ments and county-year counts of births to construct the denominator for live births and therefore neonatal death rates (for all races) for 1959 to 1977.16 C. County Population Data The SEER population data are used to construct esti- mates of the population of women ages 15 to 44 by county- race-year.17 These are used with the natality data to con- 12 The estimates described in table 5 imply an imprecise 1% to 2% increase in the number of births among the treated. If we assume this increase is accounted for by reductions in early prenatal (embryonic) mor- tality, only to appear as deaths after birth during infancy, this would imply nearly a doubling of the infant mortality rate, which stood close to 2% nationally in 1970. Such an increase is not observed and would obviously overwhelm any reductions in infant mortality among those who would have survived until birth absent the FSP. That said, our data clearly do not allow us to distinguish between births that reflect a prevented embryo- nic or fetal death versus induced conceptions. But the magnitudes involved suggest that postponement of intrauterine mortality to the first year of life could not have been the norm or the infant mortality rate would have risen substantially. Thus, if we take the table 5 point estimates at face value (despite the large standard errors), either mortality was post- poned beyond infancy or the number of conceptions increased.
  • 11. 13 The existing literature suggests that the elasticity of fertility with respect to additional transfers from income support programs is very small (Moffitt, 1998). 14 For historical vital statistics documents, see http://www.cdc.gov/ nchs/products/pubs/pubd/vsus/1963/1963.htm. 15 We thank Karen Norberg for helping us identify the cause of death classifications. We are responsible for any classification errors. 16 We need quarterly births by race-county to match the quarterly deaths in the numerator. We use the distribution of births by quarter for each county in 1968 and assume that quarterly pattern holds for all years 1959–1967. In practice the ‘‘seasonality’’ of births across quarters is mini- mal. 17 See National Cancer Institute, http://seer.cancer.gov/popdata/ download.html. 392 THE REVIEW OF ECONOMICS AND STATISTICS struct fertility rates, defined as births per 1,000 women ages 15 to 44. Our main results use fertility rates by county-race- quarter for 1968 to 1977. We also use the digitized annual counts of births by county to construct fertility rates by county-year (not race, not quarter) for the full period 1959 to 1977. D. County Control Variables The 1960 City and County Data Book, which compiles data from the 1960 Census of Population and Census of Agriculture, is used to measure economic, demographic, and agricultural variables for the counties’ pretreatment (before FSP is rolled out) period. In particular, we use the percentage of the 1960 population that lives in an urban area, is black, is less than 5 years old, is 65 years or over, has income less than $3,000 (in 1959 dollars), the percen- tage of land in the county that is farmland, and log of the county population. We use the Bureau of Economic Analy- sis, Regional Economic Information System (REIS) data to construct annual, county real per capita income, and gov- ernment transfers to individuals, including cash public assistance benefits (Aid to Families with Dependent Chil- dren AFDC; Supplemental Security Income, SSI; and Gen- eral Assistance), medical spending (Medicare and military health care), and cash retirement and disability payments.18 These data are available electronically beginning in 1968. We extended the REIS data to 1959 by hand-entering data from microfiche for 1959, 1962, and 1965 to 1968.19 VI. Methodology We estimate the impact of the introduction of the FSP on county-level birth outcomes, infant mortality, and fertility, separately by race. Specifically, we estimate the following model: Yct ¼ aþ dFSPct þ bCB60c � tþ cXct
  • 12. þ gc þ dt þ lst þ ect: ð1Þ Yct (race suppressed) is a measure of infant health or fer- tility defined in county c at time t. In all specifications, we include unrestricted fixed effects for county gc and time dt. We examine the sensitivity to including state-by-year fixed effects lst or county-specific linear time trends, which are not shown in equation (1). FSPct is the food stamp treatment variable equal to 1 if the county has a food stamp program in place. The timing of the treatment dummy depends on the particular outcome variable used. For the analysis of births, we assign FSP ¼ 1 if there is an FSP in place at the beginning of the quarter prior to birth to proxy for beginning of the third trimester.20 We assign the treatment at the beginning of the third trime- ster following the evidence that this period is the most important for determining birth weight. However, we explore the sensitivity to changing the timing of the FSP treatment. Neonatal deaths are thought to be tied primarily to prenatal conditions, and we therefore use the same FSP timing (we use the age at death and measure the FSP as of three months prior to birth, to proxy for the beginning of the third trimester). We have less guidance for the correct timing for FSP treatment for fertility; we explore FSP avail- ability between three quarters prior to birth (to proxy for conception) and seven quarters prior to birth. The vector Xct contains the annual county-level controls from the REIS, including real per capita transfers and the log of real annual county per capita income. CB60c are the 1960 county characteristics, which we interact with a linear time trend to control for differential trends in health out- comes that might be correlated with the timing of FSP adoption. We consider several outcome variables in our main spe- cifications. First, using the natality data, we measure infant health at birth as continuous mean birth weight in grams and fraction low birth weight (less than 2,500 grams, or about 5.5 pounds). These measures are means within county-race-quarter. Second, using the mortality data, we examine impacts on neonatal mortality rates (per 1,000 live births) for all causes and for those likely to be affected by nutritional deficiencies. All estimates are weighted using the number of births in the county-race-quarter, and the standard errors are clus- tered by county. Further, to protect against estimation pro- blems associated with thinness in the data, for the natality (mortality) analysis, we drop all county-race- quarter cells where there are fewer than 25 (50) births.21 The results are not sensitive to this sample selection. We also drop Alaska because of difficulties in matching FSP service areas with counties. 18 Beginning in 1969, the REIS data permit more detailed categories for tabulating government transfers (including the ability to capture Medicaid spending). However, because the natality data begin in 1968 and the mor- tality data begin in 1959, we have adopted these three categories. In ana- lyses of the data limited to 1969 and after, the results are robust to adding more detailed categories. The REIS data also measure food stamp transfer payments, but for obvious reasons,
  • 13. we do not use this as a control in our model. We have, however, used the REIS data as a check on our USDA- measured county food stamp start dates. REIS-measured per capita spend- ing on FSP sharply increases precisely at the USDA-measured implemen- tation date. In the year prior to FSP introduction, 99% of counties report no spending on FSP; in the year of introduction, this falls to 1.3% and is less than 0.3% in subsequent years (online appendix table 3). 19 We used linear interpolation to fill in the missing years. We thank Gary Kennedy of the Bureau of Economic Analysis for providing the REIS data microfiche. 20 To be precise, because we collapse the data to the county-quarter, the FSP variable can sometimes equal something other than a 0 or 1. The natality data are available at the monthly level, and we use that to assign FSP status as of three months prior to birth (proxy for beginning of the third trimester). When the data are collapsed to the county-quarter, this policy variable is averaged among the three months of observations in that cell. Therefore, the policy variable ranges from 0 to 1, with most values at 0 or 1. 21 Neonatal mortality rates average 12 (19) per 1,000 births for whites (blacks) during our sample period. We use a higher threshold for the mor- tality analysis because of the low incidence of infant mortality. 393INSIDE THE WAR ON POVERTY VII. Results for Natality Table 1 presents the main results for mean birth weight and the fraction of births that are low birth weight (LBW) for 1968 to 1977. Results are presented separately for whites and blacks. For each outcome, we report estimates from four specifications with different controls. Column 1 includes county and time (year � quarter) fixed effects, county per capita income, REIS county-level per capita transfers, and 1960 county characteristics interacted with linear time. The remaining columns control for trends in three ways: column 2 with state-specific linear time trends, column 3 with unrestricted state-by-year fixed effects, and (4) with county- specific linear time trends. In this and all subsequent tables, the number of observations refers to county-quarter cells.22 The first four columns in panel A report the impact of hav- ing FSP in place in the third trimester of pregnancy on mean birth weight for births to white women. These columns indi- cate a small, statistically significant increase in birth weight for whites caused by exposure to FSP during the third trime- ster. The results are extremely robust across specifications, including controlling for county-specific linear time trends. When the estimated coefficient is divided by mean birth weight, the resulting effect size is a 0.06% to 0.08% increase in birth weight, labeled in this and subsequent tables as ‘‘% Impact (coef/mean)’’. As shown in panel B, the impact of FSP exposure on birth weight is 50% to 150% larger for blacks than whites. That, combined with a smaller average birth weight for blacks, implies an impact between 0.1% and 0.2% on blacks (about twice the impact on whites).
  • 14. Only a subset of women who give birth are likely to be affected by FSP. While the coefficients reported are valid estimates of the population impact of FSP, we also want to know the impact among FSP recipients (treatment on the treated). To calculate the implied impact on those who take up the FSP, we divide the parameters by an estimate of the FSP participation rate for this sample.23 We can inflate the estimated effect by these participation rates for an estimate of treatment on the treated. The results indicate that the impact of FSP on participants’ birth weight (labeled ‘‘Estimate, inflated’’) is between 15 and 20 grams for whites and 13 to 42 grams for blacks. The estimate expressed as a percentage of mean birth weight (labeled ‘‘% Impact inflated’’) is between 0.5% and 0.6% for whites and between 0.4% and 1.4% for blacks. TABLE 1.—IMPACTS OF FOOD STAMP INTRODUCTION ON BIRTH OUTCOMES, BY RACE (1) (2) (3) (4) (5) (6) (7) (8) Birth Weight (in Grams) Fraction below 2,500 Grams A: Whites Average FSP (0/1) 2.039 2.635 2.089 2.175 �0.0006 �0.0006 �0.0006 �0.0006 (0.947)* (0.896)** (1.039)* (0.975)** (0.0003)* (0.0003)* (0.0003)* (0.0004) % impact (coef/mean) 0.06% 0.08% 0.06% 0.06% �1.02% �1.02% �0.97% �0.97% Estimate inflated 15.68 20.27 16.07 16.73 �0.0047 �0.0047 �0.0045 �0.0045 % impact inflated 0.47% 0.61% 0.48% 0.50% �7.82% �7.82% �7.44% �7.44% Observations 97,785 97,785 97,785 97,785 97,785 97,785 97,785 97,785 R2 0.54 0.55 0.55 0.56 0.17 0.17 0.18 0.19 Mean of dependent variable 3,350 3,350 3,350 3,350 0.06 0.06 0.06 0.06 B: Blacks Average FSP (0/1) 3.454 4.120 5.466 1.665 �0.0015 �0.0016 �0.0019 �0.0009 (2.660) (2.317) (2.579)* (2.330) (0.0010) (0.0010) (0.0012) (0.0012) % impact (coef/mean) 0.11% 0.13% 0.18% 0.05% �1.13% �1.22% �1.49% �0.68% Estimate inflated 26.57 31.69 42.05 12.80 �0.0113 �0.0122 �0.0149 �0.0068 % impact inflated 0.86% 1.02% 1.36% 0.41% �8.70% �9.41% �11.48% �5.21% Observations 27,374 27,374 27,374 27,374 27,374 27,374 27,374 27,374 R2 0.32 0.33 0.34 0.35 0.15 0.15 0.17 0.18 mean of Dependent variable 3,097 3,097 3,097 3,097 0.13 0.13 0.13 0.13 1960 CCDB � linear time X X X X X X REIS controls X X X X X X X X County per capita real income X X X X X X X X Year quarter fixed effects X X X X X X X X County fixed effects X X X X X X X X State � linear time X X State � year fixed effects X X County � linear time X X Each parameter is from a separate regression of the outcome variable on the food stamp implementation dummy. The treatment is assigned as of three months prior to birth (proxy for beginning of the third trime- ster). The estimation sample includes means by race-county-quarter for years including 1968–1977 where cells with fewer than 25 births are dropped. In addition to the fixed effects, controls include 1960 county vari- ables (log of population, percentage of
  • 15. land in farming, percentage of population black, urban, age below 5, age above 65, and with income less than $3,000), each interacted with a linear time trend, per capita county transfer income (public assistance, medical care, and retirement and disability benefits), and county real per capita income. Estimates are weighted using the number of births in the cell and are clustered on county. Standard errors are in parentheses. Inflated impacts divide the parameter estimate by an estimate of the food stamp participation rate for the regression sample. 22 Note that with 3,142 counties and 40 quarters of data, the maximum number of observations would be about 125,000. As described above, we drop cells with fewer than 25 births. This reduces the sample of blacks much more than whites because blacks are more geographically concen- trated. Despite dropping many counties, this sample represents 98% of white births and 94% of black births. 23 We do not have information about food stamp participation in the natality data or sufficient data to impute eligibility (for example, income). Instead, we use the 1980 Current Population Survey and calculate FSP participation rates for women with a child under 5 years old. (Participa- tion rates look very similar if we alternatively use the presence of a child below age 1 or 3.) The estimated participation rate for women with young children (under age 5) is 0.13 for whites and 0.41 for blacks. 394 THE REVIEW OF ECONOMICS AND STATISTICS The results for birth weight (and the other outcomes described below) are very robust to adding more controls to the model. We view the specification with state-by-year unrestricted fixed effects as very encouraging, as we have controlled for a whole host of possibly contemporaneous changes to labor markets, government programs, and other things that vary at the state-year level. While not shown here, the county-level variables for government transfers and pretreatment variables do little to change the results. This provides further evidence that the food stamp rollout is exogenous, thereby validating the research design. Finally, we also find the results robust to adding county linear time trends (with some reduction for blacks). On the downside, the poor explanatory power of our control variables in pre- dicting the timing of FSP (described in section II) means that the precision of our impact estimates is not noticeably improved by including these regression controls. For the remainder of the tables, we adopt the specification with state-by-year fixed effects as our base case specification. Results (not presented here) are the same if log of birth weight is used as the dependent variable instead. Columns 5 through 8 repeat the exercise, this time with the fraction low birth weight (less than 2,500 grams) as the depen- dent variable. Exposure to FSP reduces LBW by a statistically significant 1% for whites (7–8% when inflated by participa- tion rate) and a less precisely estimated 0.7% to 1.5% for blacks (5% to 12% when inflated by participation rate). To further investigate the impact of the FSP on the distri- bution of birth weight, we estimated a series of models relating FSP introduction to the probability that birth weight is below a given gram threshold: 1,500; 2,000; 2,500; 3,000; 3,250; 3,500; 3,750; 4,000; 4,500 (Duflo 2001). We use the specification in column 3 with state-by-year fixed effects; the estimates and 95% confidence intervals are pre- sented in Figure 3 (we plot ‘‘% Impacts [coef/mean]’’
  • 16. not inflated by program participation). Figure 3A displays the results and confidence intervals for whites. We find that the largest percentage reduction in probability of birth weight below a certain threshold comes at very low thresholds of 1,500 and 2,000 grams. The impacts become gradually smaller as the birth weight threshold is increased to 2,500 grams and above, until there is no difference for births below 3,750 grams. Results are larger for blacks (figure 3B), showing a 6% decrease in the probability of a birth less than 1,500 grams, and an impact that declines at higher birth weights.24 Online appendix table 4 presents estimates for three addi- tional outcome variables: the fraction of births that are less than 1,500 grams, have gestation length less than 37 weeks (preterm births), and are female. These results show that FSP leads to a small and statistically insignificant decrease in preterm births and the fraction of births that are female. While small they are and statistically insignificant, this is consistent with recent work finding that prenatal nutritional deprivation tips the sex ratio in favor of girls (Mathews, Johnson, & Neil, 2008).25 One limitation of these results is that microdata on births by county are available only starting in 1968, at which point almost half of the population was already covered by the 24 In order to gauge the magnitude of these effects, it is useful to com- pare the estimated effects to those implied by the previous literature. Cra- mer (1995) finds that a 1% change in the income-to-poverty ratio leads to a 1.05 gram increase in mean birth weight. The Hoynes and Schanzen- bach (2009) estimates of the magnitude of food stamp benefits are $1,900 annually for participants (in 2005 dollars). Scaling those to match the units available in the literature (and treating FSP benefits as their face- value cash equivalent) implies that food stamps increased the family income-to-poverty ratio of participants by 15%. The implied treatment- on-treated effect would therefore be approximately 16 grams, which is quite similar to the effects found in table 1. FIGURE 3.—EFFECTS OF FSP IMPLEMENTATION ON DISTRIBUTION OF BIRTH WEIGHT, PERCENTAGE IMPACTS (COEFFICIENT/MEAN) The graph shows estimates and 95% confidence intervals for the estimate of the impact of FSP imple- mentation on the fraction of births in the county-quarter cell that is below each specified number of grams. The specification is given by column 3 in table 1. 25 In results not shown here, we find that birth-weight models are little changed by controlling for gestation (known as an IUG model). We also estimated models where the dependent variable is the fraction of births below a gestation-varying threshold (known as small-for-gestational-age models; Fenton, 2003). These models yielded results very similar to the LBW regressions. 395INSIDE THE WAR ON POVERTY FSP. In online appendix table 5 we use data from 1959 to 1977 to examine the impact of the FSP rollout on low birth weight and very low birth weight. To push the period back to 1959, we are limited to use of data at the state-race-year level (see the discussion in section V). Controls include state and year fixed effects, REIS variables, and state-speci- fic linear time trends; standard errors are clustered on state.26 We first present results for 1968 to 1977, where the data
  • 17. are identical to those used in table 1 but are collapsed to the state level. The results show imprecise but qualita- tively similar effects of FSP measured with this noisier treatment variable. (For example, the county analysis in table 1 shows a �1.0 percent impact on LBW for whites and �1.5 percent for blacks compared to �0.4 percent for whites and �1.6 percent for blacks for the state and year data in online appendix table 5). We then show the results for the full period (1959–1977) and the post-pilot program period (1964–1977). Whenever estimating models for the full FSP ramp-up period, we look separately at the period from 1964 because the pilot counties were clearly not exo- geneously chosen. Using these earlier (but more aggre- gated) data, we get qualitatively similar (and statistically indistinguishable) results across the different time periods, suggesting that missing the pre-1968 period in our main results may not qualitatively affect our conclusions. A. Impacts by Likelihood of Treatment We next explore whether the impacts of the FSP are lar- ger among subsets of the sample that are more likely to be affected by the FSP. The natality data include education of the mother and presence of the father, but because of miss- ing data (not all states collected this information in earlier years), we lose a substantial fraction of the sample (see, online appendix table 1). Nonetheless, we have estimated models by age of mother, education of mother, and pre- sence of the father (results not shown). Overall, the results showed that the impacts are larger for older mothers (age 25 and over). None of the education results are statistically significant. This analysis did reveal that black mothers with no father present experience much larger impacts than all black women. This is consistent with the high participation rates among this group (0.70 compared to 0.50 for all blacks). In lieu of detailed demographic variables, in table 2 we break counties into quartiles based on 1970 poverty rates, where we expect larger impacts in high-poverty counties. The results are quite striking: the gains are concentrated in the highest-poverty counties. Large, statistically significant effects are present in the highest-quartile poverty counties, while smaller and insignificant effects are presents in the lowest-poverty counties. (Due to the relatively large stan- dard errors, we cannot reject that they are equal.) There is some suggestion in the historical accounts that the impact might be different across geographic regions or might differ by race across regions. In particular, participa- tion in the program in the early years (after the county’s initial adoption of FSP) was probably higher in urban coun- ties and in the North. Barriers to accessing food stamps might have also differed between North and South and may have interacted with race (Citizens’ Board, 1968). Table 3 shows that the impact of FSP is larger and more statistically significant for both blacks and whites in urban counties. Interestingly, blacks appear to have larger effects outside the South, while whites appear to have larger effects in the South. These differences parallel the regional trends: Blacks TABLE 2.—IMPACT OF FOOD STAMP INTRODUCTION ON BIRTH OUTCOMES, BY QUARTILE OF POVERTY RATES
  • 18. (1) (2) (3) (4) Low-Poverty Counties (Lowest Quartile) High-Poverty Counties (Highest Quartile) Birth Weight Low Birth Weight Birth Weight Low Birth Weight Average FSP (0/1) 1.871 �0.001 3.409* �0.0012* (2.013) (0.001) (1.750) (0.0006) % impact (coef/mean) 0.06% �1.23% 0.10% �1.50% Observations 8,339 8,339 56,055 56,055 R2 0.78 0.38 0.56 0.26 Mean of dependent variable 3333 0.07 3303 0.08 Subsample population 0.23 0.23 0.26 0.26 1960 CCDB � linear time X X X X REIS controls X X X X County per capita real income X X X X Year � quarter fixed effects X X X X County fixed effects X X X X State � year fixed effects X X X X Each parameter is from a separate regression of the outcome variable on the food stamp implementation dummy. The treatment is assigned as of three months prior to birth. The estimation sample includes means by county-quarter for years including 1968–1977 where cells with fewer than 25 births are dropped. Controls include county, year � quarter and state � year fixed effects, 1960 county variables (log of population, percentage of land in farming, percentage of population black, urban, under age 5, over age 65 and with income less than $3,000), each interacted with a linear time trend, per capita county transfer income (public assistance, medical care, and retirement and disability benefits), and county real per capita income. Estimates are weighted using the number of births in the cell and are clustered on county. Standard errors are in par- entheses. Inflated impacts divide the parameter estimate by an estimate of the food stamp participation rate for the regression sample. Quartiles are assigned using 1970 county poverty rates (weighted using county population). 26 To construct state-level FSP treatment, we use the 1968 counts of number of births by county- month and calculate (for each state and year using the program variables) the percentage of births in the state that were in counties with FSP in place three months prior to birth. 396 THE REVIEW OF ECONOMICS AND STATISTICS saw larger reductions in low birth weight (and neonatal mortality) in the North, while whites saw larger declines in the South. The FSP impacts by South/non-South, however, are less precisely estimated than the results by urban/nonur- ban.27 B. Investigation of the Timing of Impacts To explore the possible channels for the impacts of the FSP transfer, table 4 reestimates the mean birth weight models varying the timing of the exposure to the FSP. The baseline specification—reprinted from column 3 of table 1—assigns the policy introduction as three months prior to birth, to proxy for beginning of the third trimester. Columns 2 and 3 of table 4 moves assignment of FSP treatment to two and three quarters before birth, respectively. Moving the treatment from third to second trimester reduces the impact of FSP substantially, though there is still a statisti- cally significant impact on birth weight for blacks. Further- more, assigning treatment at three quarters before birth (proxy for conception) yields even smaller and
  • 19. statistically insignificant impacts. The results in columns 4 and 5 show that conditional on third- trimester exposure, additional exposure earlier in the pregnancy has no additional benefits. Similar results are found for fraction low and very low birth weight. Recalling from section IV that the medical litera- ture suggests that nutrition has its greatest impact on birth weight during the third trimester, we view these estimates as suggestive that nutrition is playing an important channel for the FSP transfer’s benefits. In addition, these results pro- vide evidence that our model is not simply capturing a spur- ious correlation between FSP introduction and trends in infant outcomes at the county level.28 To further test for spurious trending in the county birth outcomes that might be loading on to FSP, we include a one-year lead of the policy variable for each of the birth outcome variables in online appendix table 6. There is no impact of the policy lead, and the results for the main policy variable are qualitatively unchanged. As described above, we use the month that the county implemented the FSP to measure food stamp availability during these pregnancies. If there was a lag in ramping up county food stamp programs, then our difference-in-differ- ence estimates will underestimate the true (eventual) pro- gram impacts. The administrative ramp-up was aided by the fact that the new FSP offices were often set up in the same building as the county welfare office. To directly evaluate the ramp-up in FSP operations, figure 4 shows food stamp caseloads per capita by year relative to start year (the case- load data are available only by year). The figure separately plots caseloads for counties beginning operations in the first half versus second half of the caseload reporting year. This TABLE 3.—IMPACTS OF FSP INTRODUCTION ON INFANT OUTCOMES, BY GEOGRAPHY (1) (2) (3) (4) (5) (6) (7) (8) South Non-South Urban Counties Nonurban Counties Birth Weight LBW Birth Weight LBW Birth Weight LBW Birth Weight LBW A: Whites Avearage FSP (0/1) 2.403 �0.0011 1.771 �0.0003 2.364 �0.0008 0.508 �0.0002 (1.612) (0.0005)** (1.322) (0.0004) (1.247)* (0.0004)** (1.615) (0.0006) % impact (coef/mean) 0.07% �1.57% 0.05% �0.48% 0.07% �1.13% 0.02% �0.25% Observations 44,194 44,194 53,591 53,591 32,282 32,282 65,503 65,503 Subsample population 0.29 0.29 0.69 0.69 0.73 0.73 0.25 0.25 B: Blacks Average FSP (0/1) 3.527 �0.0023 7.003 �0.0009 8.371 �0.0034 �0.745 0.0023 (3.134) (0.0014)* (3.992)* (0.0022) (2.846)** (0.0013)** (5.219) (0.0023) % impact (coef/mean) 0.11% �1.76% 0.23% �0.69% 0.27% �2.59% �0.02% 1.74% Observations 20,837 20,837 6,537 6,537 13,090 13,090 14,284 14,284 Subsample population 0.49 0.49 0.45
  • 20. 0.45 0.77 0.77 0.17 0.17 1960 CCDB � linear time X X X X X X X X REIS controls X X X X X X X X County per capita real income X X X X X X X X Year � quarter fixed effects X X X X X X X X County fixed effects X X X X X X X X State � year fixed effects X X X X X X X X Each parameter is from a separate regression of the outcome variable on the food stamp implementation dummy. The treatment is assigned as of the three months prior to birth. The estimation sample includes means by county-quarter for years including 1968–1977 where cells with fewer than 25 births are dropped. Controls include county, year � quarter and state � year fixed effects, 1960 county variables (log of popula- tion, percentage of land in farming, percentage of population black, urban, under age 5, over age 65, and with income less than $3,000), each interacted with a linear time trend, per capita county transfer income (public assistance, medical care, and retirement and disability benefits), and county real per capita income. Estimates are weighted using the number of births in the cell and are clustered on county. Standard errors are in parentheses. Inflated impacts divide the parameter estimate by an estimate of the food stamp participation rate for the regression sample. Subsample population reports the percentage of total births that are included in the regression. Urban counties are defined as those with greater than 50% of the 1960 population living in an urban area. 27 We define the county as urban if more than 50% of the 1960 popula- tion in the county lives in an urban area. 28 Note that the reduction in the magnitude of the birth-weight impact may explain the difference between our results and those of Currie and Moretti (2008). Their study of birth outcomes in California assigned the FSP treatment nine months prior to birth and found comparatively limited impacts on birth weight. Another explanation for larger effects in the third trimester is if initial FSP participation is concentrated there (rather than earlier). 397INSIDE THE WAR ON POVERTY figure suggests that rapid ramp-up was achieved and that the ramp-up is only slightly faster in the counties with more lead time (implementation earlier in the year). Further, note that over half of the ‘‘steady-state’’ caseload is achieved in the first year, even for counties that begin operation late in the reporting year. TABLE 4.—SENSITIVITY OF BIRTH WEIGHT OUTCOMES TO CHANGING THE TIMING OF THE POLICY INTRODUCTION (1) (2) (3) (4) (5) Main Policy Effect: FSP—Beginning of Third Trimester FSP—Beginning of Second Trimester FSP—Beginning of First Trimester
  • 21. FSP—Beginning of Third Trimester FSP—Beginning of Third Trimester Second Policy Effect: – – – FSP—Beginning of Second Trimester FSP—Beginning of First Trimester A: Whites Average FSP (0/1) 2.085 1.696 1.288 2.556 2.434 (1.020)** (1.024)* (0.993) (1.640) (1.268)* Average FSP (0/1) – – – �0.533 �0.454 Second policy variable (1.650) (1.232) Observations 97,785 97,785 97,785 97,785 97,785 R2 0.55 0.55 0.55 0.55 0.55 Mean of dependent variable 3,350 3,350 3,350 3,350 3,350 B: Blacks Average FSP (0/1) 5.447 4.704 2.071 5.334 8.108 (2.532)** (2.464)* (2.396) (4.596) (3.444)** Average FSP (0/1) – – – 0.130 �3.515 Second policy variable (4.450) (3.268) Observations 27,374 27,374 27,374 27,374 27,374 R2 0.34 0.34 0.34 0.34 0.34 Mean of dependent variable 3,097 3,097 3,097 3,097 3,097 1960 CCDB � linear time X X X X X REIS controls X X X X X County per capita real income X X X X X Year � quarter fixed effects X X X X X County fixed effects X X X X X State � year fixed effects X X X X X Dependent variable is equal to birth weight in grams. Each parameter is from a separate regression of the outcome variable on the food stamp implementation dummy. The specifications vary by changing the tim- ing of food stamp implementation. Base case is in column 1, where the timing is as of three months prior to the birth (to proxy for beginning of the third trimester). The alternative specifications include timing as of six months (second trimester) or nine months (first trimester) prior to birth. In specifications 4, we estimate jointly the treatment effects at the third and second trimesters, and in column 5, we estimate jointly the impacts measured at the third and first trimesters. All of the other control variables and sample definitions are described in the notes to table 1. FIGURE 4.—PERCENTAGE OF COUNTY POPULATION ON FOOD STAMPS BY NUMBER OF YEARS SINCE PROGRAM START The graph is an unweighted regression of county-year food stamp caseloads on a series of dummy variables tracking year relative to county FSP implementation year. County caseload is expressed as a share of the 1960 population. Source for caseload data is USDA (various years). 398 THE REVIEW OF ECONOMICS AND STATISTICS C. Event Study The pattern of estimates in table 4 suggests that the FSP treatment effect is identified by the discrete jump in FSP at implementation and its impact on birth weight. In particu- lar, we
  • 22. showed in table 4 that as the timing of the treatment is shifted earlier in pregnancy, the estimated FSP effect on birth weight decreased substantially in magnitude. If instead identification were coming from some other trends in county outcomes that are correlated with FSP start month, then we would expect less sensitivity in the results to the trimester to which the FSP treatment is assigned. However, there remains a concern that our results are driven by trends in county birth outcomes that are correlated with FSP implementation in a way that county linear trends do not capture. This proposition can be evaluated more directly in an event study analysis. Specifically, we fit the following equa- tion, Yct ¼ aþ X8 i¼�6 pi1ðsct ¼ iÞ þ gc þ dt þcXct þ /c � tþ ect; ð2Þ where sct denotes the event quarter, defined so that s ¼ 0 for births that occur in the same quarter as the FSP began operation in that county, s ¼ 1 for births one quarter after the FSP began operation, and so on. For s � � 1, pregnan- cies were untreated by a local program (births were before the program started). The coefficients are measured relative to the omitted coefficient (s ¼ �2).29 Our event study model includes fixed effects for county and time, county REIS variables, and county-specific linear time trends. In order to eliminate potential compositional effects, we restrict the sample to a balanced panel of counties having births for all fifteen event quarters: six quarters before implementation and eight quarters after. Because our natal- ity data begin with January 1968, this means we exclude from the event study analysis all counties with an FSP before July 1969. Figure 5 plots the event and quarter coefficients from estimating equation (2) on the fraction of low-birth-weight births. The figure also reports the number of county and quarter observations in the balanced sample and the differ- ence-in-difference estimate on this sample.30 Panel A reports estimates for blacks and panel B for whites. These figures show an absence of a strong pretrend and evidence of a trend break at the quarter the FSP is introduced, imply- ing an improvement in infant outcomes. That such a prompt increase in birth weight is observed with FSP inception indicates that potential confounders would have to mimic the timing of FSP rollout extremely closely. Not shown here, the event study results are nearly identical if we exclude the county controls, providing further evidence of the exogeneity of the treatment. We view this as more evi- dence of the validity of our identification strategy.31 D. Further Robustness Checks
  • 23. The main results are robust to various additional specifi- cation checks. One potential concern is that the FSP intro- duction is correlated with unobserved county health invest- ments (such as the expansion of access to hospitals in the South as in Almond, Chay, and Greenstone 2007) and our REIS controls fail to pick this up. To test this, we use the natality data to estimate the impact of FSP implementation on the fraction of births in a hospital or attended by a physi- cian. These results indicate very small and statistically insignificant improvements with FSP implementation (online appendix table 7). Finally, the same forces that improve infant health could also lead to greater survival of low- birth-weight fetuses. In addition, the FSP may lead to increased fertility among dis- advantaged women (if children are a normal good). Both factors, through endogeneous sample selection, could bias the estimates downward. We consider this by evaluating whether FSP introduction is associated with any change in live births. The dependent variable is the number of births in the race, county, and quarter divided by the number of women aged 15 to 44, and the regressions are weighted by the population of women in each cell. Table 5 presents sev- eral estimates, which vary depending on the timing of the FSP treatment: between three quarters prior to birth (proxy for conception) and seven quarters prior to birth (one year prior to conception). Across the table, we find positive but very small and statistically insignificant effects of FSP on births. When these point estimates are inflated by the FSP participation rate, the estimate of the treatment on the trea- ted is about 1% for whites and 2% for blacks. When we stratify the results by quartiles of county poverty rates, we also find small and statistically insignificant impacts among those living in the highest poverty counties (online appen- dix table 8). VIII. Mortality Results Table 6 shows the main results for neonatal mortality rate for 1968 to 1977. We present three outcomes: death rate for all causes, deaths possibly due to nutritional deficiencies, 29 Because of the discrete nature of the event study model, the s’s are formed by aggregating months to a quarter. For example, if the FSP started (or birth occurred) in January, February, or March 1970, then the FSP started (or birth occurred) in 1970 quarter 1. Therefore when s ¼ 0 (birth quarter ¼ policy commencement quarter), the pregnancy could actually have been treated for between zero and three months. 30 The difference-in-difference estimate is comparable to the results pre- sented in table 1. We present them here because the samples used for the event study differ from the main results (due to balancing of the sample). 31 Similar patterns are observed when the dependent variable is average birth weight (online appendix figure 2) and the share of births below 1,500 grams (available on request). 399INSIDE THE WAR ON POVERTY and other deaths (for definition see the data section and online appendix table 2). Because neonatal deaths are thought to be related primarily to prenatal conditions (parti- cularly prior to major technological advances in neonatal care in the 1970s and 1980s), we time the FSP
  • 24. treatment as of a quarter prior to birth (to proxy for the beginning of the third trimester). In these models, we drop any race-county- quarter cell where there are fewer than fifty births. Results are weighted by the number of births in the cell. The neonatal mortality rate averages about twelve deaths per 1,000 births for whites and nineteen for blacks, with about half of the deaths where the cause of death indicates those possibly affected by nutritional deficiencies. The results for whites and blacks show that the FSP leads to a reduction in infant mortality, with larger impacts for deaths possibly affected by nutritional deficiencies. None of the estimates, however, are statistically significant. Overall, the effect of the treatment on the treated (percentage impact, FIGURE 5.—EFFECTS OF FSP IMPLEMENTATION ON LOW BIRTH WEIGHT: RESULTS FOR EVENT STUDY ANALYSIS Each figure plots coefficients from an event-study analysis. Coefficients are defined as quarters relative to the quarter the FSP is implemented in the county. The sample is a balanced county sample, where a county is included only if there are six quarters of pre- and eight quarters of post-implementation data. The specification includes controls for county, county � linear time, quarter, 1960 county controls interacted with time, county per capita transfers, and county real per capita income. The ‘‘diff-in-diff treatment effect’’ is comparable to the results presented in table 1. We present them here because the samples used for the event study differ from the main results. 400 THE REVIEW OF ECONOMICS AND STATISTICS inflated) for all causes is about 4% for whites and between 4% and 8% for blacks. These estimates are roughly in line with the birth weight–neonatal mortality rate relationship estimated by Almond et al. (2005): for whites, we estimate a very similar birth weight-mortality relationship, although the relationship between birth weight and mortality we esti- mate for blacks is substantially stronger than in Almond et al. (2005). Finally, we view the results for ‘‘other deaths’’ TABLE 6.—IMPACT OF FSP ON NEONATAL MORTALITY RATE (DEATHS PER 1,000 LIVE BIRTHS) (1) (2) (3) (4) (5) (6) (7) (8) (9) All Deaths Deaths Linked to Nutrition Other Deaths A: Whites Average FSP (0/1) �0.0625 �0.0158 �0.0806 �0.0492 �0.0784 �0.0376 �0.0133 0.0626 �0.0430 (0.1050) (0.1194) (0.1242) (0.0771) (0.0839) (0.0913) (0.0834) (0.0936) (0.0960) % impact (coef / mean) �0.52% �0.13% �0.67% �0.79% �1.25% �0.60% �0.23% 1.09% �0.75% % impact, inflated �4.01% �1.01% �5.17% �6.04% �9.63% �4.62%
  • 25. �1.79% 8.39% �5.76% Observations 73,577 73,577 73,676 73,577 73,577 73,676 73,577 73,577 73,676 R2 0.16 0.16 0.18 0.10 0.11 0.13 0.12 0.12 0.15 Mean of dependent variable 12.00 12.00 12.00 6.26 6.26 6.26 5.74 5.74 5.74 B: Blacks Average FSP (0/1) �0.3898 �0.0067 �0.6551 �0.4128 �0.3098 �0.4233 0.0231 0.3032 �0.2317 (0.4095) (0.4610) (0.4793) (0.2865) (0.2953) (0.3334) (0.2729) (0.3348) (0.2977) % impact (coef / mean) �2.06% �0.04% �3.46% �4.58% �3.43% �4.69% 0.23% 3.06% �2.34% % impact, inflated �4.47% �0.08% �7.52% �9.95% �7.47% �10.20% 0.51% 6.65% �5.08% Observations 17,655 17,655 17,695 17,655 17,655 17,695 17,655 17,655 17,695 R2 0.42 0.44 0.43 0.34 0.36 0.36 0.26 0.29 0.28 Mean of dependent variable 18.94 18.94 18.94 9.02 9.02 9.02 9.91 9.91 9.91 1960 CCDB � linear time X X X X X X REIS controls X X X X X X X X X County per capita real income X X X X X X X X X Year � quarter fixed effects X X X X X X X X X County fixed effects X X X X X X X X X State � linear time X X X State � year fixed effects X X X County � linear time X X X Each parameter is from a separate regression of the neonatal mortality rate (deaths in first 28 days per 1,000 live births) on the FS implementation. The treatment is assigned as of three months prior to birth (proxy for beginning of the third trimester). The sample includes means by race-county-quarter for years including 1968–1977 where cells with fewer than fifty births are dropped. In addition to the fixed effects, controls include 1960 county variables (log of population, percentage of land in farming, percentage of population black, urban, below age 5, over age 65, and with income less than $3,000), each interacted with a linear time trend, per capita county transfer income (public assistance, medical care, and retirement and disability benefits), and county real per capita income. Estimates are weighted using the number of births in the cell and are clustered on county. Standard errors are in parentheses. Inflated impacts divide the parameter estimate by an estimate of the food stamp participation rate for the regression sample. TABLE 5.—IMPACT OF FSP INTRODUCTION ON FERTILITY RATE (BIRTHS PER 1,000 WOMEN AGES 15–44) (1) (2) (3) (4) (5) FSP Implemented as of X Quarters prior to Birth 3 Quarters 4 Quarters 5 Quarters 6 Quarters 7 Quarters A: Whites Average FSP (0/1) 0.013 �0.004 0.007 0.031 0.035 (0.078) (0.074) (0.071) (0.074) (0.070) % impact (coef/mean) 0.06% �0.02% 0.04% 0.16% 0.18% % impact, inflated 0.50% �0.14% 0.28% 1.22% 1.40% Observations 120,293 120,293 120,293 120,293 120,293 Mean of dependent variable 19.40 19.40 19.40 19.40 19.40 B: Blacks Average FSP (0/1) 0.211 0.157 0.276 0.307 0.227
  • 26. (0.221) (0.206) (0.193) (0.190) (0.183) % impact (coef/mean) 0.80% 0.60% 1.05% 1.17% 0.86% % impact, inflated 1.75% 1.30% 2.29% 2.54% 1.88% Observations 44,044 44,044 44,044 44,044 44,044 Mean of dependent variable 26.24 26.24 26.24 26.24 26.24 1960 CCDB � linear time X X X X X REIS controls X X X X X County per capita real income X X X X X Year � quarter fixed effects X X X X X County fixed effects X X X X X State � year fixed effects X X X X X Each parameter is from a separate regression of the outcome variable on the food stamp implementation dummy. The columns vary by the timing of the FSP implementation. The estimation sample includes means by race-county-quarter for 1968–1977. Controls include county, year-by-quarter and state-by-year fixed effects, 1960 county variables (log of population, percentage of land in farming, percentage of population black, urban, under age 5, over age 65, and income less than $3,000), each interacted with a linear time trend, per capita county transfer income (public assistance, medical care, and retirement and disability benefits), and county real per capita income. Estimates are weighted using the population in the cell and are clustered on county. Standard errors are in parentheses. Inflated impacts divide the parameter estimate by an estimate of the food stamp participation rate for the regression sample. 401INSIDE THE WAR ON POVERTY (not affected by nutritional deficiencies), which are opposite signed and much smaller in magnitude (although again sta- tistically significant), as favorable evidence that the mortal- ity estimates are coming from the FSP. Online appendix table 9 separates the mortality effects by quartiles of the county poverty rate, and while imprecisely estimated finds a negative effect in the highest-poverty counties but a posi- tive one in the lowest-poverty counties that were unlikely to experience a substantial FSP treatment. Online appendix table 10 presents results for all races for the full period from 1959. We are unable to present results by race here because the denominator (live births by county and time) is not available by race prior to 1968. The first three columns replicate the results in table 6 for 1968 to 1977 for all races. In the subsequent columns (for 1959– 1977 and 1964–1977), we find results very similar to those for 1968 to 1977. Overall, FSP implementation leads to a reduction in neonatal mortality, although not statistically significantly so. IX. Interpretation and Conclusion The uniformity of the FSP was designed to buffer the dis- cretion states exercised in setting rules and benefit levels of other antipoverty programs. This uniformity was deliber- ately preserved through the major reforms to welfare under the 1996 Personal Responsibility and Work Opportunity Reconciliation Act (Currie, 2003). An unintended conse- quence of this regularity has been to circumscribe the pol- icy variation that researchers typically use to identify pro- gram impacts. As a result, surprisingly little is known about FSP effects. In contrast to other major U.S. antipoverty programs, the FSP was rolled out county by county. This feature of imple- mentation allows us to separate the introduction of food stamps from the other major policy changes of the late 1960s and early 1970s. Although FSP benefits were (and
  • 27. are) paid in vouchers that themselves could be used only to purchase food, because the voucher typically represented less than households spent on food (covering just the ‘‘thrifty food plan’’), recipients were inframarginal and ben- efits were essentially a cash transfer (Hoynes & Schanzen- bach, 2009). Across the board, our point estimates show that this near- cash transfer improved infant outcomes. In particular, we find increases in mean birth weight for whites and blacks, with larger impacts estimated at the bottom of the birth weight distribution (that is, low birth weight and very low birth weight). Consistent with expectations, we find larger birth weight effects for black mothers and those living in high-poverty areas—populations where FSP participation is more common. Consistent with epidemiological studies, FSP availability in the third trimester had the largest birth weight impact. We conclude that despite not targeting preg- nant women, the introduction of the FSP increased birth weight. This finding is all the more noteworthy given the mixed success that randomized interventions have had in raising birth weights (Rush, Stein, & Susser, 1980; Lumley & Donohue, 2006). While the point estimates for gestation length and neona- tal mortality would also suggest improved health at birth, estimated effects are imprecise, despite the large samples from vital statistics data. One interpretation is that statistical power is lost when analyzing gestation length (incomplete reporting by states) and mortality (rare). Leaving the impre- cision issue aside, gestation length and mortality appear less affected than the likelihood of low and very low birth weight. At a minimum, our results indicate that the FSP had an immediate first-stage impact on newborns. Furthermore, these estimated impacts (as reflected by birth weight) are much larger in high-poverty counties. Our findings reveal that an exogenous increase in income during a well- defined period, pregnancy, can improve infant health. Future work should consider whether this FSP-induced birth weight improvement is reflected in subsequent outcomes and how poverty and birth weight may mediate this relationship. REFERENCES Acemoglu, Daron, David Autor, and David Lyle, ‘‘Women, War and Wages: The Impact of Female Labor Supply on the Wage Struc- ture at Mid-Century,’’ Journal of Political Economy, 112 (2004), 497–551. Almond, Douglas, Kenneth Y. Chay, and Michael Greenstone, ‘‘Civil Rights, the War on Poverty, and Black-White Convergence in Infant Mortality in the Rural South and Mississippi,’’ MIT Depart- ment of Economics working paper no. 07–04: (2007). Almond, Douglas, Kenneth Y. Chay, and David S. Lee, ‘‘The Costs of Low Birth Weight,’’ Quarterly Journal of Economics, 120 (2005), 1031–1084.
  • 28. Baker, Kevin, ‘‘Do Cash Transfer Programs Improve Infant Health: Evi- dence from the 1993 Expansion of the Earned Income Tax Credit,’’ manuscript, University of Notre Dame (2008). Barker, D.J.P., Fetal and Infant Origins of Adult Disease (London: British Medical Journal, 1992). Bastiotis, P., C. S. Cramer-LeBlanc, and E. T. Kennedy, ‘‘Maintaining Nutritional Security and Diet Quality: The Role of the Food Stamp Program and WIC,’’ Family Economics and Nutritional Review, 11 (1998), 4–16. Berry, Jeffrey M., Feeding Hungry People: Rulemaking in the Food Stamp Program (New Brunswick, NJ: Rutgers University Press, 1984). Black, Sandra E., Paul J. Devereux, and Kjell G. Salvanes, ‘‘From the Cradle to the Labor Market? The Effect of Birth Weight on Adult Outcomes,’’ Quarterly Journal of Economics 122 (2007), 409– 439. Blank, Rebecca, ‘‘Evaluating Welfare Reform in the United States,’’ Jour- nal of Economic Literature 40 (2002), 1105–1166. Butler, J. S., and J. E. Raymond, ‘‘The Effect of the Food Stamp Program on Nutrient Intake,’’ Economic Inquiry 34 (1996), 781–798. Citizens’ Board of Inquiry into Hunger and Malnutrition in the United States, Hunger, U.S.A. (Boston: Beacon Press, 1968). Cramer, James, ‘‘Racial and Ethnic Differences in Birth Weight: The Role of Income and Financial Assistance,’’ Demography 32 (1995), 231–247. Currie, Janet, ‘‘Food and Nutrition Programs,’’ in Robert Moffitt (Ed.), Means- Tested Transfer Programs in the U.S. (Cambridge, MA: NBER, 2003). ——— ‘‘Healthy, Wealthy, and Wise: Socioeconomic Status, Poor Health in Childhood, and Human Capital Development,’’ Journal of Economic Literature 47 (2009), 87–122. 402 THE REVIEW OF ECONOMICS AND STATISTICS Currie, Janet, and Nancy Cole, ‘‘Does Participation in Transfer Programs during Pregnancy Improve Birth Weight?’’ NBER working paper no. 3832 (1991). ——— ‘‘Welfare and Child Health: The Link between AFDC Participa- tion and Birth Weight,’’ American Economic Review 83 (1993), 971–985.
  • 29. Currie, Janet, Enrico Moretti, ‘‘Did the Introduction of Food Stamps Affect Birth Outcomes in California?’’ in R. Schoeni, J. House, G. Kaplan, and H. Pollack, (Eds.), Making Americans Healthier: Social and Economic Policy as Health Policy, (New York: Russell Sage Press, 2008). Duflo, Esther, ‘‘Schooling and Labor Market Consequences of School Construction in Indonesia: Evidence from an Unusual Policy Experiment,’’ American Economic Review 91 (2001), 795–813. Fenton, Tanis, ‘‘A New Growth Chart for Preterm Babies: Babson and Benda’s Chart Updated with Recent Data and a New Format,’’ BMC Pediatrics 3:13 (2003), http://www.biomedcentral.com/1471¼2431/3/13. Fraker, Thomas, ‘‘Effects of Food Stamps on Food Consumption: A Review of the Literature’’ (Washington, DC: Mathematica Policy Research, 1990). Grossman, Michael, and Steven Jacobowitz, ‘‘Variations in Infant Mortal- ity Rates among Counties of the United States: The Roles of Public Policies and Programs,’’ Demography 18 (1981), 695–713. Hoynes, Hilary W., and Diane Whitmore Schanzenbach, ‘‘Consumption Responses to In- Kind Transfers: Evidence from the Introduction of the Food Stamp Program,’’ American Economic Journal: Applied Economics 1 (2009), 109–139. Kehrer, Barbara H., and Charles M. Wolin, ‘‘Impact of Income Mainte- nance on Low Birth Weight: Evidence from the Gary Experi- ment,’’ Journal of Human Resources 14 (1979), 434–462. Kramer, Michael S., ‘‘Intrauterine Growth and Gestational Determi- nants,’’ Pediatrics 80 (1987a), 502–511. ——— ‘‘Determinants of Low Birth Weight: Methodological Assessment and Meta- Analysis,’’ Bulletin of the World Health Organization 65 (1987b), 633–737. Lumley, Judith, and Lisa Donohue, ‘‘Aiming to Increase Birth Weight: A Randomised Trial of Pre-Pregnancy Information, Advice and Counseling in Inner-Urban Melbourne,’’ BMC Public Health 6:299 (2006), http://www.biomedcentral.com/1471¼2458/6/299. MacDonald, Maurice, Food, Stamps, and Income Maintenance (Madison, WI: Institute for Poverty Research, 1977). Mathews, Fiona, Paul J. Johnson, and Andrew Neil, ‘‘You Are What Your Mother Eats: Evidence for Maternal Preconception Diet Influen- cing Foetal Sex in Humans,’’ Proceedings of the Royal Society 275 (2008), 1661–1668.
  • 30. Moffitt, Robert, ‘‘Incentive Effects of the US Welfare System,’’ Journal of Economic Literature, 30 (1992), 1–61. ——— ‘‘The Effect of Welfare on Marriage and Fertility,’’ in Robert Moffitt (Ed.), Welfare, the Family, and Reproductive Behavior, (Washington, DC: National Research Council, 1998). Painter, Rebecca C., Tessa J. Rosebooma, and Otto P. Bleker, ‘‘Prenatal Exposure to the Dutch Famine and Disease in Later Life: An Over- view,’’ Reproductive Toxicology 20 (2005), 345–352. Ripley, Randall B., ‘‘Legislative Bargaining and the Food Stamp Act, 1964,’’ in Frederick N. Cleaveland, (Ed.), Congress and Urban Problems: A Casebook on the Legislative Process (Washington, DC: Brooking Institution, 1969). Rush, David, Zena Stein, and Mervyn Susser, Diet in Pregnancy: A Ran- domized Controlled Trial of Nutritional Supplements (New York: Alan R. Liss, 1980). Starfield, Barbara, ‘‘Postneonatal Mortality,’’ Annual Review of Public Health 6 (1985), 21–40. U.S. Congressional Budget Office, ‘‘The Food Stamp Program: Income or Food Supplementation?’’ (Washington, DC: U.S. Government Printing Office, 1977). U.S. Department of Agriculture, ‘‘Food Stamp Program, Year-End Parti- cipation and Bonus Coupons Issues,’’ technical report, Food and Nutrition Service, (various years). U.S. Department of Health, Education and Welfare, ‘‘Vital Statistics of the United States, Volume I’’ (1959–1967). 403INSIDE THE WAR ON POVERTY Copyright of Review of Economics & Statistics is the property of MIT Press and its content may not be copied or emailed to multiple sites or posted to a listserv without the copyright holder's express written permission. However, users may print, download, or email articles for individual use. Copyright © 2018 by Elsevier Inc. All rights reserved. Pagana: Mosby’s Manual of Diagnostic and Laboratory Tests, 6th Edition AIDS (Acquired Immunodeficiency Syndrome)
  • 31. Case Studies The patient, a 30-year-old homosexual man, complained of unexplained weight loss, chronic diarrhea, and respiratory congestion during the past 6 months. Physical examination revealed right-sided pneumonitis. The following studies were performed: Studies Results Complete blood cell count (CBC), p. 156 Hemoglobin (Hgb), p. 251 12 g/dL (normal: 14–18 g/dL) Hematocrit (Hct), p. 248 36% (normal: 42%–52%) Chest x-ray, p. 956 Right-sided consolidation affecting the posterior lower lung Bronchoscopy, p. 526 No tumor seen Lung biopsy, p. 688 Pneumocystis jiroveci pneumonia (PCP) Stool culture, p. 797 Cryptosporidium muris Acquired immunodeficiency syndrome (AIDS) serology, p. 265 p24 antigen Positive Enzyme-linked immunosorbent assay (ELISA) Positive Western blot Positive Lymphocyte immunophenotyping, p. 274 Total CD4 280 (normal: 600–1500 cells/L) CD4% 18% (normal: 60%–75%)
  • 32. CD4/CD8 ratio 0.58 (normal: >1.0) Human immune deficiency virus (HIV) viral load, p. 265 75,000 copies/mL Diagnostic Analysis The detection of Pneumocystis jiroveci pneumonia (PCP) supports the diagnosis of AIDS. PCP is an opportunistic infection occurring only in immunocompromised patients and is the most common infection in persons with AIDS. The patient’s diarrhea was caused by Cryptosporidium muris, an enteric pathogen, which occurs frequently with AIDS and can be identified on a stool culture. The AIDS serology tests made the diagnoses. His viral load is significant, and his prognosis is poor. The patient was hospitalized for a short time for treatment of PCP. Several months after he was discharged, he developed Kaposi sarcoma. He developed psychoneurologic problems eventually and died 18 months after the AIDS diagnosis. Case Studies Copyright © 2018 by Elsevier Inc. All rights reserved. 2 Critical Thinking Questions 1. What is the relationship between levels of CD4 lymphocytes and the likelihood of clinical complications from AIDS? 2. Why does the United States Public Health Service recommend monitoring CD4 counts every 3–6 months in patients infected with HIV?
  • 33. 3. This is patient seems to be unaware of his diagnosis of HIV/AIDS. How would you approach to your patient to inform about his diagnosis? 4. Is this a reportable disease in Florida? If yes. What is your responsibility as a provider? . Copyright © 2018 by Elsevier Inc. All rights reserved. Pagana: Mosby’s Manual of Diagnostic and Laboratory Tests, 6th Edition Iron-Deficiency Anemia Case Study A 72-year-old man developed chest pain whenever he was physically active. The pain ceased on stopping his activity. He has no history of heart or lung disease. His physical examination was normal except for notable pallor. Studies Result Electrocardiogram (EKG), p. 485 Ischemia noted in anterior leads Chest x-ray study, p. 956 No active disease Complete blood count (CBC), p. 156 Red blood cell (RBC) count, p. 396 2.1 million/mm (normal: 4.7–6.1 million/mm) RBC indices, p. 399 Mean corpuscular volume (MCV)
  • 34. 72 mm 3 (normal: 80–95 mm 3 ) Mean corpuscular hemoglobin (MCH) 22 pg (normal: 27–31 pg) Mean corpuscular hemoglobin concentration (MCHC) 21 pg (normal: 27–31 pg) Red blood cell distribution width (RDW) 9% (normal: 11%–14.5%) Hemoglobin (Hgb), p. 251 5.4 g/dL (normal: 14–18 g/dL) Hematocrit (Hct), p. 248 18% (normal: 42%–52%) White blood cell (WBC) count, p. 466 7800/mm 3 (normal: 4,500–10,000/mcL) WBC differential count, p. 466 Normal differential Platelet count (thrombocyte count), p. 362 Within normal limits (WNL) (normal: 150,000– 400,000/mm 3 ) Half-life of RBC 26–30 days (normal) Liver/spleen ratio, p. 750 1:1 (normal)
  • 35. Spleen/pericardium ratio <2:1 (normal) Reticulocyte count, p. 407 3.0% (normal: 0.5%–2.0%) Haptoglobin, p. 245 122 mg/dL (normal: 100–150 mg/dL) Blood typing, p. 114 O+ Iron level studies, p. 287 Iron 42 (normal: 65–175 mcg/dL) Total iron-binding capacity (TIBC) 500 (normal: 250–420 mcg/dL) Transferrin (siderophilin) 200 mg/dL (normal: 215–365 mg/dL) Transferrin saturation 15% (normal: 20%–50%) Case Studies Copyright © 2018 by Elsevier Inc. All rights reserved. 2 Ferritin, p. 211 8 ng/mL (normal: 12–300 ng/mL) Vitamin B12, p. 460 140 pg/mL (normal: 100–700 pg/mL) Folic acid, p. 218 12 mg/mL (normal: 5–20 mg/mL or 14–34 mmol/L) Diagnostic Analysis The patient was found to be significantly anemic. His angina was related to his anemia. His normal RBC survival studies and normal haptoglobin eliminated the possibility of hemolysis.. His RBCs were small and hypochromic. His iron studies were compatible with iron deficiency. His marrow was inadequate for the degree of anemia because his iron level was reduced. On transfusion of O-positive blood, his angina disappeared. While receiving his third unit of
  • 36. packed RBCs, he developed an elevated temperature to 38.5°C, muscle aches, and back pain. The transfusion was stopped, and the following studies were performed: Studies Results Hgb, p. 251 7.6 g/dL Hct, p. 248 24% Direct Coombs test, p. 157 Positive; agglutination (normal: negative) Platelet count, p. 362 85,000/mm 3 Platelet antibody, p. 360 Positive (normal: negative) Haptoglobin, p. 245 78 mg/dL Diagnostic Analysis The patient was experiencing a blood transfusion incompatibility reaction. His direct Coombs test and haptoglobin studies indicated some hemolysis because of the reaction. His platelet count dropped because of antiplatelet antibodies, probably the same ABO antibodies that caused the RBC reaction. He was given iron orally over the next 3 weeks, and his Hgb level improved. A rectal examination indicated that his stool was positive for occult blood. Colonoscopy indicated a right- side colon cancer, which was removed 4 weeks after his initial presentation. He tolerated the surgery well. Critical Thinking Questions 1. What was the cause of this patient's iron-deficiency anemia? 2. Explain the relationship between anemia and angina. 3. Would your recommend B12 and Folic Acid to this patient? Explain your rationale for the answer
  • 37. 4. What other questions would you ask to this patient and what would be your rationale for them?