1. 1
7p. Mapping of Parental& Cultural Influences on Obesity (culturally
different program in New Brunswick ): Amanda, Kaitlyn, Emeka,
Rafferty, Kaitlyn
(845) 699-5762 kaitlynr@eden.rutgers.edu kaitlynrafferty713@gmail.com
Richards, Amanda
(909) 373-7887 adr82@eden.rutgers.edu amandarichards212@gmail.com
danyamalka0601@aol.com
Anene Emeka
(609) 553-5657, eanene@eden.rutgers.edu, EDAsports333@gmail.com,
EDAsports333@yahoo.com
The Government’s Food Stamp Program is responsible, in
part, for the Obesity Epidemic in the US
Relationship Between Childhood Obesity and Families Receiving SNAP
Benefits and the Purchase of “Empty Calorie Non-Foods”
Tag Words: Childhood Obesity; Body-Mass Index (BMI); Food Stamps; Supplemental
Nutrition Assistance Program (SNAP); Food Insecurity; Junk Food; Cultural Influences; United
States Department of Agriculture (USDA)
Authors: Emeka D. Anene, Kaitlyn M. Rafferty, and Amanda D. Richards with Julie M. Fagan,
Ph.D
Summary
There is a strong correlation among families who receive SNAP benefits from the U.S.
government and obesity among children, particularly minority children. Part of this is due to the
fact that unhealthy food items such as soda, candy, cookies, bakery cakes, and ice cream can be
purchased with SNAP benefits under The Food and Nutrition Act of 2008. There are other
factors which influence this correlation, which will be explored, such as lack of exercise and
cultural influences. We suggest making unhealthy food items ineligible for SNAP and
encouraging SNAP recipients to find healthier alternatives for unhealthy ingredients (butter, lard,
etc.). Our project will be mailed to an important person in the recent movement to reduce levels
of childhood obesity, the First Lady, Michelle Obama, in an attempt to make the changes a
reality. We also will petition the USDA using the Freedom of Information Act to release the data
about the amount of SNAP funds used to buy junk foods like soda, candy, and cookies.
Video Link: http://youtu.be/WFiRrp1f-Bg
2. 2
The Connection between Obesity and Food Stamps
Obesity as a problem (AR)
Obesity began as an exponentially growing epidemic in the United States, with percentages of
prevalence among the entire population doubling and tripling within the last fifty years, but now,
being overweight or obese has become the American cultural norm. Obesity is defined as an
excess of body fat and is classified by a body-mass index (BMI) of thirty or higher. There are
multiple factors that can cause obesity including genetic predisposition, learned habits
(overeating or eating unhealthily and under exercising), environmental factors (cultural factors
and socioeconomic status), and psychological factors. Not surprisingly, obesity can lead to a
multitude of dangerous health effects such as heart disease, type 2 diabetes, high blood pressure,
dyslipidemia, certain types of cancer, stroke, sleep apnea or other breathing problems,
osteoarthritis, and liver and gallbladder disease (1). Obesity is dangerous, yet rates continue to
climb year after year, with no signs of slowing.
In a roughly fifty year period, from 1960 to 2008, the percentage of obese Americans nearly
tripled from 13.3% to an astonishing 34.7% (2), with the current adult obesity rate at 34.9% (3).
Among minorities, these levels are even higher: 47.8% of African-Americans and 42.5% of
Hispanics are obese (3). This exponential rise in obesity has been caused by multiple changes in
the American lifestyle including, but not limited to, an increase in processed food, and increase
in portion sizes, a shift toward a more sedentary lifestyle, the invention and widespread use of
electronics, and an extensive increase in fast food restaurant locations and availability. The
children’s obesity rate is equally startling--soaring from 7% to almost 18% among 6 to 11 year
olds and from 5% to 21% in 12 to 19 year olds, in a short thirty-two year period (4). The current
rate of obesity is even more dangerous and crippling in children partially because the likelihood
that they will remain obese into adulthood is between fifty and eighty percent, depending the age
of the child (5). In New Brunswick, the obesity rates are even more astounding. In every age
group, the number of obese New Brunswick children is greater than the national average.
Percentages of obese children ages 3-5 are 3x higher than the national average (29% vs. 10%),
ages 6-11 are nearly 10% greater (28% vs. 20%), and ages 12-18 are 7% greater (25% vs. 18%)
(6). Additionally, the vast majority of New Brunswick parents do not believe their children are
obese, and therefore, do little to help them achieve a healthier weight or live healthier lifestyles.
Oddly enough, families who are “food insecure” and receive food stamps have higher obesity
rates than the general population. In one study, SNAP was linked to a 2.2 kg/m2 increase in BMI
(7). Other studies found the obesity rate among SNAP children was 17.5%, compared to 14.9%
of nonparticipants (8) and among adults the percentage of obesity was 28.1% in SNAP
participants and 17.5% in non-participants (9).
Different kinds of food stamps (EA)
The various types of food stamps that can be utilized depend on the status of the individual.
There are currently four different kinds of these benefits: the Supplemental Nutrition Assistance
Program (SNAP), the Woman, Infants and Children program (WIC), the National School Lunch
Program, and the Senior Farmer’s Market Nutrition Program (10).
3. 3
Using SNAP, low-income families receive monthly benefits on an electronic benefits card, other
known as an Electronic Benefit Transfer (EBT) card. As of June 2009 paper food stamps or
coupons was terminated and this new system was conducted. This system allows customers to
purchase items at any participating grocery stores or venues of such eligible food products.
These benefits are distributed on a state and local level at local SNAP offices. This program also
may be allocated to those involved in the aftermath of a natural disaster.
The Woman, Infants and Children program (WIC) provides benefits to pregnant and postpartum
women, infants and children up to the age of 5 years old who are identified to be at nutritional
risk as well as meeting the income guidelines of the states WIC program. Checks or EBT cards
are administered to those involved on a monthly basis or are directly issued nutritional food
directly from the state agency. The WIC program also offers coupons to be used to purchase
fruits and vegetables at the local farmer’s market as part of the Farmer’s Market Nutrition
Program (11).
The National Lunch Program offers free and discounted lunch to those in low-income children.
They are distributed all throughout the school year as well as breakfasts and lunches during the
summers. The Fresh Fruit and Vegetable Program and the Special Milk program are other
Federal programs issued to public schools to provide low-income children with fresh fruits and
vegetables and milk at no cost at schools that are not participating in other Federal food
programs.
The Senior Farmer’s Market Nutrition Program is run much like the Women, Infants and
Children program. Coupons are issued to low-income seniors that are used to purchase eligible
food items at participating community supported agriculture programs and farmer’s markets. The
availability of these benefits varies by state and is only issued during the harvest season. The
coupons used in this program are administered to help improve the nutritional quality of foods
consumed by low-income seniors nationwide.
Women, Infants, Children: Why changes to WIC’s framework should influence SNAP
(KR)
The December 2007 Special Supplemental Nutrition Program for Women, Infants and Children
(WIC): Revisions in the WIC Food Packages; Interim Rule was the first major revision to the
program since the early 1980’s. It has been effective as of February 2008 with state agency
implementation of provisions occurring no later than August of 2009. This modified the WIC
program in several ways.
First of all, comments regarding the process of changing the WIC program were made publically
available, giving citizens the disclosure that is fair as their tax dollars are funding a government
implemented program (24). This transparency is something we would like to see happen with
SNAP. The WIC revisions also propose to limit state authority to categorize food products.
There is a focus on the availability of a wide array of fruits and vegetables and cultural-based
preferences, work with vendors to supply this (24).
The disallowance of white potatoes is one example of how WIC limits the consumption of
certain foods. The proposal also reduces the maximum amount of cheese purchased by WIC
participants, as well as reducing the allotment of juice in order to promote the intake of whole
4. 4
fruits instead. Whole grains are emphasized as well, and WIC specifies that bakery items must
contain whole wheat listed as the primary ingredient in order to be considered eligible (24).
While certainly WIC and SNAP are designed to supplement different demographics of people,
we do not see why revisions to SNAP cannot be made if WIC has implemented changes to
improve the structure of their program and better tailor itself to the needs of its participants. The
alterations made to WIC should serve as examples for SNAP to follow through with its own set
of amendments to improve the health of its participants.
Why did we focus on SNAP? (KR)
SNAP is the acronym for the Supplemental Nutrition Assistance Program. It was formerly
known as the Food Stamp Program. SNAP is used to cover basic groceries such as breads and
cereals, fruits and vegetables, meats, fish, poultry, dairy products, seeds and plants which
produce food. SNAP does not cover the costs of beer, wine, liquor, cigarettes or tobacco or any
nonfood items, such as pet foods, soaps, paper products, household supplies, vitamins and
medicines, or food that will be eaten in the store (12).
Our concern regarding SNAP is that it can also be used to purchase soft drinks, candy, cookies,
snack crackers, bakery cakes and ice cream because they are food items and are therefore also
eligible SNAP items (12). The consumption of these food items has been directly linked to
increased rates of obesity. Analysts assert that harnessing the data on SNAP food purchases is a
difficult, expensive and unwieldy task, largely because the food sellers categorize products
differently.
SNAP also targets extremely vulnerable demographics, such as low income families that often
include children, the elderly, or the disabled. In fact, 76% of SNAP households included a child,
an elderly person, or a disabled person. These households receive 83% of all SNAP benefits (13).
SNAP eligibility is also limited to households with gross income of no more than 130% of the
federal poverty guideline, but the majority of households have income well below the maximum.
83% of SNAP households have gross income at or below 100% of the poverty guideline
($19,530 for a family of 3 in 2013), and these households receive about 91% of all benefits. 61%
of SNAP households have gross income at or below 75% of the poverty guideline ($14,648 for a
family of 3 in 2013) (13).
The demand for food assistance is already greater than what SNAP can fill. SNAP benefits don’t
cover the cost of food for most participants for the whole month. 58% of food bank clients
currently receiving SNAP benefits turn to food banks for assistance at least 6 months out of the
year (13). With the average monthly SNAP benefit per person at $133.85, this translates to less
than $1.50 per person, per meal (13). Thus, SNAP participants are often disadvantaged members
of society who may not have access to the resources others of higher socioeconomic status may.
With the demand of food stamps rising, reliance on SNAP is increasing, along with the United
States obesity rate.
According to the FDA, “the Food and Nutrition Service does not have authority to determine
whether branded products have been appropriately labeled as supplements and cannot answer
inquiries relative to why particular branded products carry a supplement facts label. Such
questions/concerns must be directed to the product manufacturer. Product manufacturers label
their products based on Food and Drug Administration (FDA) labeling guidelines and are in the
5. 5
best position to provide labeling rationale.”(14). We are concerned about this correlating
relationship between food choices and obesity rates, along with the difficulty of the public to
learn more about why the government does not mediate SNAP more stringently. We believe that
the administration of SNAP can be altered in a way that benefits its users and encourages
healthier eating habits. SNAP should be altered by further limiting the products available for
purchase to exclude unhealthy items, providing more transparency to the general public as to
how SNAP operates, and changing the SNAP payment cycle to be distributed benefits more
frequently and evenly within the month to prevent binge buying.
Who uses SNAP benefits and what are they buying? (EA)
As of April of 2013, more than 47.5 million Americans have participated in the SNAP program
receiving food stamps nationwide(15). Recent statistical data shows that every one in seven
Americans receives SNAP benefits, which is higher than any country in the world. Some states
utilize the program more than others depending on the amount of low-income individuals and
just those who need financial assistance. For example, Mississippi uses 20.8% of the country’s
food stamps, while Wyoming only uses 6.3% as of research conducted on November 23, 2013.
The recipients of SNAP can be broken down into many forms of demographics. Data as of the
fiscal year of 2012 represents that 37.6% of the individuals that use the program are white,
23.6% are black, 9.1% are Hispanic, 3.2% are Native American, 2.3% are Asian, and 17.1% are
unknown(16). From the years 1969 to 2011, the amount of participants using the SNAP program
has increased by more than 15 times, from a merely an average of 2,878,000 to 44,709,000 low-
income people.
There is a large controversy surrounding the release of statistical data revealing the items
purchased by the SNAP program recipients and the quantities of items being bought. Americans
spend an average of $80 billion each year funding food stamps, but the people do not even know
exactly where their money is going. Federal rules are the cause of this information not being
released to the public or even to federal agencies such as the USDA. States have denied releasing
this information for undisclosed political and economic reasons. However, under the Information
of Freedom Act (FOIA), the public has the right to know such vital information. Legislation
defends this information by threatening anyone releasing it to be jailed.
SNAP and Obesity Rates (AR)
While both SNAP participant and non-participant children did not meet all food group
recommendations, in nearly every category, SNAP participants averaged a lower daily serving
intake than non-participants (7). In fact, the only categories in which SNAP participants ingested
more servings than nonparticipants was in sugar-sweetened beverages (43% more), processed
meats (44% more) and high-fat dairy products (47% more) (7). Each day SNAP participants
ingested 200 additional calories, .5% greater saturated fat, .6% greater total fat, and 9 mg of
calcium more than non-participants (7). Yet in every other category--dietary cholesterol,
carbohydrates, protein, dietary fiber, sodium, potassium, and iron-- participants ingested less
than non-participants (7). It is clear that SNAP participants are deficient in the nutrients that are
good for them and are superfluous in unhealthy areas.
The deficiency in multiple nutrients among children and families most likely stems from the fact
that many food stamp participants use their SNAP benefits to “get the most bang for their buck.”
6. 6
They do this by purchasing foods like pasta, potatoes, beans, and bread products--which are
inexpensive, come in large quantities, and are highly filling. This massive influx in
carbohydrates and calories will ultimately lead to an increase in fat, leading to obesity.
Additionally, by purchasing unhealthy, filling foods, more money is left on the SNAP card for
the unhealthier things that the benefits can be used to buy, like candy and soda. Unfortunately,
the same laws that prevent the USDA from sharing the information they have about how much
soda is purchased also keeps us from knowing how much of the benefit money is used to buy
pasta and potatoes compared to fruits, vegetables, milk, and other healthier items. In a study held
in 1989, half of all children ages 2 to 18 consumed less than a single serving of vegetables per
day, and of those who did consume a serving of vegetables, half of those “vegetables” were
french fries (17). It can be assumed that this number has only increased due to the skyrocketing
popularity of french fries in the modern world--one can get them pretty much anywhere.
Similarly, in 2011, Congress allowed pizza to be considered a vegetable in school lunches
because of the small amount of tomato paste it contained. The United States has lost sight of
what true nutrition means and the problem only seems to be worsening.
People who are receiving SNAP are supposed to be low-income and unable to afford enough
food to feed their families, yet they use a good amount of their monthly payments for something
that is in no way a necessity--soda. While the USDA cannot release exactly how much of SNAP
is spent on things like candy, soda, and cookies, it is estimated that nearly $4 million dollars of
SNAP money is spent on soft drinks each year (8). This $4 million dollars seems like nothing in
the scheme of the roughly $71.8 billion dollars SNAP provided in 2011 (8) -- it is less than
.005%. Over the last several decades, soda consumption has increased immensely while milk
consumption has decreased rapidly. The majority of this increase in soda intake can be traced to
the massive amount advertising that soft drink companies do. However, another part of this
increase is the amount of lobbying soft drink companies do in the U.S. government, which
ultimately has an influence on product prices. In recent years, milk has become increasingly
expensive, with people spending nearly $4 per gallon, compared to soda which is approximately
$1.50 for a two-liter bottle, which equates to roughly $3 per gallon. These political motives are
thought to be the reason that soft drinks have been allowed to remain on SNAP’s eligibility list
despite a recent spike in attention and controversy.
Another factor of SNAP that influences obesity is the amount of time one receives their SNAP
benefits. Multiple studies have shown that the longer a person receives SNAP, the more likely
that person is to become obese, particularly among women (9 and 18). For instance, females who
received SNAP benefits for more than 24 months have a 4.8% greater prevalence of obesity than
non-recipient women (18). However, men who receive SNAP for at least two years also had an
increased BMI compared to their non-recipient counterparts, but this increase was not seen in
men receiving benefits for less than two years or who were occasional short-term participants
(19). The average length of time a person or family receives SNAP benefits is nine months, so
this does not have as large an impact as the other factors do (20).
Although the length of time receiving SNAP is a factor, there is a wide range in the average BMI
between SNAP participants, SNAP non-participants and people who are ineligible for SNAP.
Yet, none of the averages denote obese--although women SNAP participants come close. For
women, SNAP participants average BMI 29.46, among SNAP non-participants the average is
27.5, and among ineligible women the average is 25.15. Each of these averages is considered
7. 7
“overweight,” but a BMI of 30 or more is required to denote obesity. Among men the results are
similar--SNAP participants average a BMI of 27.53, non-participants average 27.09, and non-
eligible men average 25.64--again, all of which are “overweight,” but not “obese” (19). The basis
of this nearly two-point discrepancy between male and female SNAP participants is unknown,
but it can be assumed that part of this is genetic, and the remainder is environmental factors such
as cultural foods, time spent on food stamps, or the “food stamp cycle.”
The final connection between SNAP and obesity is what is often referred to as the “food stamp
cycle,” which is a form of binge eating that stems from how SNAP benefits are set up, and it is
the most scientifically valid factor. Because SNAP money is received at the start of each month,
food is abundant for the first few days or weeks and is scarce by the end of the month, leading to
hunger among recipients. In fact, 90% of a families SNAP benefits have been redeemed by the
third week of the month and many recipients then turn to food banks and donations to make it
until the next month’s money comes in (13). Then, when the next month’s money comes in, the
abundance occurs again and the binge eating occurs to make up for the hunger that occurred in
the last week or two. This influx of binging and starving causes the body to reserve energy in a
way that fat is stored quickly, ultimately raising one’s BMI. The solution to this aspect is as
simple as receiving benefits bi-weekly or weekly could eliminate this problem.
Cultural Influences (KR)
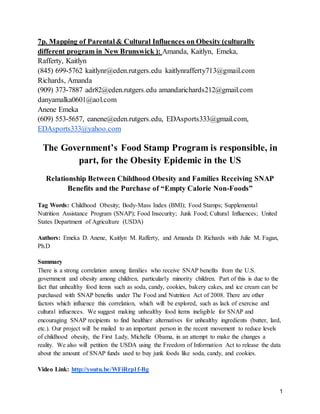
Although childhood obesity is increasing in all ethnic and racial groups, it is more prevalent in
nonwhite populations. The prevalence of childhood obesity among African Americans, Mexican
Americans, and Native Americans exceeds that of other ethnic groups. The Centers for Disease
Control reported that in 2000 the prevalence of obesity was 19% among non-Hispanic black
children and 20% among Mexican American children, compared with 11% of non-Hispanic
white children. The increase since 1980 is particularly evident among non-Hispanic black and
Mexican American adolescents (21).
Comparison of Obesity Percentages by Race and Gender in Adolescents (22)
As people immigrate to the United States they experience pressure to assimilate and
Americanize. This begins with acculturation, or blending native customs with newfound adopted
ones. This transition is long-term, and often spans generations. Since many SNAP participants
are immigrants, understanding buying patterns is vital to grasping the extent of consumer choices
and their role in the obesity epidemic. This is why transparency is necessary within the SNAP
8. 8
transaction processes; awareness of consumer choices, especially those influenced by ethnic
tradition, will lead us to a more holistic picture of the obesity epidemic, thus facilitating its
remediation.
What is currently being done about cultural influences? (KR)
Impressively little is currently being done to deal with cultural traditions that influence SNAP
usage. A plethora of information is available online in regards of how to live a healthier lifestyle
in general, but this is mainly simplified into the mantra “move more, eat less” and does not
provide any culturally-specific solutions to address the obesity epidemic. By promoting
transparency within SNAP, we will have a more complete image of consumer choices by
demographic. Although this may be controversial due to privacy issues, it is one step in focusing
on which products are bought and their frequency of purchase. Mediating the food choices
available for purchase with SNAP by excluding more processed foods, limiting sugar-laden
calories, and directing consumers towards healthier options will drastically change buying habits
across all cultures participating in SNAP without compromising basic staples and ingredients
used for traditional recipes that are so important in preserving culture.
What is the USDA hiding and why aren’t they doing anything? (AR)
Upon an extensive search for data about how SNAP funds are actually spent, there was no
information available on the subject. With further digging, it was discovered that the USDA has
the data regarding how much of SNAP benefits are used on certain food items, but instead of
making the figures public they actively fight attempts to do so. The USDA knows that making
the information public will enrage the American people, drawing unwanted attention to their
questionable methods. The American people have the right to know what their tax dollars are
being used for, and if they knew that their money was being used to buy candy, soda, and
cookies, rather than healthy meals, for low-income families, they would be outraged. Because
SNAP is funded with taxpayer dollars, it should be more transparent in every aspect: what the
funds are used to buy, where the funds are spent, etc. The increased clarity would make the
program more a more respectable and reputable government program.
Additionally, as mentioned earlier, in 2008 WIC updated their list of eligible food items to limit
how much “junk food” could be bought with WIC benefits. If WIC can change what their money
is used for, it stands to reason that SNAP could follow suit--which could help reduce the
prominence of obesity among SNAP participants. However, the USDA refuses to restrict what
SNAP funds are used for because they claim that restricting SNAP food eligibility will not have
any effects on health choices and would cause challenges and increased costs for the program
(23).
It is true that removing candy, soda, and cookies from the eligible food items list may not change
the fact that SNAP participants will buy the items. However, it will make them buy the items
with their own money, rather than the government’s/taxpayer’s. If the participants have to pay
for these items with the income that SNAP is meant to supplement, the increased non-SNAP
food costs might be just enough to discourage them from buying the junk food items to begin
with. This change also will mean that the participants have (in theory) more money to spend each
month on SNAP eligible foods.
Another reason the USDA lists for not changing the eligible-foods list is that it can be difficult to
9. 9
make a distinction between which food items are healthy and which are not (23). The USDA
takes this point even further, and questions whether or not certain food ingredients can be
classified as healthy or not (23). In theory, this defense makes sense, but in practice it has a great
deal of loopholes. It is fairly obvious, and can be considered common knowledge, that certain
food items are healthy and others are not. For example, soda and potato chips are not healthy,
whereas vegetable and milk are. The lines can be blurred on items such as sugary cereals and
juices, but the obviously unhealthy foods should be removed from the eligibility list--period.
The most obvious reason the USDA refuses to remove junk food items off the eligibility list is
the cost they claim would be required to do so. They claim that in order to remove junk food
items from the list, a comprehensive list about the nutritional value (or lack thereof) of every
food on the market would have to be made--which is impossible in a market where the players
are constantly changing and new products are invented every day. A large list naming exactly
which items right down to the brand is and is not eligible is ideal, but it is also extremely
unrealistic. However, a more generic, broadly categorized list could easily be within reach with a
minimal amount of effort and money from the government. The USDA also lists increased
complexity as a major reason for leaving the program as is. Complexity would supposedly
increase in two ways: placing the “burden” of enforcing compliance on supermarket employees
and making the process more complicated and embarrassing for recipients (23). Both of these
points that the USDA hides behind are invalid. While it is true that determining compliance is in
the hands of the employees in small stores where there are no computers to do it for them,
removing obvious junk foods would not make their job any more difficult. These employees
already determine what is and is not eligible on a daily business and adding cookies, candy, and
soda to the ineligible list would not produce any significant added stress. The increased
complexity for recipients is also invalid for the same reasons--adding junk food to the ineligible
list is such a simple change. Removing some five items (cookies, candy, soda, ice cream, and
bakery goods) from the SNAP eligible list would be a small, change, yet the USDA continues to
refuse the adjustment.
The USDA continues to produce mediocre reasons for updating the eligibility list, using them a
smokescreen for their incompetency. SNAP needs to make its process more transparent and can
do so by publishing their data regarding the items purchased with benefits. These small,
inexpensive changes to eligibility and SNAP processes would make the program healthier for
participants and more credible in the eyes of the American people.
Slowing Obesity and Questioning Government Action Regarding SNAP
New ideas to slow the spread of obesity among Food Stamp participants (AR and KR)
Improving the structure of the Supplemental Nutrition Assistance Program is vital to promoting
healthier consumer choices and facilitating access to healthier foods to those in lower
socioeconomic brackets who rely on these benefits. We suggest restructuring SNAP in several
facets of its design. First, the array of foods available to be purchased with SNAP benefits should
be amended much in the way that WIC was. If WIC can revise its program to eliminate the
inclusion of unhealthy, processed, and sugar-laden food items, then it is unclear as to why SNAP
should not follow suit. SNAP should remove products like candy, cookies, bakery goods, and
soda from its eligible items list. Narrower restrictions means that participants will have to use
10. 10
their benefits on healthier items and purchase refined foods with alternate funds, increasing the
amount SNAP funding spent on higher quality foods.
The benefits cycle of SNAP is also problematic: participants receiving money one time each
month encourages binge buying and eating. Paying SNAP participants twice a month to reduce
the prominence of the “food stamp cycle” would enable them to better plan their grocery
shopping, as well as develop a steadier routine of buying groceries. This continuity allows
participants to increase their intake of fresh foods because they become a more feasible choice
when SNAP recipients have the funds to buy fresh foods, rather than buying frozen items to last
until the next payment is received.
Educating SNAP participants about the danger of buying large quantities of pasta, potatoes, and
carbohydrates is another method of improving SNAP. Increasing public outreach by teaching
children of all ages about proper nutrition at younger ages and speaking to parents about ways
their families can eat healthier can help combat the issue that high-starch foods present. SNAP
participants, in particular, should be educated about the possible effects that these unhealthy food
purchases can have on their families’ health. Ultimately, it will be up to the participants to take
the advice given to them or not, but having the information available will undoubtedly make an
impact on some people’s choices when they go food shopping.
Addressing people who can improve SNAP (AR and KR)
For our service project we intend to write a letter about our findings to the First Lady, Michelle
Obama, who is a prominent figure in the fight against childhood obesity. We hope that her
acknowledgement and influence will make the problems with SNAP’s structure a more publicly
recognized issue, and place the program on a road to renovation and restructuring. In addition to
sending our findings to Michelle Obama, we also will be filing a claim with the USDA Food and
Nutrition Services to release the information about what exactly SNAP is used to buy, citing the
Freedom of Information Act as our basis for requesting the information.
Letter to Michelle Obama:
Mrs. Michelle Obama
The White House
1600 Pennsylvania Avenue NW
Washington, DC 20500
22nd April 2014
Dear Mrs. Obama,
We, as students at Rutgers University, with our Professor Dr. Julie Fagan, are studying childhood
obesity and would like to ask for your help. As strange as it may seem, we believe that the
government’s food stamp program is responsible, in part, for the obesity epidemic in the US.
Subjective evidence points to a relationship between childhood obesity and families receiving
SNAP benefits perhaps having to do with the purchase of “empty calorie non-foods”
11. 11
SNAP recipients are more likely to be overweight or obese than those not receiving federal
assistance. This may be due to the tendency for SNAP recipients to purchase low cost, high
calorie and processed foods that lack nutritional value (like soda, candy, snacks). However,
there appears to be no available data on what food items are being purchased through the
nationwide food benefits program. Given that taxpayers are funding this $80 billion dollar food
assistance program, you would think that information would be available on what people are
purchasing. But no. Could it be that the SNAP food purchase data hasn’t been thoroughly
analyzed? We were unable to find any literature on this. Governing federal rules actually prevent
specific food purchasing data to be released to the public or even the USDA. Perhaps if we
analyzed the data on what SNAP beneficiaries were buying (and eating), we would then have
justification for altering what foods are allowed for purchase. SNAP could benefit from
modeling itself after the recently amended WIC program, whereby certain unhealthy foods were
restricted and eliminated.
Although we have sent a request to acquire the SNAP food purchase data to the FNS under the
Freedom of Information Act, we have little hope that such information will be made available to
us. As you are the commander and chief on the childhood obesity campaign, we thought you
would be the right person to get the US on the right track. It is only right that the government
should analyze (and be more transparent with) the programs they fund and assess the outcomes –
which in this case is obesity! We would appreciate your efforts toward this end.
We have included a link to our video http://youtu.be/WFiRrp1f-Bg (an accompanying paper will
soon be googleable on RUcore) concerning the relationship between childhood obesity and
SNAP for your viewing.
Respectfully Yours,
Kaitlyn Rafferty, Amanda Richards, Emeka Anene, and Julie M. Fagan, Ph.D.
Letter of request to the FNS under the FOIA:
Letter to the FOIA:
Ms. Jennifer Weatherly
Agency FOIA Officer
Room 302
3101 Park Center Drive
Alexandria, VA 22302
22 April 2014
12. 12
Dear Ms. Weatherly,
This is a request under the Freedom of Information Act.
We are requesting the data (or reports on analysis of the data) on food items that have been
purchased with Supplemental Nutrition Assistance Program (SNAP) benefits. If the food
purchase data has not been analyzed, we would like the opportunity of analyzing that data and
would need to know more about the format and size of the data file.
Please respond to our professor, Dr. Julie Fagan (email: fagan@rci.rutgers.edu).
Sincerely,
Amanda Richards, Katelyn Rafferty, Emeka Anene, and Julie M. Fagan, Ph.D.
School of Environmental and Biological Sciences
Rutgers, The State University of New Jersey
84 Lipman Drive
New Brunswick, NJ 08903
References
1. Centers for Disease Control and Prevention. (6, December 2013). The health effects of
overweight and obesity. Retrieved from http://www.cdc.gov/healthyweight/effects/
2. Centers for Disease Control and Prevention, (2010). Overweight, obesity, and healthy
weight among persons 20 years of age and over, by selected characteristics. Retrieved
from website: http://www.cdc.gov/nchs/data/hus/2010/071.pdf
3. Ogden, C. L., Carroll, M. D., Kit, B. K., & Flegal, K. M. Centers for Disease Control and
Prevention, (2013).Prevalence of obesity among adults: United states, 2011–2012 (131).
Retrieved from website: http://www.cdc.gov/nchs/data/databriefs/db131.htm
4. Centers for Disease Control and Prevention, (2014).Childhood obesity facts. Retrieved
from website: http://www.cdc.gov/healthyyouth/obesity/facts.htm
5. Cochran, M.D., W. Obesity Action Coalition, (n.d.).Understanding the childhood obesity
epidemic. Retrieved from website: http://www.obesityaction.org/educational-
resources/resource-articles-2/childhood-obesity-resource-articles/understanding-the-
childhood-obesity-epidemic
6. Lloyd, K., Ohri-Vachaspati, P., Brownlee, S., Yedida, M., Gadoba, D., & Chou, J.
(2010). New jersey childhood obesity survey. Unpublished raw data, Center for State
Health Policy, Rutgers University, New Brunswick, NJ, Retrieved from
http://www.cshp.rutgers.edu/Downloads/8660.pdf
7. Larson, N. I., & Story, M. T. (2011). Food insecurity and weight status among u.s.
children and families: A review of the literature. American Journal of Preventative
Medicine, 40(2), 166-173.
8. Leung, E. A. (2013). Associations of food stamp participations with dietary quality and
obesity in children. Pediatrics, 131(3), 463-472. Retrieved from http://susan-
blumenthal.org/wp-content/uploads/2013/05/Pediatrics-Assoc-of-Food-Stamp-
Participation.pdf
13. 13
9. Baum, C. L. (2011). The effects of food stamps on obesity. Southern Economic Journal,
77(3), 613-651.
10. United States Department of Agriculture (2014). Programs and Services | Food and
Nutrition Service. Retrieved from http://www.fns.usda.gov/programs-and-services
11. United States Department of Agriculture (2013). Eligible Food Items | Food and
Nutrition Service. Retrieved from http://www.fns.usda.gov/snap/eligible-food-items
12. United States Department of Agriculture. (2013). Supplemental nutrition assistance
program (SNAP) eligible food items. Retrieved from
http://www.fns.usda.gov/snap/eligible-food-items
13. Feeding America. (2014). Snap (food stamps): Facts, myths and realities. Retrieved from
http://feedingamerica.org/how-we-fight-hunger/programs-and-services/public-assistance-
programs/supplemental-nutrition-assistance-program/snap-myths-realities.aspx
14. United States Department of Agriculture Department of Nutrition Service.
(2010).Determining product eligibility for purchase with snap benef. Retrieved from
http://www.fns.usda.gov/sites/default/files/eligibility.pdf
15. Holeywell, R. (2013). Who Is On Food Stamps, By State. Retrieved from
http://www.governing.com/gov-data/food-stamp-snap-benefits-enrollment-participation-
totals-map.html
16. Morin, R. (2013). The politics and demographics of food stamp recipients | Pew
Research Center. Retrieved from http://www.pewresearch.org/fact-tank/2013/07/12/the-
politics-and-demographics-of-food-stamp-recipients/
17. Newby, P. K. (2007). Are dietary intakes and eating behaviors related to childhood
obesity? A Comprehensive Review of the Evidence. Journal Of Law, Medicine & Ethics,
35(1), 35-60. doi:10.1111/j.1748-720X.2007.00112.x. Retrieved from
http://eds.a.ebscohost.com.proxy.libraries.rutgers.edu/eds/detail?vid=15&sid=be4456a6-
0273-44b6-9112-
f028895474e6%40sessionmgr4005&hid=4103&bdata=JnNpdGU9ZWRzLWxpdmU%3d
#db=c8h&AN=2009547962
18. Ver Ploeg, M., & Ralston, K. (2008). Food stamps and obesity: What we know and what
it means. Amber Waves:The Economics Of Food, Farming, Natural Resources, & Rural
America, 3(5), 16-21. Retrieved from
http://eds.a.ebscohost.com.proxy.libraries.rutgers.edu/eds/detail?vid=12&sid=be4456a6-
0273-44b6-9112-
f028895474e6%40sessionmgr4005&hid=4103&bdata=JnNpdGU9ZWRzLWxpdmU%3d
#db=rgm&AN=504478094
19. Meyerhoefer, C. D., & Pylypchuk, Y. (2008). Does participation in the food stamp
program increase the prevalence of obesity and health care spending?. American Journal
Of Agricultural Economics, 90(2), 287-305. Retrieved from
http://eds.a.ebscohost.com.proxy.libraries.rutgers.edu/eds/detail?vid=6&sid=be4456a6-
0273-44b6-9112-
f028895474e6%40sessionmgr4005&hid=4103&bdata=JnNpdGU9ZWRzLWxpdmU%3d
#db=buh&AN=31591759
20. Feeding America. (2012). SSNAP: Program facts. Retrieved from
http://www.cafoodbanks.org/docs/SNAPFacts.pdf
14. 14
21. American Diabetes Association. (2008). Influence of race, ethnicity, and culture on
childhood obesity: Implications for prevention and treatment. Retrieved from
http://www.ncbi.nlm.nih.gov/pmc/articles/PMC2571048/
22. National Library of Medicine. (2008). Overweight prevalence by race/ethnicity for
adolescent boys and girls [Web Graphic]. Retrieved from
http://www.ncbi.nlm.nih.gov/pmc/articles/PMC2571048/figure/f1/
23. United States Department of Agriculture, Food and Nutrition Service. (2007).
Implications of restricting the use of food stamp benefits. Retrieved from website:
http://www.fns.usda.gov/sites/default/files/arra/FSPFoodRestrictions.pdf
24. United States Department of Agriculture, Food and Nutrition Service. (2007). Special
supplemental nutrition program for women, infants and children (wic): revisions in the
wic food packages; interim rule (RIN 0584–AD77 ). Retrieved from National Archives
and Records Administration website:
http://www.fns.usda.gov/sites/default/files/wicfoodpkginterimrulepdf.pdf
Letters to the Editor
AR 4/2:
Sent to Mike Brossart, Opinion Editor at the Inland Valley Daily Bulletin
mike.brossart@inlandnewspapers.com
Childhood Obesity and SNAP: What Doesn’t the Public Know?
More than 47 million Americans participate in SNAP (Supplemental Nutrition Assistance
Program,) formerly known as the Food Stamp Program, and receive approximately $130 per
person each month in benefits, totaling more than $70 billion in taxpayer money. However,
studies have shown that SNAP participants are more likely than the average population to be
overweight or obese. SNAP participants ingest 200 extra calories each day and nearly 50% more
servings of sugar-sweetened beverages per day than non-participants.
What Americans don’t know is that items like cookies, soda, and candy can be purchased with
SNAP. Furthermore, the USDA is not allowed to disclose the amount of SNAP benefits that is
used to buy these unhealthy foods. Americans have no way of knowing what their tax dollars are
actually being used for, although they can be sure that they are funding unhealthy habits.
Removing so-called “food items” from the eligible foods list would lower obesity rates among
low income children, preventing many of them from remaining obese into adulthood. By taking
these items off the eligibility list, we can ensure healthier lives and futures for America’s
children.
Amanda Richards
Rutgers University, Class of 2015
KR 4/1
This letter was sent to Mr. Paul Grzella, Editor-In-Chief of the Courier News
cnletters@mycentraljersey.com
15. 15
Looking at our Obesity Problem: Food Stamps and Childhood Obesity
The recent publication of the article Robert Wood Johnson University Hospital, Somerset
Medical Center partnership to offer better access to care on March 30th reflects a growing need
for accessible healthcare. In central New Jersey, as well as many other locations in the US,
increasing demand for accessible healthcare is partly due to physical effects of preventable
diseases, such as Type II diabetes. As RWJ and Somerset Medical Center work on developing
ways to improve their diabetes outreach initiatives in the Latino community, it is important to
consider that many New Jersey residents rely on food assistance programs such as the
Supplemental Nutrition Assistance Program (SNAP). According to research done by the RWJ
Foundation, here in New Brunswick children are more likely to be overweight or obese
compared to their national counterparts (48% rate in New Brunswick versus 21% national rate).
An interesting detail is that while WIC has amended their list of eligible food items to exclude
most foods we would consider to be unhealthy, SNAP has not followed suit and allows
participants to buy a wide variety of processed, high-sugar foods. If we are to improve the health
status of our citizens, especially children, then encouraging the revision of SNAP to promote
better food choices seems like a good place to start.
Kaitlyn Rafferty
New Brunswick, NJ
EA 4/8:
This letter was sent to the Editor-in-Chief of the Washington Post:
letters@washpost.com
As recently as April 2013, the number enrolled in SNAP (Supplemental Nutrition
Assistance Program) grew to an astounding 47.5 million participants. SNAP recipients are more
likely to be overweight or obese than those not receiving federal assistance. This may be due to
the tendency for SNAP recipients to purchase low cost, high calorie and processed foods that
lack nutritional value (like soda, candy, snacks). However, there appears to be no available data
on what food items are being purchased through the nationwide food benefits program. Given
that taxpayers are funding this $80 billion dollar food assistance program, you would think that
information would be available on what people are purchasing. But no. Governing federal rules
prevent specific food purchasing data to be released to the public or even the USDA. We have a
problem with this…
Emeka Anene
Graduating senior at Rutgers University
Julie M. Fagan, Ph.D.
Associate Professor,
16. 16
Rutgers University
JF Mar 7
I find it appalling and irresponsible for the government to be shelling out all this money for food
stamps and not being accountable in any way for what people are buying with them. They are
essentially allowing people to make poor food choices and are responsible for the obesity
epidemic - at least I think we should argue that point. I do not believe that the government does
not have knowledge or access to knowledge on what people are purchasing with their food
stamps and cards. They probably just don't want this information to be public - as it would be
terribly embarrassing - an indication of failure of the food stamp program.
I would structure your paper to have the above as your focus. You can put in all your data on
SNAP, ethnicity, and obesity to support your claim that the governments food stamp program is a
huge contributor to the obesity epidemic in the US.
For your service project, I think you should dig deep and try to get the info on what is purchased
with food stamps - go as far as you can and then demand that an investigation be done - Write to
legislators (like the senator that sent me an email today on the food stamp fraud) and to Michelle
Obama, make some noise - .
See the prior students paper on the food stamp obesity in low socioeconomic status. The next
step is to reform what is allowed to be purchased with food stamps. There is literature on this - it
was brought up in Congress? (I think after the students were working on this) and there was
discussion on this. Find that. Report on that. That information w ill help you understand the
arguments of why changes were not made (or maybe they were but obviously they didn't go far
enough). Another group a few years back wrote to try to limit what foods could be purchased with
food stamps (eliminating candy, soda, etc), but that didn’t get too far. The reference for you to use
http://rucore.libraries.rutgers.edu/rutgers-lib/38439/.
Got this email today:
---------------------------- Original Message ----------------------------
Subject: Fighting Food Stamp Fraud
From: David_Vitter@vitter.senate.gov
Date: Fri, March 7, 2014 7:21 pm
To: fagan@rci.rutgers.edu
--------------------------------------------------------------------------
<https://iqs3.solutions.lmit.com/iqextranet/iqClickTrk.aspx?&cid=quorum_
vitter-iq&crop=19639.267536292.16358364.33671338&redirect=http%3a%2f%2fw
17. 17
ww.vitter.senate.gov>
Dear Friend,
You probably remember the massive fraud and abuse of welfare cards in north Louisiana
last fall. If not, there was a computer glitch that essentially left welfare cards through the
Electronic Benefit Transfer (EBT) program with no limit for a period of time.
We later learned that some of the beneficiaries took advantage of that glitch and knowingly
checked out grocery store items far above their legal limit - some stole hundreds of dollars'
worth in groceries.
This is absolutely a case of theft and fraud - especially against taxpayers. Additionally, it
hurts the honest beneficiaries of that program who really need the help.
I've been working to get Louisiana's Attorney General Buddy Caldwell and Department of
Children and Family Services Secretary Suzie Sonnier to take aggressive action in response
to the fraud. Last week the state took some action, but only scratched the surface. Just six
of the 12,000 SNAP recipients who made transactions during the systemoutage lost their
benefits.
Like many of you, I still believe there should be serious consequences for all those who
participated. I'm going to keeppushing to make sure that those who deliberately stole from
the program are disqualified.
As always, I'm interested in hearing your thoughts on food stamp fraud and other issues
important to you. Please contact me with your ideas at any of my state offices or in my
Washington office. You can also reach me online at http://vitter.senate.gov
<https://iqs3.solutions.lmit.com/iqextranet/iqClickTrk.aspx?&cid=quorum_
vitter-iq&crop=19639.267536292.16358364.33671338&redirect=http%3a%2f%2fw
ww.vitter.senate.gov> .
Sincerely,
David Vitter
Signature<http://www.vitter.senate.gov/images/vitter_signature.gif>
David Vitter
United States Senator
P.S. Please visit my website to sign up
<https://iqs3.solutions.lmit.com/iqextranet/iqClickTrk.aspx?&cid=quorum_
vitter-iq&crop=19639.267536292.16358364.33671338&redirect=http%3a%2f%2fw
18. 18
ww.vitter.senate.gov%2fcontact%2fnewsletter-signup> for regular email
updates from me on the issues important to Louisiana families.
Please do not reply to this email.
For any other questions or concerns visit my Web site at: www.vitter.senate.gov
<https://iqs3.solutions.lmit.com/iqextranet/iqClickTrk.aspx?&cid=quorum_
vitter-iq&crop=19639.267536292.16358364.33671338&redirect=http%3a%2f%2fw
ww.vitter.senate.gov> .
<https://iqs3.solutions.lmit.com/iqextranet/Customers/quorum_vitter-iq/i
qtrk.gif?crop=19639.267536292.16358364.33671338>
JF Mar4
Nice summary. You have alot of info below (nice job - 6/6 points for each of you) but I
don’t see an outline yet. Get an outline for part 1, insert it above, then start writing the text
under each heading by class period tomorrow so you have something to show in a
reasonable order of thought.
Mapping of Parental & Cultural Influences on Obesity (7p)
Employing GIS mapping techniques, identify and institute programs that address cultural food
choices and parental influence on healthy eating that would positively affect the obesity problem.
EA-2/11:
In order to start this project, first I believe we have to gather all of the information needed from
each aspect of the program. We need to specifically pinpoint the individual cultures involved,
map out all of their locations and uncover all of the traditional foods they eat that are deemed
unhealthy. Also, when mapping their locations, we need to investigate all of the corner stores
and fast food venues in the immediate area. It must be known if there are any food deserts in the
vicinity to help shed light on the issue at hand. Ingredients used in the traditional foods must
also be investigated to find healthy alternatives. Once all of this information is gathered, we
must construct a healthy game plan collaborating all of the data to institute a new form of
improvement. Perhaps I will map out the bus routes for those who may not know the easiest way
to obtain healthy foods because of these people have a heartache getting to this healthy food,
they will succumb to nearby unhealthy alternatives for the sake of cost and time. We need to
show them that it will make difference not only in their children’s lives, but also in their own
lives.
Every year, the Eric B. Chandler Health Center (across from Rockoff on George Street) have a
19. 19
annual bazaar event where traditional food is given out as an act of charity. To my knowledge I
am not sure if this food has its health benefits. If the food is made the cultural way, it most likely
will not have the nutrition needed to distribute to the community. We can alter the ingredients
used to make these traditional foods (hopefully not changing the taste too much) in order to show
the community that without any extra trouble the food can be prepared in a healthy way and that
it will make a big difference in the lives of the community of parents and children.
AR - 2/11:
Here is a study that Rutgers and RWJ Hospital did on childhood obesity in New Brunswick in
2010. It breaks down numbers of children in certain age groups, the percentages of minority
children, and their BMI’s. It also spans food behaviors, where NB parents get their food, exercise
habits, etc. It looks like it could be really helpful!!!!
http://www.cshp.rutgers.edu/Downloads/8660.pdf
This is a similar, more recent study (2012) but it doesn’t focus so exclusively on kids.
http://www.state.nj.us/health/fhs/shapingnj/library/ObesityReport_v6_Final.pdf
Here are a few more websites/documents with other obesity info:
http://www.rwjf.org/en/research-publications/find-rwjf-research/2010/01/new-jersey-childhood-
obesity-study--new-brunswick-school-bmi-dat.html
http://www.city-data.com/city/New-Brunswick-New-Jersey.html
KR 2/11
More links on national data:
https://www.healthiergeneration.org/about_childhood_obesity/in_your_state/?gclid=CLKKhe-
xq7wCFWUOOgodUhcA2A (general US)
https://www.healthiergeneration.org/about_childhood_obesity/in_your_state/new_jersey/?gclid=CN_Rns
W1q7wCFW3xOgodqT8AZA (just NJ)
http://www.nccor.org/downloads/ChildhoodObesity_020509.pdf (takes into account culture)
http://www.rwjf.org/content/dam/farm/reports/surveys_and_polls/2010/rwjf69259 Rutgers Camden
Research on obesity
Ideas: elementary school potluck featuring healthier cooking techniques, ingredient substitutions, etc.
focus on Latino community in New Brunswick, Middlesex County
difficulties: cost of hosting a potluck. might do it for just one class. permission to host it from the school
might be difficult (3 random strangers making something for your kids to ingest)
AR 2/12:
Substitution examples:
http://www.vegetariantimes.com/article/ingredient-substitution-guide/
20. 20
http://www.theheartinstituteny.com/pdf/SubstitutionChart-62926-1.pdf
http://greatist.com/health/83-healthy-recipe-substitutions
http://allrecipes.com/howto/light-substitutions/
JF 2/17
regarding AR’s post “Here is a study that Rutgers and RWJ Hospital did on childhood obesity in
New Brunswick in 2010. It breaks down numbers of children in certain age groups, the
percentages of minority children, and their BMI’s. It also spans food behaviors, where NB
parents get their food, exercise habits, etc. It looks like it could be really helpful!!!!
http://www.cshp.rutgers.edu/Downloads/8660.pdf”
seems like a trend hard to stop - obesity, poor diet, lack of fruits + veggies, lack of exercise
That study did not ask whether they were receiving food stamps - betcha a high percent
were. If they were only allowed to buy fresh meats, fruits, veggies, dairy with food stamps,
then, healthier food would be going home. Another group a few years back wrote to try to
limit what foods could be purchased with food stamps (eliminating candy, soda, etc), but
that didn’t get too far. The reference for you to use
http://rucore.libraries.rutgers.edu/rutgers-lib/38439/. Maybe if Michelle Obama could use
her influence. .. consider sending her your project results as your service project.
There is data that correlates lower socioeconomic status with obesity and some conclude
that buying healthier food costs more - hence, they have no choice but to buy the cheaper
unhealthier food. There is also some literature that compared prices of foods and have
come to the conclusion that healthier food dous NOT cost more money. Frankly, I think
that blaming obesity on not having enough money to purchase healthy food is just one big
excuse - the fault lies in what they CHOOSE to purchase.; and this may differ with
ethnicity.
Maybe our government subsidies (like food stamps) are playing a larger than expected role
in obesity. This, I think, would be a great focus for your project. You can look at what
parents of different ethnicities buy now with their food stamps and whether their kids go
shopping with them (and request things like cocopuffs, pop tarts, chips and soda). No
reason to focus on New Brunswick UNLESS the people who did that survey have the ability
to interact with the same respondents and then we could help develop a new survey and get
it out there. I will make a few phone calls regarding this possibility . I would map areas
nationwide and compare use of food stamps and rates of obesity. Also look to see if there is
data on what people buy using food stamps and whether there is a breakdown with
ethnicity. Obviously, parents are the ones that have the food stamps and they are feeding
their families on what they purchase. jf
21. 21
just emailed the following:
To: childhoodobesity@ifh.rutgers.edu
I am working with upperclass students on the Rutgers SEBS campus on a project
examining cultural influences on obesity. I was wondering if you could access the same
individuals that participated in your 2010 survey
http://www.cshp.rutgers.edu/Downloads/8660.pdf.
I was hoping that maybe I could work with the authors of the prior study to ask additional
questions. Feel free to call me today @ (610) 847-2411
Thank You,
Julie
Julie M. Fagan, Ph.D.
(610) 847-2411
Associate Professor
School of Environmental and Biological Science
Rutgers University
KR 2/17:
http://www.cdc.gov/obesity/childhood/solutions.html
http://www.healthandenvironment.org/docs/Schettlerforesight_commentary.pdf
international statistics: http://www.allhealth.org/briefingmaterials/lancetobesityrev-393.pdf
http://apps.who.int/iris/bitstream/10665/80147/1/9789241503273_eng.pdf
possible outline headings:
Statistics on childhood obesity (local, state, national, international levels):
Causes ofchildhood obesity:
Numerous causes of childhood obesity have been cited, among them being genetic predisposition,
psychological factors such as eating disorders, and learned habits. Learned habits develop at a young age
and are influenced by parental habits and cultural elements.
http://www.ncbi.nlm.nih.gov/pmc/articles/PMC1280362/
Focusing on culture/parental influence on eating habits:
Proposed solutions:
Most suggest simplistic approaches that offer vague advice such as “eat better, move more” and focus on
what adults can do for children (compare the suggestions for children versus adults in the ket.org link and
22. 22
many more strategies are listed for adults). Taking parental responsibility is great, but how do we
synthesize this to address culturally specific issues?
http://www.ket.org/kidshealth/wellness/obesity_solutions.htm
http://www.obesitypreventionfoundation.org/solutions.shtml
AR 2/18:
Went into the Rutgers Library Databases and found a few studies/articles about whether or not food
stamps are linked to obesity in American kids. I highlighted some important points in the bullets below
each link!
● https://login.proxy.libraries.rutgers.edu/login?url=http://search.ebscohost.com/login.aspx?direct=tr
ue&db=ecn&AN=1230590&site=eds-live
○ requested to Douglass library--will update when I get it!
● https://login.proxy.libraries.rutgers.edu/login?url=http://search.ebscohost.com/login.aspx?direct=tr
ue&db=aph&AN=85897979&site=eds -live
○ “Among SNAP participants, 18.7% were overweight, and 17.5% were obese”
○ “Both groups of children were far from meeting national dietary recommendations for
fruits, vegetables, whole grains, fish and shellfish, and nuts, seeds, and legumes”
■ Mean consumption of fruits, vegetables, and whole grains, was ≤1 serving/day.
Mean fish and shellfish consumption was ≤0.5 servings/week.
■ Mean consumption of nuts, seeds and legumes ranged from 1.5 to 2.4
servings/week.
■ Mean consumption of refined grains was between 5.6 and 5.7 servings/day.
■ Mean consumption of processed meat ranged from 2.6 to 2.8 servings per week.
■ Mean consumption of high-fat dairy products was between 1.3 and 1.4 servings
per day.
■ For SSBs (sugar-sweetened beverages), mean consumption ranged from 2.3 to
2.5 servings per day
○ “Zero percent of low-income children, regardless of SNAP participation, met at least 7
national dietary recommendations.”
● https://login.proxy.libraries.rutgers.edu/login?url=http://search.ebscohost.com/login.aspx?direct=tr
ue&db=edo&AN=60513898&site=eds -live
○ “10.9% of children and adolescents aged 2 through 19 were at or above the 97th
percentile of the 2000 BMI-for-age growth charts, 15.5% were at or above the 95th
percentile, and 30.1% were at or above the 85th percentile.”
○ “The CDC estimates that nearly 70% of obese children become obese adults”
○ “First, FSP (Food Stamp Program) participation has been shown to increase food
consumption by an amount greater than expected, as the marginal propensity to
consume food from a dollar of food stamp benefits (FSB) is greater than the marginal
propensity to consume food from a dollar of money income.”
■ “An emphasis on quantity may lead an FSP participant to make poor choices and
overconsume low-quality food.”
○ “FSP participation is associated with a CMI increase for children with lower than normal
BMIs, but not for those with normal or higher than normal BMIs. Moreover, they found
FSP participation did not increase the likelihood that a child is overweight”
23. 23
○ “Simultaneously, it is also possible that obese parents may place a lower value on their
child’s BMI and have a lower level of parental concern for their child’s BMI, making it
easier for a child to exercise less, eat more, and have a positive BMI”
○ “An increase in a family’s FSP participation (measured in months) increases the BMID of
girls between the ages of 12 and 18 who are already overweight and for boys between
the ages of 12 and 18 who are currently underweight”
■ “FSP participation is positive and significant for underweight boys suggests the
FSP is meeting its goal in improving nutrition to this specific subsample of
children.”
■ “However, the finding that FSP participation is significant and positive for
overweight girls implies FSP participation has an adverse effect on the health of
an overweight older girl”
● https://login.proxy.libraries.rutgers.edu/login?url=http://search.ebscohost.com/login.aspx?direct=tr
ue&db=edselp&AN=S0749379710006380&site=eds-live
○ “However, the majority of studies either found no evidence of a direct relationship
between household food insecurity and weight status or found evidence indicating that
children living in food-insecure households are less likely to be obese.”
○ “However, the majority of studies either found no evidence of a direct relationship
between household food insecurity and weight status or found evidence indicating that
children living in food-insecure households are less likely to be obese“
○ “One study found that receipt of SNAP benefıts was associated with an approximate 2.2
kg/m higher BMI.”
○ “In contrast to the mixed fındings for men, research in women suggests that long-term
receipt of SNAP benefıts may increase risk for obesity“
● https://login.proxy.libraries.rutgers.edu/login?url=http://search.ebscohost.com/login.aspx?direct=tr
ue&db=edselp&AN=S0002870312001743&site=eds-live
○ “An emerging theory is that many members of our population may be genetically
predisposed to develop obesity but only to the extent that their local environment allows
or fosters an energy imbalance between calories of nutrients ingested versus calories
expended.”
○ “The overall percentage of overweight/obese was as low as 9.6% and as high as 42.8%.
The percentage of low income in households in each community varied from 2.4% to a
high of 69.5%”
○ “There appears to be a threshold effect at or near 15% low income.”
○ “What then explains the higher frequency of childhood obesity in lower income
communities? First, access to fast food restaurants and relative poor access to stores
selling fruits and vegetables are at the top of the list… Second, studies suggest a distinct
inverse relationship between availability of recreational parks and programs and average
community household income… Third, the association between household income and
childhood obesity also relates to parents…”
● https://login.proxy.libraries.rutgers.edu/login?url=http://search.ebscohost.com/login.aspx?direct=tr
ue&db=aph&AN=24181448&site=eds -live
○ “Energy intake and portion sizes of food consumed both at home and away from home
increased considerably between 1977 and 1998.”
○ “Of note, portions of salty snacks increased by 93 kcal (from 1.0 to 1.6 oz), soft drinks by
49 kcal (13.1 to 19.9 fl oz), hamburgers by 97 kcal (5.7 to 7.0 oz ), and
○ french fries by 68 kcal (3.1 to 3.6 oz ) all of which are commonly consumed by children.”
24. 24
○ “There have been many changes in children’s beverage consumption patterns over the
past several decades, including an increase in soft drinks and fruit juice consumption and
a decrease in milk consumption.”
○ “Further, there have been alterations in eating behavior, including increased away-from-
home dining and snacking.”
○ “An earlier review of childhood obesity indicates that obese children do not tend to
massively overeat, which supports findings from descriptive studies that mean energy
intakes are not significantly different among overweight and normal weight children.”
○ “Obese children consumed a higher amount of saturated fat compared to non-obese
children (35 g/d vs. 27 g/d, respectively)“
○ “Fiber intakes were higher among non-overweight boys compared to overweight boys (19
g vs. 15 g, respectively)“
○ “Data from CSFII 1989-91 indicate that only 20% of children consumed 5 or more
servings of fruits and vegetables recommended per day, and half of all children aged 2-
18 years consumed less than a serving of fruit per day; about half of vegetables
consumed were french fries”
○ “Intakes of bread, rice, and pasta were directly (though weakly) associated with BMI
among boys and girls, although this study did not adjust for potential confounders…”
○ “Descriptive studies have shown that cereal consumers have significantly lower BMI than
non-consumers”
○ “Indeed, there is some evidence to suggest that SSBs contribute to greater energy
intakes among consumers and may also displace more nutritious beverages from the diet
such as milk.”
■ “Children at risk of overweight who consumed at least 3 “sweet” drinks/d were
1.8 times more likely to become overweight compared to those consuming less
than one drink per day”
● note: 100% fruit juice was included in the measurement of “sweet” drinks
○ Where? When? How Often? and With Whom?
■ Where?
● “obese children consumed food away from home more frequently than
non-obese children”
■ When?
● “overweight subjects who did consume breakfast consumed significantly
less calories at the meal than normal weight subject”
● “those who consume breakfast have a lower BMI and lower prevalence
of overweight compared to those who do not”
● “Skipping breakfast was associated with overweight among children
aged 9-14 years at baseline”
● “Overweight subjects are skipping breakfast in response to their weight;
skipping breakfast is not causing overweight.”
■ How Often?
● ”perhaps the number and timing of meals consumed throughout the day
are less important than the distribution of energy across those meals”
■ With Whom?
● “frequency of family dinner has been associated with healthier meals,
including higher intake of vegetables, fruit, dairy products, as well as
higher intakes of vitamins and minerals and a lower risk of skipping
breakfast”
25. 25
● https://login.proxy.libraries.rutgers.edu/login?url=http://search.ebscohost.com/login.aspx?direct=tr
ue&db=buh&AN=64391460&site=eds -live
○ “genetic factors, environmental factors such as the availability of food, social interactions,
and stress also cause a predisposition to obesity”
○ “Over one-in-five (22.5%) children in the US lives in a food insecure household, where
food insecurity is defined as the uncertainty of having, or the inability to acquire, enough
food for all household members to sustain active, healthy living because of insufficient
money or other resource”
○ “Children living in poverty had a substantially higher food insecurity rate (51.5%)
compared to all children (22.5%) and children in households with income greater than
185% of the poverty line (9.8%)”
○ “About one-in-five children were obese (22.24%) and a similar proportion was in a food
insecure household (20.54%). Consistent with the review above, prevalences of obesity
and food insecurity varied by gender, race/ethnicity and poverty level. Boys were more
likely to be obese than girls, but their rates of food insecurity were similar. Almost one-in-
four Hispanic and black children were obese with rates substantially lower for white
children.”
● https://login.proxy.libraries.rutgers.edu/login?url=http://search.ebscohost.com/login.aspx?direct=tr
ue&db=buh&AN=58107568&site=eds -live
○ “Adult Americans are now more likely to be obese than to smoke cigarettes”
■ “some have asserted that obesity will soon overtake tobacco as the lading
preventable cause of death”
■ “estimates suggest that obesity contributes to between 11,909 and 365,000
premature adult deaths in the U.S. each year, compared to 435,000 premature
deaths due to tobacco”
○ Various Causes Being Examined:
■ “results of jobs becoming more sedentary”
■ “maternal employment increases childhood obesity because working mothers
have less time to prepare healthy meals”
■ “technological advances in food preparation, making food available, have caused
hyperbolic consumers to overeat”
■ “increases in the number of restaurants and decreases in food prices”
○ Prior to food stamps, poverty = less food consumption
○ 2005 - FSP served ~ 25.7 M people with obesity at over 30%
○ “FSP increases food consumption by making monetary cost of food zero for eligible
individuals up to their food stamp allotment”
○ “recent evidence by Wilde, McNamara, and Ranney (1999) suggests that food stamp
recipients consume significantly more sugar and fat than eligible non-recipients“
○ “Food stamps might also exacerbate obesity by promoting binge eating”
■ “abundant food at the beginning of each monthly food stamp cycle leads to
overeating, with food becoming scarce at the end of each cycle, and a binge
eating at the start of the next cycle”
○ “Among males (females) who receive food stamps, benefits average $1947 ($2925) per
year (all dollar amounts are adjusted for inflation to year 2905 dollars using the
Consumer Price Index)”
■ USDA ~ $212.90 per month for 11 months
■ 26.2% (28.6%) of eligible male (female) recipients are obese compared to 15.6%
(19.2%) of non-recipients”
○ “Stats about Food Stamp Recipients
26. 26
■ both male and female recipients have significantly less education
■ significantly larger families (with more children)
■ are significantly less likely to be employed (and work fewer weeks)
■ Eligible male recipients are more likely to be married, and eligible female
recipients are less likely to be married”
○ “Of the male (female) food stamp recipients in my sample, about 35% (16%) receive
benefits short-term [< 9 months], 25% (17%) medium-term [9-24 months], and 21%
(53%) long-term [>24 months], and 19% (14%) experience multiple spells”
■ “Short-term and medium-term food stamp receipt do not tend to have statistically
significant effects on obesity and the obesity gap for income=eligible males or
females, as is true for receiving food stamps during multiple spells at the 5%
level
○ “28.1% of those (eligible males and females combined) on food stamps are obese”
compared to 17.5% of non-recipients.”
○ “Similarly, receiving food stamps long-term increases obesity by almost 5.0 percentage
points for income-eligible females, but receiving assistance from the Food Stamp
Program for a more limited period does not.”
EA 2/18:
http://www.njbiz.com/article/20121109/NJBIZ01/121109865/Fresh-Grocer-supermarket-opens-
in-New-Brunswick-addressing-'food-desert'-challenge
http://www.nj.com/news/index.ssf/2011/08/stranded_in_food_deserts_hundr.html
I will be conducting a map using Google Earth soon that maps out the specific food deserts in
the area. ( I just learned how to use this feature in my GIS Health class).
AR 2/18
Habits of grocery shopping purchasing, based on ethnicity.
Why and the extent of link between food stamps and obesity.
Mapping ethnicities and who is receiving food stamps
how to categorize and regulate food stamp usage (what should and shouldn’t be eligible)
SNAP Map: http://www.ers.usda.gov/data-products/supplemental-nutrition-assistance-program-
(snap)-data-system/go-to-the-map.aspx#.UwT0G0JdUwI
http://projects.nytimes.com/census/2010/explorer mapping racial demographics in the US down
to the street
What SNAP can be used for:
http://www.fns.usda.gov/snap/eligible-food-items
EA 2/19:
I am trying to uncover some more data about the use of food stamps in America and compare it
specifically to New Brunswick. In doing so, I will be searching the web for any statistical
information that shows the breakdown of food purchased at the local stores with food stamps
and I will try to conduct a list of the most popular unhealthy foods purchased. Here are some
links related to this topic:
27. 27
● http://www.governing.com/gov-data/food-stamp-snap-benefits-enrollment-participation-
totals-map.html
● http://www.statisticbrain.com/food-stamp-statistics/
● http://www.fns.usda.gov/ora/SNAPCharacteristics/NewJersey/NewJersey.pdf
● http://www.washingtontimes.com/news/2012/jun/24/top-secret-what-food-stamps-
buy/?page=all
❏ Unfortunately: “The agency also has no idea what type of food the benefits are buying, even
though the combination of universal bar codes and benefit cards makes that entirely feasible.
‘It’s one of those questions that frankly those of us who have been working on this issue have been
struggling with a long time because we need to see the data. The industry looks at it as proprietary.
The USDA doesn’t track where that money goes,’ said Beth Johnson, a former Senate Agriculture
Committee and USDA staffer who now consults for the Snack Food Association.
She noted that stores have breakdowns of products bought with food stamps but declined to share
them with the USDA”
● http://www.childtrends.org/?indicators=food-stamp-receipt
● http://www.fns.usda.gov/snap/eligible-food-items
● http://www.theblaze.com/stories/2014/02/17/see-the-eye-popping-chart-about-food-
stamps-and-the-military/
● http://www.foxnews.com/health/2012/06/12/report-wants-to-know-how-much-soda-is-
bought-with-food-stamps/
● http://www.fns.usda.gov/pd/34snapmonthly.htm
● http://www.fns.usda.gov/pd/snapmain.htm
● http://www.fns.usda.gov/data-and-statistics
Here are some maps I made for the food in New Brunswick:
https://docs.google.com/document/d/1OYbSaJB1E2hPSMFncOpmvwmiXK3X_t2CUeMkcd9S5
nI/edit?usp=sharing
EA 2/24:
http://articles.latimes.com/2012/sep/18/news/la-heb-snap-food-program-billions-sugary-soft-
drinks-20120918
Request For Information (RFI) SNAP Food Purchases:
This RFI is being published to identify industry capabilities and compare the feasibility of
obtaining and analyzing nationally representative food purchase data maintained by large store
chains, loyalty card companies and/or other commercial sources to determine what types of
foods are purchased by participants in the Supplemental Nutrition Assistant Program (SNAP,
formerly known as the Food Stamp Program).
The North American Industry Classification Systems (NAICS) Code proposed for the
requirement is 541611, Administrative Management and General Management Consulting
28. 28
Services. The size standard for NAICS 541611 is $5M. Comments on this NAICS and
suggestions for alternatives must include supporting rationale.
1.0 BACKGROUND
SNAP helps put food on the table for some 31 million people per month in FY 2009. It provides
low-income households with electronic benefits they can use like cash at most grocery stores.
SNAP is the cornerstone of the Federal food assistance programs, and provides crucial support
to needy households and to those making the transition from welfare to work.
The U.S. Department of Agriculture administers SNAP at the Federal level through its Food and
Nutrition Service (FNS). State agencies administer the program at State and local levels,
including determination of eligibility and allotments, and distribution of benefits.
All 50 States have made the transition from paper coupons to the Electronic Benefit Transfer
(EBT) card. The EBT card is like a debit card and can be used at USDA-authorized grocery
stores across the country. At the cash register, the customer or cashier swipes the EBT card
through the card reader at the point of sale and the customer enters a personal identification
number to secure the transaction. The system deducts the exact dollar amount of the purchase
from the customer's EBT account and deposits it into the retailer's bank account. Once the
SNAP EBT transaction is complete, a receipt shows the amount of the SNAP purchase and the
amount of SNAP benefits remaining in the EBT account. In June 2004, SNAP completed a
transformation from paper coupons to an electronic benefits transfer (EBT) card. Participants
receive a plastic EBT card (similar to a bank debit card) with the dollar amount for which they
are eligible each month.
The Women, Infants and Children program (WIC) provides Federal grants to States for
supplemental foods, health care referrals, and nutrition education for low-income pregnant,
breastfeeding, and non-breastfeeding postpartum women, and to infants and children up to age
five who are found to be at nutritional risk.
2.0 STUDY OBJECTIVES
All available evidence indicates that the diets and food choices of most Americans are less than
ideal, and that the diets and food choices of low-income individuals are most striking in their
similarity rather than their differences with higher income individuals. Concern is frequently
expressed that SNAP benefits are spent on unhealthy foods, however, no data exists that
identifies the types of foods SNAP recipients purchase with their benefits.
Therefore, this study has three objectives:
29. 29
1) Identify and compare the feasibility of obtaining and analyzing food purchase data - from
large store chains, loyalty card companies and other commercial sources that offer nationally
representative information.
2) Obtain and examine one or more of these extant data bases to examine the proportion of
SNAP benefits spent on different foods. If store sales and EBT transaction data can be linked at
the household level, purchase patterns can be examined by benefit amount.
3) Explore the feasibility of obtaining and analyzing data on foods purchased by WIC clients.
Information obtained from this study can inform policy, nutrition education and environmental
initiatives to enhance the food choices of participants.
3.0 SUBMISSION INFORMATION
FNS is seeking information on available data and on firms capable of identifying, obtaining and
analyzing food purchase data - from large store chains, loyalty card companies and other
commercial sources that offer nationally representative information. Descriptive and multivariate
analyses on this data will be required. This data needs to identify, at a minimum down to the
product category level, (fruits, vegetables, beverages, baked goods, dairy, snack foods etc.)
purchased with SNAP benefits. Information on the generalizabilty of the data, as well as an
indication of sample sizes, regional distribution and other data robustness indicators should be
discussed.
Interested firms may submit product descriptions or capability statements that demonstrate its
ability to perform all elements of the requirement as described in this notice.
All responses must be submitted to david.mugan@fns.usda.gov no later than 4PM Eastern
Standard Time, February 15, 2011.
Any information provided by industry to the Government as a result of this RFI notice is strictly
voluntary. Responses will not be returned. No entitlements to payment of direct or indirect costs
or charges to the Government will arise as a result of contractor submission of responses, or the
Government's use of such information. The information obtained from responses to this notice
may be used in the development of an acquisition strategy and future RFP.
KR 2/24
30. 30
http://www.ncbi.nlm.nih.gov/pmc/articles/PMC2571048/ general cultural findings on obesity:
link explores these questions: What are the prevalence, severity, and consequences of
childhood obesity across race/ethnicity in the U.S.? How might socioeconomic factors influence
racial/ethnic differences in childhood obesity? What are the biological and cultural factors
associated with racial/ethnic differences in childhood obesity? What are the implications of
race/ethnicity on the prevention of childhood obesity? What are the implications of
race/ethnicity on the treatment of childhood obesity?
Race and ethnicity are terms used to categorize populations on the basis of shared
characteristics. Race has traditionally been used to categorize populations on the basis of
shared biological characteristics such as genes, skin color, and other observable features.
Ethnicity is used to categorize on the basis of cultural characteristics such as shared language,
ancestry, religious traditions, dietary preferences, and history. Although ethnic groups can share
a range of phenotypic characteristics due to their shared ancestry, the term is typically used to
highlight cultural and social characteristics instead of biological ones (3). Both race and
ethnicity are, in fact, social constructs. The assumption that race reflects only biological
distinctions is inaccurate. Categories based on race account for only 3–7% of total human
genetic diversity, are not reliably measured, and are not always biologically meaningful (3,4).
Furthermore, both race and ethnicity are constantly evolving concepts, making the task of
comparing groups or following the same group over time quite challenging. For instance, the
increasing proportion of the U.S. population describing their race as “mixed” or “other,” as well
as changes in ethnic self-identification across generations and occasionally even within the
same generation, makes it difficult to assign individuals to invariant categories of race or
ethnicity. Nevertheless, the social importance given to these constructs to describe groups that
have been treated in similar ways based on presumed biological characteristics, as well as the
acknowledgment that such classifications themselves have contributed to inequalities in health
and health care access, necessitates that we continue to use the terms race and ethnicity.
Although childhood obesity is increasing in all ethnic and racial groups, its prev-alence is higher
in nonwhite populations. The reasons for the differences in prevalence of childhood obesity
among groups are complex, likely involving genetics, physiology, culture, socioeconomic status
(SES), environment, and interactions among these variables as well as others not fully
recognized. Understanding the influence of these variables on the patterns of eating and
physical activity that lead to obesity will be critical to developing public policies and effective
clinical interventions to prevent and treat childhood obesity.
Prevalence and severity Obesity has reached epidemic proportions in the U.S. It has increased
in both sexes and in all racial, ethnic, and socioeconomic groups. The prevalence of obesity has
tripled since 1980 among children 6–11 years of age and adolescents 12–17 years of age,
according to the National Health and Nutrition Examination Survey (NHANES) (5). The overall
prevalence of obesity in children in the U.S. was 17% in 2004 (6). A subsequent analysis (7)
31. 31
suggested that the prevalence may have reached a plateau, although further tracking of data
will be needed to confirm or refute this. The prevalence of childhood obesity among African
Americans, Mexican Americans, and Native Americans exceeds that of other ethnic groups. The
Centers for Disease Control reported that in 2000 the prevalence of obesity was 19% of non-
Hispanic black children and 20% of Mexican American children, compared with 11% of non-
Hispanic white children. The increase since 1980 is particularly evident among non-Hispanic
black and Mexican American adolescents.
Culture Culture is a system of shared understandings that shapes and, in turn, is shaped by
experience. Culture provides meaning to a set of rules for behavior that are normative (what
everyone should do) and pragmatic (how to do it). Culture, unlike instinct, is learned; is
distributed within a group in that not everyone possesses the same knowledge, attitudes, or
practices; enables us to communicate with one another and behave in ways that are mutually
interpretable; and exists in a social setting. Among the shared understandings embodied by a
culture are those pertaining to obesity, including understanding of its cause, course, and cure,
and the extent to which a society or ethnic group views obesity as an illness. Illness is shaped
by cultural factors governing perception, labeling, explanation, and valuation of the
discomforting experiences (39). Because illness experience is an intimate part of social systems
of meaning and rules for behavior, it is strongly influenced by culture. As with race and
ethnicity, culture is a dynamic construct in that shared understandings change over time as they
are shaped or informed by the experience of individual members of a group or the entire group.
For instance, beliefs relating the normative and pragmatic rules for engaging in health-
promoting behavior (diet and exercise) or leisure activity (watching television or playing video
games) will change as individual members of an ethnic group experience and come to value
innovative practices, while losing interest in and thereby disvaluing traditional practices.
Cultural variation in the population is maintained by migration of new groups, residential
segregation of groups defined by their culture and ethnicity, the maintenance of language of
origin by the first and, to a lesser degree, the second generation of immigrants, and the
existence of formal social organizations (religious institutions, clubs, community or family-based
associations). In contrast, globalization and acculturation simultaneously promote cultural
change and cultural homogeneity. Globalization, a social process in which the constraints of
geography on social and cultural arrangements recede, can affect obesity through the
promotion of travel (e.g., migration of populations from low-income to high-income countries),
trade (e.g., production and distribution of high-fat, energy-dense food and flow of investment in
food processing and retailing across borders), communication (promotional food marketing), the
increased gap between rich and poor, and the epidemiologic transition in global burden of
disease (40). Acculturation (changes of original cultural patterns of one or more groups when
they come into continuous contact with one another) can affect obesity by encouraging the
abandonment of traditional beliefs and behaviors that minimize the risk of overweight and the
adoption of beliefs and behaviors that increase the risk of overweight. With both acculturation
32. 32
and globalization there are changes in preferences for certain foods and forms of
leisure/physical activity, as well as educational and economic opportunities. These changes
may differ by ethnic groups. For instance, first-generation Asian and Latino adolescents have
been found to have higher fruit and vegetable consumption and lower soda consumption than
whites. With succeeding generations, the intake of these items by Asians remains stable. In
contrast, fruit and vegetable consumption by Latinos decreases while their soda consumption
increases, so that by the third generation their nutrition is poorer than that of whites (41).
Acculturation to the U.S. is also significantly associated with lower frequency of physical activity
participation in 7th-grade Latino and Asian American adolescents (42). In much of the world,
traditional diets high in complex carbohydrates and fiber have been replaced with high-fat,
energy-dense diets. Rural migrants abandon traditional diets rich in vegetables and cereal in
favor of processed foods and animal products. In the U.S. and abroad, globalization has been
linked to fewer home cooked meals, more calories consumed in restaurants, increased
snacking between meals, and increased availability of fast foods in schools (43). Similarly, there
have been changes in patterns of physical activity linked to risk of obesity in both adults and
children worldwide, including increased use of motorized transport, fewer opportunities for
recreational physical activity, and increased sedentary recreation
Behavior change tools that are culturally sensitive should be used. Being aware of community
resources may help with healthy lifestyle adaptations. Discussion should include factors such as
televisions in bedrooms, eating while watching television, lack of family meals, quality of snacks,
frequency of eating at fast food restaurants, skipping breakfast, drinking soda versus water, and
consuming fruits and vegetables. Clinicians should be aware that Hispanic boys and African
American girls are at greatest risk for obesity. → reasons for this trend culturally?
later on the study again cites schools as environments that shape eating habits, which ties into
Michelle Obama’s mission
AR 2/25
http://www.sciencedaily.com/releases/2009/08/090810122139.htm
-Researchers found that the average user of food stamps had a Body Mass Index (BMI) 1.15
points higher than non-users
-The study also found that people’s BMI increased faster when they were on food stamps than
when they were not, and increased more the longer they were in the program.
-The average food stamp users saw their BMI go up 0.4 points per year when they were in the
program, compared to 0.07 points per year before and 0.2 points per year after they no longer
received the benefits.
-Government statistics showed that the average recipient received $81 in food stamps per month
in 2002, the last year examined in this study.
http://www.statisticbrain.com/food-stamp-statistics/
breakdown of number of people over the last few years and the amount per month they recieve
33. 33
http://www.pewresearch.org/fact-tank/2013/07/12/the-politics-and-demographics-of-food-stamp-
recipients/
EA 2/26:
United States Children and Family Food Insecurities:
Seventeen million U.S. households are food insecure—without steady and dependable access
to enough food to support active, healthy lives for all household members. Numerous studies
have linked limited or uncertain access to adequate food to poorer nutritional, physical and
mental health among adults and children. Although food insecurity and obesity would appear to
be contradictory issues, there is growing concern that they are related.
This research synthesis finds little evidence of a direct link for children. It reviews studies
examining the possible relationship between food insecurity and obesity in the United States,
with a focus on children and families. It also examines studies on whether federal nutrition
assistance programs play any role in increased risk of obesity among youths and adults.
“Food Insecurity and Risk for Obesity Among Children and Families: Is There a Relationship?”
was prepared by Nicole Larson and Mary Story of Healthy Eating Research, a national program
of the Robert Wood Johnson Foundation.
Key results highlighted in the synthesis include:
● Although a few studies have found that children living in food-insecure households are
more likely to be obese than children who have adequate food access, most studies
have found no evidence of a direct relationship.
● Women who experience food insecurity are more likely to be obese than women who
are food secure. But it is unclear whether food insecurity promotes weight gain over
time. Research among men has not consistently shown a relationship between food
insecurity and increased weight.
● Research does not suggest that use of federal Supplemental Nutrition Assistance
Program benefits promotes obesity among children.
● Few studies have examined whether there is a relationship between participation in
other food and nutrition assistance programs and risk for obesity in youths. However,
there is little evidence that participation in the Special Supplemental Nutrition Program
for Women, Infants and Children (WIC), the National School Lunch Program or the
School Breakfast Program increases risk for obesity.
http://www.rwjf.org/en/research-publications/find-rwjf-research/2010/04/food-insecurity--among-
children-and-families.html
New Brunswick Childhood Obesity:
● School BMI: New Brunswick children are more likely to be overweight or obese
compared to their national counterparts. The rates for obesity are highest among males,
younger children, and Hispanic children. The largest differences between New
34. 34
Brunswick public school children and national estimates are seen among the youngest
children (48% in New Brunswick versus 21% nationally for overweight and obese).
● Food Behaviors: Almost all of New Brunswick children (88%) do not meet
recommendations for vegetable consumption. Non-Hispanic Black children also
frequently consume energy-dense foods such as fast food and sugar-sweetened
beverages.
● Food Environment: Although most parents shop at supermarkets and superstores,
nearly one-quarter of Hispanic parents shop at corner stores or bodegas for most of their
food shopping. About half report limited availability of fresh produce and low-fat items at
their main food shopping store. Forty percent of families do not food-shop in their
neighborhood. Cost is the main reason for choice of a food store.
● Physical Activity Behaviors: Almost all children do not meet the guidelines for being
physically active for 60 minutes each day. In addition, a large proportion of non-Hispanic
Black children spend more than two hours watching television, using the computer and
playing video games. The majority of children do not walk or bike to school and some do
not use the sidewalks, parks and exercise facilities available in their neighborhoods.
Almost half do not live near exercise facilities and many do not have parks nearby.
● Physical Activity Environment: Although many neighborhoods have sidewalks and some
have parks and exercise facilities, a fair number of parents report that their children do
not use these facilities to be active. Traffic, crime level, pleasantness of neighborhoods
and parks, and condition of sidewalks are the most commonly reported barriers.
Effective interventions will require changes in the neighborhood environment by creating
new opportunities, improving existing features, and addressing barriers associated with
practicing healthy behaviors. Efforts are also needed to raise awareness about the issue
of childhood obesity and associated behaviors among parents and caregivers.
http://www.rwjf.org/en/research-publications/find-rwjf-research/2010/08/new-jersey-childhood-
obesity-study--new-brunswick-food-environme.html
New Brunswick Food Environment Maps:
http://www.rwjf.org/content/dam/farm/reports/charts/2013/rwjf69265
OUTLINE
Obesity as a problem--Amanda
● among minorities: http://www.ncbi.nlm.nih.gov/pmc/articles/PMC2571048/ general cultural findings on
obesity:
● provide national and local statistics → http://www.cshp.rutgers.edu/Downloads/8660.pdf
● Numerous causes of childhood obesity have been cited, among them being genetic predisposition,
psychologicalfactors such as eating disorders, and learned habits. Learned habits develop at a young age
and are influenced by parental habits and cultural elements.
○ http://www.ncbi.nlm.nih.gov/pmc/articles/PMC1280362/
■ approximately 9 million American children over 6 years of age are considered obese
● In the past three decades,it has more than doubled in children aged 2–5 and 12–
19, and more than tripled in children aged 6–11.
35. 35
■ The local socioeconomic environment, with often profound disparities in physicaland
financial access to healthy foods and physical activity, may contribute to the obes ity
epidemic, particularly among minority groups,who tend to suffer even higher obesity
rates than the general population.
○ http://www.nccor.org/downloads/ChildhoodObesity_020509.pdf (takes into account culture)
■ Overweight adolescents aged 12-17 years consume between 700 to 1,000 more calories
per day than what’s needed for the growth, physical activity and body function of a
healthy weight teen. Over the course of 10 years, this excess can pack on 57 unnecessary
pounds.
■ Children and adolescents aged 8-18 years spend,on average, more than six hours per day
watching television, playing video games and using other types of media
■ In 2001, 16% of school-aged children walked or biked to schoolas compared to 42% in
1969.
● Compare national to New Brunswick for reference
○ http://www.rwjf.org/en/research-publications/find-rwjf-research/2010/01/new-jersey-childhood-
obesity-study--new-brunswick-school-bmi-dat.html
■ The largest differences between New Brunswick public schoolchildren and national
estimates are seen among the youngest children (48% in New Brunswick versus 21%
nationally for overweight and obese).
■ Almost all of New Brunswick children (88%) do not meet recommendations for
vegetable consumption.
■ Cost is the main reason for choice of a food store.
■ Almost all children do not meet the guidelines for being physically active for 60 minutes
each day.
● Traffic, crime level, pleasantness ofneighborhoods and parks,and condition of
sidewalks are the most commonly reported barriers.
○ http://www.cshp.rutgers.edu/Downloads/8660.pdf Rutgers Childhood Obesity Study
■ Compared to the national data,a higher percentage of New Brunswick public school
children in all age categories are overweight or obese
■ a vast majority of parents of New Brunswick children do not think their children are
overweight or obese.
■ 24% of the children eat vegetables LESS THAN ONE time per day.
■ 28% of New Brunswick parents with children ages 3–18 report that they sometimes or
often do not have enough food at home to eat.
Talk about the different kinds of food stamps (http://www.fns.usda.gov/programs-and-services)-- Emeka
● SNAP – Supplemental Nutrition Assistance Program
○ “SNAP (formerly the Food Stamp Program) puts healthy food within reach for 28 million people
each month via an EBT card used to purchase food at most grocery stores .Through nutrition
education partners, SNAP helps clients learn to make healthy eating and active lifestyle choices.”
■ http://www.ers.usda.gov/data-products/supplemental-nutrition-assistance-program-
(snap)-data-system/go-to-the-map.aspx#.UwT0G0JdUwI
● WIC – Women, Infants, Children
○ “The Special Supplemental Nutrition Program for Women, Infants,and Children - betterknown as
the WIC Program - serves to safeguard the health of low-income women, infants,& children up to
age 5 who are at nutritional risk by providing nutritious foods to supplement diets, information on
healthy eating, and referrals to health care.” and others (a short description)