Nutrition assessment in children- dr harivansh chopra
•
22 likes•12,798 views

Assessment of nutritional status especially in vulnerable population is important for taking prompt action. young children are the most affected proportion of the population in the world.In community settings, rapid methods of assessment are important tools to identify children suffering from both macro and micro deficiencies .This is pictorial presentation showing various methods as well as pictures of deficiencies

Recommended
More Related Content
What's hot
What's hot (20)
Similar to Nutrition assessment in children- dr harivansh chopra
Similar to Nutrition assessment in children- dr harivansh chopra (20)
More from Harivansh Chopra
More from Harivansh Chopra (20)
Recently uploaded
Recently uploaded (20)
Nutrition assessment in children- dr harivansh chopra
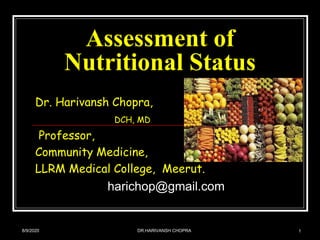
- 1. Assessment of Nutritional Status Dr. Harivansh Chopra, DCH, MD Professor, Community Medicine, LLRM Medical College, Meerut. harichop@gmail.com 8/9/2020 1DR.HARIVANSH CHOPRA
- 2. DR.HARIVANSH CHOPRA Objectives 1. To learn the various methods used for assessing the nutritional status. 2. To learn the Normal Growth pattern of children. 3. To learn the age independent parameters and indices utilised in the community. 8/9/2020 2
- 3. DR.HARIVANSH CHOPRA Methods of Nutritional Assessment in Natural History of Disease Prepathogenic period Period of Pathogenesis Diminishing Reserves Physiological & Metabolic alterations Reserves Exhausted Non-specific Signs and symptoms D E A T H Food Balance Sheets Dietary Surveys Mortality Data Clinical Signs & Mortality Anthropometric Studies Biochemical Studies 8/9/2020 3
- 4. DR.HARIVANSH CHOPRA Assessment of Nutritional Status 1. Clinical Examination. 2. Anthropometry. 3. Biochemical evaluation. 4. Functional assessment. 8/9/2020 4
- 5. DR.HARIVANSH CHOPRA Assessment of Nutritional Status 5. Assessment of dietary intake. 6. Vital and Health statistics. 7. Ecological studies 8/9/2020 5
- 6. DR.HARIVANSH CHOPRA 1. Clinical Assessment 1. General Appearance: Thin built Sickly 8/9/2020 6
- 7. DR.HARIVANSH CHOPRA 1. Clinical Assessment 2. Hair : Lack of lusture Dyspigmented Thin and Sparse Easily pluckable Flag sign (Kwashiorkar) 8/9/2020 7
- 8. DR.HARIVANSH CHOPRA 1. Clinical Assessment 3. Head: Craniotabes, Frontal bossing, Parietal bossing, Caput quadratum, Delayed closure AF (Vit. D deficiency) 8/9/2020 8
- 9. 8/9/2020 DR.HARIVANSH CHOPRA 9 1. Clinical Assessment CRANIO TABES
- 10. DR.HARIVANSH CHOPRA 1. Clinical Assessment 4. Face : Diffuse pigmentation, Nasolabial dyssebacea (Vitamin B12 deficiency), Moon face (Kwashiorkar). 8/9/2020 10
- 11. DR.HARIVANSH CHOPRA 1. Clinical Assessment 5. Eyes : i. Conjunctiva – Dryness, Bitot’s Spot (Vit. A def.), Pale Conjunctiva (Fe def.) ii. Cornea – Dryness, Haziness or Opacity (Vit. A def.), Corneal vascularisation (Riboflavin def.) 8/9/2020 11
- 12. DR.HARIVANSH CHOPRA 1. Clinical Assessment 6. Lips : Angular Stomatitis, Cheilosis (Vit. B12 & Folate deficiency) 8/9/2020 12
- 13. DR.HARIVANSH CHOPRA 1. Clinical Assessment 7. Tongue : Pale & Flabby, Red & Raw, Fissured, Geographic (Vit. B- complex def.) 8/9/2020 13
- 14. DR.HARIVANSH CHOPRA 1. Clinical Assessment 8. Teeth : Mottled Enamel, Caries, Attrition, Delayed and irregular eruptions (Vit. D def.) 8/9/2020 14
- 15. DR.HARIVANSH CHOPRA 1. Clinical Assessment 9. Gums : Spongy, Bleeding (Vit. C deficiency) 8/9/2020 15
- 16. DR.HARIVANSH CHOPRA 1. Clinical Assessment 10. Glands : Thyroid enlargement (Iodine deficiency) 8/9/2020 16
- 17. DR.HARIVANSH CHOPRA 1. Clinical Assessment 11. Neck : Casal necklace (Niacin def.) 8/9/2020 17
- 18. DR.HARIVANSH CHOPRA 1. Clinical Assessment 12. Chest: Pigeon Chest, Beading of ribs (Vit. D def.), Rachitic rosary, Scorbutic rosary (Vit. C def.), Cardiomegaly, Tachycardia (Thiamine Def.) 8/9/2020 18
- 19. DR.HARIVANSH CHOPRA 1. Clinical Assessment 13. Abdomen: Harrison’s sulcus, Pot belly (Vit. D def.) Hepatomegaly (PEM) Scrotal and Vulval dermatosis 8/9/2020 19
- 20. DR.HARIVANSH CHOPRA 1. Clinical Assessment 13. Abdomen: Harrison’s sulcus, Pot belly (Vit. D def.) Hepatomegaly (PEM) Scrotal and Vulval dermatosis 8/9/2020 20
- 21. DR.HARIVANSH CHOPRA 1. Clinical Assessment 14. Spine: Kyphosis, Scoliosis, Rachitic pelvis (Vit. D def.) 8/9/2020 21
- 22. DR.HARIVANSH CHOPRA 1. Clinical Assessment 15. Limbs: Oedema, Epiphyseal enlargement, Knock Knee or Bow Legs (Vit. D def.), Muscle wasting, Oedema (PEM) Motor weakness, Calf tenderness (Thiamine def.) Frog leg position (Vit. C def.) 8/9/2020 22
- 23. DR.HARIVANSH CHOPRA 1. Clinical Assessment 15. Limbs: Oedema, Epiphyseal enlargement, Knock Knee or Bow Legs (Vit. D def.), Muscle wasting, Oedema (PEM) Motor weakness, Calf tenderness (Thiamine def.) Frog leg position (Vit. C def.) 8/9/2020 23
- 24. DR.HARIVANSH CHOPRA 1. Clinical Assessment 16. Skin : Dry & Scaly, Follicular hyperkeratosis, Flaky Paint Dermatosis (PEM) Petechiae (Vit. C def.) Pellagrous Dermatosis (Niacin def.) Acrodermatitis (Zn def.) 8/9/2020 24
- 25. DR.HARIVANSH CHOPRA 1. Clinical Assessment 17. Nails : Koilonychias (Fe def.) 8/9/2020 25
- 26. DR.HARIVANSH CHOPRA 2. Anthropometry Terminology – 1. Measurements : Age, Weight, Height/Length/Stature. 2. Indices : Weight for Height, Height for Age, BMI, etc. 3. Indicator : Cut-off points, Standards. 8/9/2020 26
- 27. DR.HARIVANSH CHOPRA 2. Anthropometry 1. Most commonly used Anthropometric Indices are age dependent. 2. For making comparisons, Normal growth may be obtained from International Reference Population data, or by various formulae. 8/9/2020 27
- 28. DR.HARIVANSH CHOPRA 2A. Anthropometry – International Reference Population 1. Harvard Growth Curves – 1966. 2. National Centre for Health Statistics – 1970. Current usage. 3. W H O CHILD GROWTH STANDARDS These are based on multicentre growth reference study done in Brazil,Ghana,India,Norway,Oman and USA between 1997-2003 8/9/2020 28
- 29. DR.HARIVANSH CHOPRA NORMAL GROWTH Normal Growth may be defined as the level of growth which is (and can be) attained by the child when its innate genetic potential for growth finds full expression – in a situation wherein dietary and environmental constrains on growth are eliminated. 8/9/2020 29
- 30. DR.HARIVANSH CHOPRA 2B. Anthropometry – Growth in Childhood Growth velocity Growth Velocity is maximum in the first year of life. Even in the first year Growth Velocity is maximum in first 4 months. 384 55 505084.3 384 55 505084.3 8/9/2020 30
- 31. DR.HARIVANSH CHOPRA 2B. Anthropometry – Weight Gain in Childhood 1. From 1 – 6 years, the weight gain (in kg.) can be calculated by the formula (Age in years X 2) + 8. 2. From 7 – 12 yrs, the formula is (Age in years X 7) – 5 2 384 55 505084.3 384 55 505084.3 8/9/2020 31
- 32. DR.HARIVANSH CHOPRA 2B. Anthropometry – Gain in Height / Length 1. Length at birth = 50 cm. 2. Length at 1 year = 75 cm. 3. Length at 2 years = 87 cm. 4. Height gain (in cm.) during 2 – 12 yrs. of life = (Age in years X 6) + 77. 384 55 505084.3 384 55 505084.3 8/9/2020 32
- 33. DR.HARIVANSH CHOPRA 2B. Anthropometry – Head Circumference 1. At birth = 34 cm. 2. At 3 months = 40 cm. 3. At 12 months = 47 cm. 4. At 2 years = 49 cm. 8/9/2020 33
- 34. DR.HARIVANSH CHOPRA 2B. Anthropometry – Chest Circumference 1. At birth it is 3 cm. less than head circumference. 2. Equals head circumference at 1 year. 3. Exceeds head circumference after 2 years of life. 8/9/2020 34
- 35. DR.HARIVANSH CHOPRA 2C. Anthropometry – Knowing the Age of child 1. Documentary evidence like “Birth Certificate”, “Clinic care”, or “Horoscope”, etc. (if available). 2. Ask from mother (Cross-checking is necessary as errors in recall is common). 3. Age recorded up to the nearest month or year. 8/9/2020 35
- 36. 8/9/2020 DR.HARIVANSH CHOPRA 36 Types of weighing machines
- 37. Types of weighing machines 8/9/2020 DR.HARIVANSH CHOPRA 37
- 38. DR.HARIVANSH CHOPRA 2C. Anthropometry – Weight of child 1. For measuring weight of infants and young children, pan type weighing scale should be used. 2. A beam scale with non-detachable weights may be used. 3. Alternatively, a Salter Scale or a Uniscale may be used. 8/9/2020 38
- 39. DR.HARIVANSH CHOPRA 2C. Anthropometry – Weight of child 1. Use of a Salter Scale for measuring weight. 2. Requires a Measurer and an Assistant (better if the mother). 3. Measure weight upto the nearest 0.1 kg. Method and Correct use of a Salter Scale http://www.fantaproject.org/downloads/pdfs/anthro_5.pdf 8/9/2020 39
- 40. DR.HARIVANSH CHOPRA 2C. Anthropometry – Weight of child 1. Reduce the clothing of child to minimum. 2. Measure weight of mother + child, and then mother alone. The difference gives the weight of child. 3. Calculate to nearest 0.1 kg. Method and Correct use of a UNISCALE http://www.fantaproject.org/downloads/pdfs/anthro_5.pdf 8/9/2020 40
- 41. DR.HARIVANSH CHOPRA 2C. Anthropometry – Weight of child Tare scale 1. Reduce the clothing of child to minimum. 2. Measure weight of mother + child, and then mother alone. The difference gives the weight of child. 3. Calculate to nearest 0.1 kg. Method and Correct use of a UNISCALE http://www.fantaproject.org/downloads/pdfs/anthro_5.pdf 8/9/2020 41
- 42. DR.HARIVANSH CHOPRA 2C. Anthropometry – Length of child 1. Use of a measuring board for child 0 – 23 months of age. 2. Requires a Measurer and an Assistant. 3. length recorded upto the nearest 0.1 cm. Method and Correct use of a measuring board http://www.fantaproject.org/downloads/pdfs/anthro_5.pdf 8/9/2020 42
- 43. DR.HARIVANSH CHOPRA 2C. Anthropometry – Height of child 1. Use of a measuring board for child >24 months of age. 2. Requires a Measurer and an Assistant. 3. Height recorded upto the nearest 0.1 cm. Method and Correct use of a measuring board http://www.fantaproject.org/downloads/pdfs/anthro_5.pdf 8/9/2020 43
- 46. DR.HARIVANSH CHOPRA 2C. Anthropometry – Chest circumference 1. Horizontal girth of trunk measured at arms eye height, passing just above the level of nipples on anterior chest. 2. Measuring tape is used. 3. The measurement made up to the nearest 0.1 cm. 8/9/2020 46
- 47. DR.HARIVANSH CHOPRA 2C. Anthropometry – Head Circumference of child Lower edge of the measuring tape just above the child's eyebrows, above the ears and around the occipital prominence at the back of the head. Pull the tape to compress the hair. The objective is to measure the maximal head circumference. 8/9/2020 47
- 48. DR.HARIVANSH CHOPRA 2D. Anthropometry – Age independent Anthropometry 1. In field conditions, it is very difficult to know the exact age of the children, especially if the parents are illiterate. 2. To overcome this, Age Independent Parameters and Indices are utilised. 8/9/2020 48
- 49. DR.HARIVANSH CHOPRA 2D. Anthropometry – Mid-Upper Arm Circumference 1. Used for children 1 – 5 years of age. 2. Measured in left arm with arms hanging by side. Measuring the MUAC of child using Insertion Tape http://www.fantaproject.org/downloads/pdfs/anthro_5.pdf 8/9/2020 49
- 50. DR.HARIVANSH CHOPRA 2D. Anthropometry – (MUAC) Applicable for 1 – 5 years age group. 1. Normal : > 13.5 cm. 2. Boderline Malnutrition : 12.5 – 13.5 cm. 3. Malnutrition : < 12.5 cm. 8/9/2020 50
- 51. DR.HARIVANSH CHOPRA 2D. Anthropometry – (MUAC) – Shakir Tape Method Shakir & Morley Tape 12.5 cm 13.5 cm 8/9/2020 51
- 52. DR.HARIVANSH CHOPRA 2D. Anthropometry – (MUAC) – Bangle Method Bangle Test 4 cm If bangle crosses the elbow, the child is malnourished. 8/9/2020 52
- 53. DR.HARIVANSH CHOPRA 2D. Anthropometry – MUAC – Quac-Stick Method Simple, Easy, Inexpensive, yet Reliable method for detecting Early Malnutrition of Acute Onset. Qu : Quacker. A : Arm. C : Circumference. 8/9/2020 53
- 54. DR.HARIVANSH CHOPRA Maximum left arm circumference – the arm hanging by the side of body – is recorded. QUAC stick consists of a stick graduated with figures for MUAC in relation to height. 2D. Anthropometry – MUAC – Quac-Stick Method 8/9/2020 54
- 55. DR.HARIVANSH CHOPRA The child is made to stand in front of the QUAC stick. From the graduations in the stick, his nutritional status in terms of 50, 60, 70 or 80% of the standard can be easily read. 14.0 13.9 13.8 13.7 13.6 13.5 12.8 12.7 12.6 12.5 12.3 12.2 12.1 12.0 11.8 11.7 11.5 11.3 11.1 10.9 15.2 14.9 14.5 14.4 14.2 14.1 13.8 13.6 13.0 12.9 12.8 12.7 12.6 12.5 12.4 12.2 12.0 15.2 15.0 14.8 14.7 14.5 14.4 14.3 14.2 14.0 13.9 13.7 13.6 13.5 13.4 13.1 12.8 15.5 15.4 15.3 15.2 15.1 15.0 14.9 14.8 14.7 14.6 14.5 14.4 14.3 13.9 13.7 13.5 120 115 110 105 100 95 90 85 80 75 70 80% 70% 60% 50% 2D. Anthropometry – MUAC – Quac-Stick Method 8/9/2020 55
- 56. DR.HARIVANSH CHOPRA 2D. Anthropometry – Triceps skin fold thickness Measured by a standard caliper (Lange or Herpenden). Used for children 1 – 6 years of age. 1. Normal Child: > 10 mm. 2. Mild Malnutrition: 6 – 10 mm. 3. Moderate to gross Malnutrition: < 6 mm. 8/9/2020 56
- 57. DR.HARIVANSH CHOPRA 2D. Anthropometry – Rao and Singh’s Index 1. Relationship between height and weight. 2. Given by formula: Weight (in kg) x 100 Height (in cm2) 3. Normal range is 0.14 – 0.16. 4. Gross malnutrition < 0.14. 5. Reliable indicator. 8/9/2020 58
- 58. DR.HARIVANSH CHOPRA 2D. Anthropometry – Quetelet Index 1. Relationship between height and weight. 2. Given by formula: Weight (in kg) Height (in m2) 3. Normal range is 3rd to 85th Percentile 4. malnutrition < 3rd percentile. 5. As per WHO BMI Charts. 8/9/2020 59
- 59. 8/9/2020 DR.HARIVANSH CHOPRA 60
- 60. 8/9/2020 DR.HARIVANSH CHOPRA 61
- 61. DR.HARIVANSH CHOPRA 2D. Anthropometry – Dugdale Index 1. Based on relationship between weight and height. 2. Given by the formula: Weight (in kg) Height (in cm)1.6 3. Normal value is between 0.88 & 0.79. 4. Value < 0.79 is suggestive of malnutrition. 8/9/2020 62
- 62. DR.HARIVANSH CHOPRA 3. Biochemical Tests 1. Laboratory Tests: 1. Hemoglobin – Reflects overall state of Nutrition. 2. Stools and Urine – Intestinal parasites, Urine albumin and sugar. 2. Biochemical Tests: 1. Measurement of individual Nutrient. 2. Detection of abnormal Metabolites. 3. Measurement of Enzymes. 8/9/2020 64
- 63. DR.HARIVANSH CHOPRA 5. Assessment of Dietary Intake – Weighing of Raw foods 1. Duration of survey may range from 1 – 21 days, but commonly employs 7 days which is called “one dietary cycle”. 2. Involves weighing of all foods going to be cooked. 3. Widely practised in India, Practical, and fairly accurate. 8/9/2020 71
- 64. DR.HARIVANSH CHOPRA 5. Assessment of Dietary Intake – Weighing of Cooked foods 1. Analysis of food in the form in which they are consumed. 2. Not easily acceptable among people. 8/9/2020 72
- 65. DR.HARIVANSH CHOPRA 5. Assessment of Dietary Intake – Oral questionnaire method 1. Useful for dietary survey in large population in short time. 2. Retrospective enquiries made about the nature and quantity of food eaten during previous 24 – 48 hrs. 3. Gives reliable results. 8/9/2020 73
- 66. DR.HARIVANSH CHOPRA 5. Assessment of Dietary Intake – Stock inventory method 1. Measurement of total stock of food. 2. Weight of the total stock and the time in which it is consumed by a definite number of people gives the approximate consumption 8/9/2020 74
- 67. DR.HARIVANSH CHOPRA 5. Assessment of Dietary Intake – the calculation 1. Data collected is translated into mean intake (grams) of food in terms of cereals, pulses, vegetables, fruits, milk, meat, fish and eggs. 2. Mean intake of food per adult man value, or “consumption unit” is calculated. 8/9/2020 75
- 68. DR.HARIVANSH CHOPRA 5. Assessment of Dietary Intake – Uses 1. Provides information about dietary intake patterns, & estimated nutrient intakes. 2. Indicates relative dietary inadequacies as per present standards. 3. Valuable for planning health education activities. 4. Allows an assessment of changes needed in agriculture and food production industries. 8/9/2020 76
- 69. 8/9/2020 DR.HARIVANSH CHOPRA 77 Consumption unit Adult male sedentry 1 moderate 1.2 heavy 1.6 Adult female sedentry .8 moderate .9 heavy 1.2 Child 0-1 Nil 1-3 .4 3-5 .5 5-7 .6 7-9 .7 9-12 .8 12 – 21 ( Adolescent) 1
- 70. DR.HARIVANSH CHOPRA 1. Writer 2. Typist 3. Teacher 4. Peon 5. Postman 6. Barber 7. Executive
- 71. DR.HARIVANSH CHOPRA 1. Carpenter 2. Shoemaker 3. Potter 4. Goldsmith 5. Rickshaw puller 6. Driver 7. Weaver
- 72. DR.HARIVANSH CHOPRA 1. Woodcutter 2. Stone cutter 3. Blacksmith 4. Mineworker
- 73. DR.HARIVANSH CHOPRA 6. Vital Statistics 1. Morbidity data: i. Rate of low birth weight babies. ii. Data on PEM, Anemia, Xerophthalmia, other vitamin deficiencies, Endemic goitre, Diarrhoea, Measles, & Parasitic infestations Through hospital data, community health data, or morbidity surveys. 8/9/2020 81
- 74. DR.HARIVANSH CHOPRA 6. Vital Statistics 2. Mortality data: i. Mortality in 1 – 4 years age group. ii. Infant mortality rate. iii. Second year mortality rate. Mortality data, however, do not provide a satisfactory picture of nutritional status of population. 8/9/2020 82
- 75. DR.HARIVANSH CHOPRA 6. Vital Statistics – Uses 1. Identify the groups at high risk. 2. Indicate the extent of risk to the community. 8/9/2020 83
- 76. DR.HARIVANSH CHOPRA 7. Ecological Factors – Food balance sheet 1. Indirect method of assessing food consumption. 2. Supplies are related to census population to derive levels of food consumption in terms of per capita supply availability. 3. Estimate refers to country as a whole. 8/9/2020 84
- 77. DR.HARIVANSH CHOPRA 7. Ecological Factors – Food balance sheet Disadvantage: Conceals differences occurring between regions, among economic, age & sex groups. Advantage: Cheap. Simple. Gives indication of general food consumption in country. 8/9/2020 85
- 78. DR.HARIVANSH CHOPRA 7. Ecological Factors – Socio-economic factors Food consumption pattern varies with Family size, Occupation, Income, Education, Customs, Cultural patterns, etc. 8/9/2020 86
- 79. DR.HARIVANSH CHOPRA 7. Ecological Factors – Health and Educational Services 1. Primary Health Care Services. 2. Feeding Programmes. 3. Immunization Programmes. 8/9/2020 87
- 80. DR.HARIVANSH CHOPRA 7. Ecological Factors – Conditioning Influences 1. Parasitic, Bacterial and Viral infections which precipitate Malnutrition. 2. Necessity to make an “Ecological Diagnosis” of various factors influencing nutrition in community before it is possible to put into effect measures for prevention and control of malnutrition. 8/9/2020 88
- 81. DR.HARIVANSH CHOPRA Conclusion 1. Out of the seven methods of assessment, only three i.e. Clinical Assessment, Anthropometry, and Dietary Survey are useful in community settings. 2. Age independent anthropometric measurements are most rapid and useful methods of assessment. 8/9/2020 89
- 83. DR.HARIVANSH CHOPRA MCQ 1. Which of the following is most useful method of nutritional assessment in community settings – 1. Biochemical estimation. 2. Dietary survey. 3. Anthropometry. 4. Age-independent Anthropometry. Answer – 4. 8/9/2020 91
- 84. DR.HARIVANSH CHOPRA MCQ 2. Attainment of Normal growth in children is dependent upon – 1. Genetic potential. 2. Environmental factors. 3. Child rearing practices. 4. All of the above. Answer – 4. 8/9/2020 92
- 85. DR.HARIVANSH CHOPRA MCQ 3. Which type of malnutrition can be assessed by Quac-stick method – 1. Acute malnutrition. 2. Chronic malnutrition. 3. Acute-on-chronic malnutrition. 4. None of the above. Answer – 1. 8/9/2020 93
- 86. DR.HARIVANSH CHOPRA MCQ 4. Casal Necklace is a feature of – 1. Thiamine deficiency. 2. Niacin deficiency. 3. Vitamin A deficiency. 4. Vitamin D deficiency. Answer – 2. 8/9/2020 94
- 87. DR.HARIVANSH CHOPRA MCQ 4. Single “dietary cycle” consists of – 1. 2 days. 2. 7 days. 3. 2 weeks. 4. 1 month. Answer – 2. 8/9/2020 95