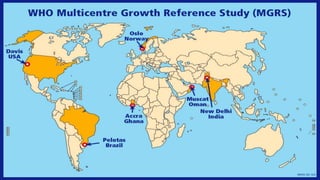
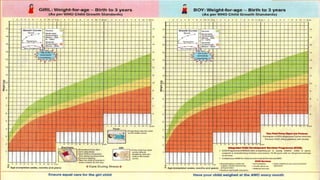
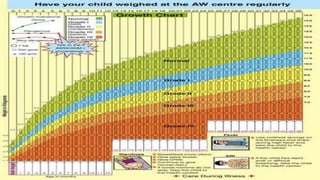
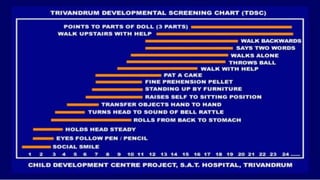
WHO GROWTH CHART &
TRIVANDRUM
DEVELOPMENT SCALE
DR. KRISHNA.D.S
GROWTH CHART
Growth charts are visible display of child’s physical growth
and development. Also called as “road-to-health" chart.
It was first designed by David Morley for growth assessment
and was later modified by WHO
NEED FOR ASSESSMENT
Child growth is monitored to:
Assess adequacy of nutrition
Identify weight status and potential for obesity
Screen for disease related to abnormal growth
HOW GROWTH IS ASSESSED??
• The assessment of growth may be longitudinal or cross sectional.
• Longitudinal assessment of growth entails measuring the same child
at regular intervals.
• Cross sectional comparisons involve large number of children of same
age.
• Basic growth assessment involves measuring a child’s weight and
length or height
HISTORY
• In 1940, data developed by Meredith at Iowa, used for growth
assessment.
• In 1960 and 1970, two other data sets were used, Harvard growth
curves and Tanner growth curves.
• In 1956 and 1965 ICMR undertook a nationwide cross sectional study
and established Indian reference charts.
HISTORY
• In 1977, National Centre for Health and Statistics along with CDC
developed growth curves based on Fel’s longitudinal study from 1929
to 1975.
• In 2000, CDC developed a growth curve based on data from national
health surveys and birth certificates in the U.S
BACKGROUND
In 1993 WHO undertook a comprehensive review of the uses and
interpretation of growth references
Did not adequately represent early childhood growth and that new
growth curves were necessary.
The World Health Assembly endorsed this recommendation in 1994.
In response WHO undertook the Multicentre Growth Reference Study
(MGRS) between 1997 and 2003 to generate new curves for assessing
the growth and development of children.
MGRS
• MGRS combined a longitudinal follow-up from birth to 24 months
and a cross-sectional survey of children aged 18 to 71 months.
• Data gathered from 8440 healthy breastfed infants and young children
from diverse ethnic backgrounds and cultural settings
• Aim- healthy children living under conditions that favour the
achievement of their full genetic growth potential
Criteria for Inclusion
• Access to health care and breastfeeding support
• Full term birth
• No smoking during pregnancy
• Exclusive or primarily breastfeeding > 4 months
• Began feeding solids by 6 months
• Continued breastfeeding > 12 months
The WHO charts support the theory that optimal nutrition +
optimal environment + optimal care = optimal growth
regardless of time, place or ethnicity.
Indicators
• For the assessment WHO has provided charts for both boys and girls (age of
5yrs)
• Growth indicators are used to assess growth,
length/height-for-age
weight-for-age
weight-for-length/height
BMI (body mass index)-for-age
WHO GROWTH CHART
x-axis:
• In WHO Growth chart, x-axes show age. Points plotted on vertical
lines corresponding to completed age (in months, or years)
y-axis:
• y-axes show length/height, weight, or BMI. Points plotted on or
between horizontal lines corresponding to length/height, weight or
BMI as precisely as possible
WHO GROWTH CHART
• Growth curves are constructed using Box Cox Power Exponential
Method (BCPE) along with curve smoothing by cubic splines.
Cut off values……
• WHO growth standards are based on healthy children living in optimal
conditions so more extreme cutoffs are used to identify nutrition
risk.
• WHO charts use 2nd and 98th percentiles as the outermost percentile
cutoff values indicating abnormal growth.
• CDC use 5th and 95th percentile as cut off values.
Interpretation of growth curves
Suspect Risk,
• A child’s growth line crosses a z-score line.
• There is a sharp incline or decline in the child’s growth line.
• The child’s growth line remains flat (stagnant); i.e. there is no gain in
weight or length/height.
Normal growth curve runs parallel to the median curve.
In India….
• India has adopted the new WHO Child Growth Standards (2006) in
February 2009
• These standards are available for both boys and girls below 5 years of
age.
• WHO growth chart has been incorporated with "Mother and Child
Protection Card"
Management
• Weight b/w curves 1 & 3-undernourished,require supplementary
feeding at home
• Weight below curve 3 - consult the doctor and follow his advice.
• Weight below curve 4 - hospitalized for treatment
USES
• Growth monitoring
• Diagnostic tool
• Planning and policy making
• Educational tool
• Tool for action
• Evaluation
• Tool for teaching
TRIVANDRUM DEVELOPMENT SCALE
• Screening tool to test the development delay in children under the age
of 2 yrs
• Developed by Child Development Centre, SAT, Trivandrum
• 17 test items, selected by trial and error from Bayley’s Scale of Infant
Development (Baroda norms).
• Helps to screen motor, mental, hearing and visual development.
How to use TDSC ??
• Left end of the horizontal line represents, the age at which 3% of
children passed the item and right end represents the age at which 97%
of the children passed that item.
• Vertical line is drawn from the chronological age
• Failure to achieve an item that falls short on the left hand side of
vertical line – developmental delay.
VALIDATION OF TDSC
• Done on the sample from coastal Neendakara Panchayath & Baby
Well clinic, SAT. (both in community and at hospital)
• Out of 1945 children screened 49 showed developmental delay.
• Denver Developmental Screening Test (DDST) was used as standard
for validation
TDSC has a sensitivity of 66.7% and specificity of 78.8%
Currently, used by Anganwadi workers in community field survey.
Can be interpreted by any person with minimal training.
Needs 5- 7 minutes
REFERENCES
• WHO. WHO child growth standards. Geneva(Switzerland):
WHO;2007
• World Health Organization. Training Course on Child Growth
Assessment. Geneva, WHO, 2008
• Park K. Textbook of Preventive and Social Medicine. 23rd edition
• AFMC Textbook of Public Health and Community Medicine – 1st
edition
• Trivandrum Developmental Screening Chart MKC Nair, B George, E
Philip
THANK YOU

Who growth chart

  • 1.
    WHO GROWTH CHART& TRIVANDRUM DEVELOPMENT SCALE DR. KRISHNA.D.S
  • 2.
    GROWTH CHART Growth chartsare visible display of child’s physical growth and development. Also called as “road-to-health" chart. It was first designed by David Morley for growth assessment and was later modified by WHO
  • 3.
    NEED FOR ASSESSMENT Childgrowth is monitored to: Assess adequacy of nutrition Identify weight status and potential for obesity Screen for disease related to abnormal growth
  • 4.
    HOW GROWTH ISASSESSED?? • The assessment of growth may be longitudinal or cross sectional. • Longitudinal assessment of growth entails measuring the same child at regular intervals. • Cross sectional comparisons involve large number of children of same age. • Basic growth assessment involves measuring a child’s weight and length or height
  • 5.
    HISTORY • In 1940,data developed by Meredith at Iowa, used for growth assessment. • In 1960 and 1970, two other data sets were used, Harvard growth curves and Tanner growth curves. • In 1956 and 1965 ICMR undertook a nationwide cross sectional study and established Indian reference charts.
  • 6.
    HISTORY • In 1977,National Centre for Health and Statistics along with CDC developed growth curves based on Fel’s longitudinal study from 1929 to 1975. • In 2000, CDC developed a growth curve based on data from national health surveys and birth certificates in the U.S
  • 7.
    BACKGROUND In 1993 WHOundertook a comprehensive review of the uses and interpretation of growth references Did not adequately represent early childhood growth and that new growth curves were necessary. The World Health Assembly endorsed this recommendation in 1994. In response WHO undertook the Multicentre Growth Reference Study (MGRS) between 1997 and 2003 to generate new curves for assessing the growth and development of children.
  • 9.
    MGRS • MGRS combineda longitudinal follow-up from birth to 24 months and a cross-sectional survey of children aged 18 to 71 months. • Data gathered from 8440 healthy breastfed infants and young children from diverse ethnic backgrounds and cultural settings • Aim- healthy children living under conditions that favour the achievement of their full genetic growth potential
  • 10.
    Criteria for Inclusion •Access to health care and breastfeeding support • Full term birth • No smoking during pregnancy • Exclusive or primarily breastfeeding > 4 months • Began feeding solids by 6 months • Continued breastfeeding > 12 months
  • 11.
    The WHO chartssupport the theory that optimal nutrition + optimal environment + optimal care = optimal growth regardless of time, place or ethnicity.
  • 12.
    Indicators • For theassessment WHO has provided charts for both boys and girls (age of 5yrs) • Growth indicators are used to assess growth, length/height-for-age weight-for-age weight-for-length/height BMI (body mass index)-for-age
  • 13.
    WHO GROWTH CHART x-axis: •In WHO Growth chart, x-axes show age. Points plotted on vertical lines corresponding to completed age (in months, or years) y-axis: • y-axes show length/height, weight, or BMI. Points plotted on or between horizontal lines corresponding to length/height, weight or BMI as precisely as possible
  • 14.
    WHO GROWTH CHART •Growth curves are constructed using Box Cox Power Exponential Method (BCPE) along with curve smoothing by cubic splines.
  • 18.
    Cut off values…… •WHO growth standards are based on healthy children living in optimal conditions so more extreme cutoffs are used to identify nutrition risk. • WHO charts use 2nd and 98th percentiles as the outermost percentile cutoff values indicating abnormal growth. • CDC use 5th and 95th percentile as cut off values.
  • 19.
    Interpretation of growthcurves Suspect Risk, • A child’s growth line crosses a z-score line. • There is a sharp incline or decline in the child’s growth line. • The child’s growth line remains flat (stagnant); i.e. there is no gain in weight or length/height. Normal growth curve runs parallel to the median curve.
  • 20.
    In India…. • Indiahas adopted the new WHO Child Growth Standards (2006) in February 2009 • These standards are available for both boys and girls below 5 years of age. • WHO growth chart has been incorporated with "Mother and Child Protection Card"
  • 23.
    Management • Weight b/wcurves 1 & 3-undernourished,require supplementary feeding at home • Weight below curve 3 - consult the doctor and follow his advice. • Weight below curve 4 - hospitalized for treatment
  • 24.
    USES • Growth monitoring •Diagnostic tool • Planning and policy making • Educational tool • Tool for action • Evaluation • Tool for teaching
  • 25.
    TRIVANDRUM DEVELOPMENT SCALE •Screening tool to test the development delay in children under the age of 2 yrs • Developed by Child Development Centre, SAT, Trivandrum • 17 test items, selected by trial and error from Bayley’s Scale of Infant Development (Baroda norms). • Helps to screen motor, mental, hearing and visual development.
  • 27.
    How to useTDSC ?? • Left end of the horizontal line represents, the age at which 3% of children passed the item and right end represents the age at which 97% of the children passed that item. • Vertical line is drawn from the chronological age • Failure to achieve an item that falls short on the left hand side of vertical line – developmental delay.
  • 28.
    VALIDATION OF TDSC •Done on the sample from coastal Neendakara Panchayath & Baby Well clinic, SAT. (both in community and at hospital) • Out of 1945 children screened 49 showed developmental delay. • Denver Developmental Screening Test (DDST) was used as standard for validation
  • 29.
    TDSC has asensitivity of 66.7% and specificity of 78.8% Currently, used by Anganwadi workers in community field survey. Can be interpreted by any person with minimal training. Needs 5- 7 minutes
  • 30.
    REFERENCES • WHO. WHOchild growth standards. Geneva(Switzerland): WHO;2007 • World Health Organization. Training Course on Child Growth Assessment. Geneva, WHO, 2008 • Park K. Textbook of Preventive and Social Medicine. 23rd edition • AFMC Textbook of Public Health and Community Medicine – 1st edition • Trivandrum Developmental Screening Chart MKC Nair, B George, E Philip
  • 31.

Editor's Notes

  • #3 Introduced the concept while working on malnourished children for growth monitoring
  • #6 Small and unrepresentative sample, high socio economic children 2. Harvard curves data from Caucasian children @ boston 1930 to 1956
  • #7 3. o-23 months, formula fed children CONDUCTED @ OHIO, RESTRICTED GENETIC . GEOGRAPHIC AND SOCIO ECONOMIC BACKGROUND- NCHS
  • #15 cubic splines and fractional polynomials
  • #25 2. Incase of malnutrition aids early detection 3. By grading malnutrition – 4. Visual aid helps to educate mother regarding childs nutritional status 5. Aids health worker in planning intervention 6. Evaluate the effectiveness of corrective measures 7. Educate regarding feeding and diarrhoea