Physical activity guidelines_and_prescho
•
0 likes•121 views

This study examined the association between compliance with physical activity guidelines and obesity rates in 607 Portuguese preschool children aged 4-6 years. Accelerometers were used to measure physical activity, which found over 90% of children met guidelines of 3 hours of total physical activity and 1 hour of moderate to vigorous physical activity per day. The prevalence of overweight and obesity was higher in girls than boys. Not meeting the 1 hour moderate to vigorous physical activity guideline per day was associated with higher obesity rates in girls, but no significant associations were found for boys. This suggests low daily moderate to vigorous physical activity may play a role in weight status for young girls.

Recommended
More Related Content
What's hot
What's hot (19)
Similar to Physical activity guidelines_and_prescho
Similar to Physical activity guidelines_and_prescho (20)
Recently uploaded
Recently uploaded (20)
Physical activity guidelines_and_prescho
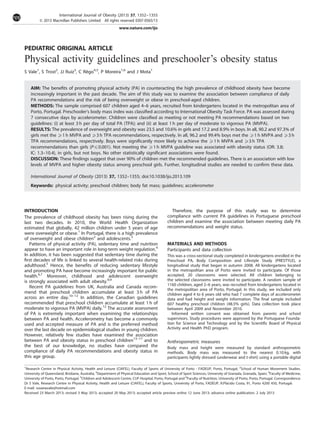
- 1. PEDIATRIC ORIGINAL ARTICLE Physical activity guidelines and preschooler’s obesity status S Vale1 , S Trost2 , JJ Ruiz3 , C Reˆgo4,5 , P Moreira1,6 and J Mota1 AIM: The benefits of promoting physical activity (PA) in counteracting the high prevalence of childhood obesity have become increasingly important in the past decade. The aim of this study was to examine the association between compliance of daily PA recommendations and the risk of being overweight or obese in preschool-aged children. METHODS: The sample comprised 607 children aged 4–6 years, recruited from kindergartens located in the metropolitan area of Porto, Portugal. Preschooler’s body mass index was classified according to International Obesity Task Force. PA was assessed during 7 consecutive days by accelerometer. Children were classified as meeting or not meeting PA recommendations based on two guidelines: (i) at least 3 h per day of total PA (TPA); and (ii) at least 1 h per day of moderate to vigorous PA (MVPA). RESULTS: The prevalence of overweight and obesity was 23.5 and 10.6% in girls and 17.2 and 8.9% in boys. In all, 90.2 and 97.3% of girls met the X1 h MVPA and X3 h TPA recommendations, respectively. In all, 96.2 and 99.4% boys met the X1 h MVPA and X3 h TPA recommendations, respectively. Boys were significantly more likely to achieve the X1 h MVPA and X3 h TPA recommendations than girls (Pp0.001). Not meeting the X1 h MVPA guideline was associated with obesity status (OR: 3.8; IC: 1.3–10.4), in girls, but not boys. No other statistically significant associations were found. DISCUSSION: These findings suggest that over 90% of children met the recommended guidelines. There is an association with low levels of MVPA and higher obesity status among preschool girls. Further, longitudinal studies are needed to confirm these data. International Journal of Obesity (2013) 37, 1352–1355; doi:10.1038/ijo.2013.109 Keywords: physical activity; preschool children; body fat mass; guidelines; accelerometer INTRODUCTION The prevalence of childhood obesity has been rising during the last two decades. In 2010, the World Health Organization estimated that globally, 42 million children under 5 years of age were overweight or obese.1 In Portugal, there is a high prevalence of overweight and obese children2 and adolescents.3 Patterns of physical activity (PA), sedentary time and nutrition appear to have an important role in long-term weight regulation.4 In addition, it has been suggested that sedentary time during the first decades of life is linked to several health-related risks during adulthood.5 Hence, the benefits of reducing sedentary lifestyle and promoting PA have become increasingly important for public health.6,7 Moreover, childhood and adolescent overweight is strongly associated with adult obesity.8,9 Recent PA guidelines from UK, Australia and Canada recom- mend that preschool children accumulate at least 3 h of PA across an entire day.10–12 In addition, the Canadian guidelines recommended that preschool children accumulate at least 1 h of moderate to vigorous PA (MVPA) daily.12 The accurate assessment of PA is extremely important when examining the relationships between PA and health. Accelerometry has become a commonly used and accepted measure of PA and is the preferred method over the last decade on epidemiological studies in young children. However, relatively few studies have examined the association between PA and obesity status in preschool children13–17 and to the best of our knowledge, no studies have compared the compliance of daily PA recommendations and obesity status in this age group. Therefore, the purpose of this study was to determine compliance with current PA guidelines in Portuguese preschool children and examine the association between meeting daily PA recommendations and weight status. MATERIALS AND METHODS Participants and data collection This was a cross-sectional study completed in kindergartens enrolled in the Preschool PA, Body Composition and Lifestyle Study (PRESTYLE), a longitudinal study that began in autumn 2008. All kindergartens located in the metropolitan area of Porto were invited to participate. Of those accepted, 20 classrooms were selected. All children belonging to the selected classrooms were invited to participate. A random sample of 1160 children, aged 2–6 years, was recruited from kindergartens located in the metropolitan area of Porto, Portugal. In this study, we included only children aged 4 to 6 years old who had 7 complete days of accelerometer data and had height and weight information. The final sample included 607 healthy preschool children (48.5% girls). Data collection took place between April 2009 and November 2010. Informed written consent was obtained from parents and school supervisors. Study procedures were approved by the Portuguese Founda- tion for Science and Technology and by the Scientific Board of Physical Activity and Health PhD program. Anthropometric measures Body mass and height were measured by standard anthropometric methods. Body mass was measured to the nearest 0.10 kg, with participants lightly dressed (underwear and t-shirt) using a portable digital 1 Research Centre in Physical Activity, Health and Leisure (CIAFEL), Faculty of Sports of University of Porto - FADEUP, Porto, Portugal; 2 School of Human Movement Studies. University of Queensland, Brisbane, Australia; 3 Department of Physical Education and Sport, School of Sport Sciences, University of Granada, Granada, Spain; 4 Faculty of Medicine, University of Porto, Porto, Portugal; 5 Children and Adolescent Centre, CUF Hospital, Porto, Portugal and 6 Faculty of Nutrition, University of Porto, Porto, Portugal. Correspondence: Dr S Vale, Research Centre in Physical Activity, Health and Leisure (CIAFEL), Faculty of Sports, University of Porto, FADEUP, R.Pla´cido Costa, 91, Porto 4200 450, Portugal. E-mail: susanavale@hotmail.com Received 23 March 2013; revised 3 May 2013; accepted 20 May 2013; accepted article preview online 12 June 2013; advance online publication, 2 July 2013 International Journal of Obesity (2013) 37, 1352–1355 & 2013 Macmillan Publishers Limited All rights reserved 0307-0565/13 www.nature.com/ijo
- 2. scale (Tanita Inner Scan BC 532, Tokyo, Japan). Height was measured to the nearest millimetre in bare or stocking feet with children standing upright against a Holtain portable stadiometer (Tanita). The measurements were repeated twice and the average was recorded. Body mass index was calculated as body mass (kg) divided by height (m) squared and was classified according to the International Obesity Task Force.18 Physical activity Daily PA was measured using the ActiGraph GT1M accelerometer, (Pensacola, FL, USA). This accelerometer provides output in activity counts, which gives information about the intensity of PA.19 Alternatively, accelerometer output can be interpreted using specific cut-points, which identify time in different intensities of PA. Data reduction, cleaning and analyses of accelerometer data were performed using a specially written program described and used previously.20,21 Data were analysed using specific pediatric cut-points, which have been validated for young children: X101 c.p.m. for active time (total PA time (TPA)) and X1680 c.p.m. for moderate to vigorous PA.22–24 For the purpose of this study, the epoch duration or sampling period was set to 5 s, which is more accurate for the spontaneous and intermittent activities of children as used previously with a similar sample.25 A minimum of 10 h of data per day was required for analysis. Parents were instructed to attach the accelerometer when the child awoke and to remove it when they went to bed. The accelerometer was worn snuggly under clothing on the child’s hip using a fully adjustable elastic waist belt. For TPA, we followed the guidelines of UK recommendations, Australian National Physical Activity Recommendations for children 0–5 years and Canada´ recommendations,10–12 calculating the proportion of children who spent at least 3 h per day active, (X3 h TPA). For MVPA, we calculated the proportion of children who spent at least 1 h per day (X1 h MVPA).12 Parental education Parents’ education was used as a proxy measure of socioeconomic status because it is known that education is positively associated with more health-related knowledge26 and a higher capacity to put it into practice.27 It was defined as the highest level of education from mother or father, respectively. In mono-parental families, the parental education was based on the children’s principal guardian. Parents’ education was based on the Portuguese Educational system a 9 years’ education or less sub secondary level (scored as 1), 10–12 years’ education-secondary level (scored as 2) and higher education (scored as 3). Levels 1, 2 and 3 were considered as low, middle and high education.28 Parental education was negatively associated with daily patterns of PA and guidelines compliance.29 Statistical analyses Means and s.d.’s were calculated to describe children’s characteristics by sex. The comparisons between compliance with daily PA recommenda- tions (Meet versus No Meet) were first evaluated by w2 test and independent t-test. For each sex, the association between weight status and compliance with daily PA recommendations was examined using multinomial regression analysis. Each model was adjusted for age and parental education. Statistical analysis was performed using the SPSS 18.0 software (SPSS Inc., Chicago, IL, USA). The level of significance was set at alpha level of 0.05. RESULTS Table 1 shows descriptive statistics for the PA outcomes by sex. Boys had higher TPA and MVPA than girls (Pp0.001). No significant sex differences were found with regard to body mass index. Among girls, the prevalence of overweight and obesity was 23.5 and 10.6%, respectively. In comparison, the prevalence of over- weight and obesity among boys was lower at 17.2 and 8.9%, respectively; however this difference was of only marginal statistical signficance (P ¼ 0.082). Compliance with PA recommen- dations was significantly higher among boys than in girls. In all, 90.2 and 97.3% of girls met the X1-h MVPA and X3-hTPA recommendations, respectively. In comparison, 96.2 and 99.4% of boys met the X1-h MVPA and X3-h TPA recommendation, respectively (Figure 1). Multinominal regression analysis showed that overweight and obese girls were approximately four times more likely to not meet the X1-h MVPA than their non-overweight counterparts. No other statistically significant associations were found for the variables under study (Table 2). DISCUSSION This study aimed to document compliance with guidelines among Portuguese preschool children and examine the association between compliance of daily PA and MVPA recommendations and obesity status. The key point of this study was that over 90% of children met the recommended guidelines. The findings show that, in girls as young as 4–6 years, low daily MVPA was associated with obesity status. This highlights the potentially important role of daily MVPA in the prevention and maintenance of weight status in young girls. Previous investigations have examined the association between weight status and PA in preschool children. Several cross-sectional studies observed that overweight or obese preschool children have lower PA levels than the normal-weight peers.14,30,31 One study found that children with low-vigorous PA were more likely to be classified as overweight or obese compared with those with high-vigorous PA.16 In a longitudinal study using a Caltrac accelerometer, 103 US children aged 3 to 5 years were measured annually during 8 years. The study found that the Table 1. Sample characteristics Total (n ¼ 607) Girls (n ¼ 170) Boys (n ¼ 172) P-value Age 5.1±0.8 5.0±0.8 5.1±0.8 0.064 Weight 21.1±4.1 20.8±4.0 21.3±4.2 0.142 Height 111.2±7.5 110.2±7.4 112.1±7.5 p0.05 BMI 16.9±2.0 17.1±2.0 16.9±2.0 0.226 TPA (min per week) 295±51 286±50 303±51 p0.001 MVPA (min per week) 96±26 89±23 103±27 p0.001 Abbreviations: BMI, body mass index; X2 h TPA, at least 2 h total physical activity per day each day a week; X3 h TPA, at least 3 h total physical activity per day each day a week; X1 h MTPA, at least 1 h moderate to vigorous physical activity per day each day a week. Bold text indicates significant P values. 97.3 99.4 ≥3hTPA 2.7 0.6 9.8 96.2 3.8 Meet No meet Girls Meet No meet Boys Meet No meet Girls Meet No meet Boys p=0.003p=0.141 ≥1hMVPA 90.2 Figure 1. Prevalence of children that met the recommendations in TPA at least 3 h per day; MVPA at least 1 h per day, by gender. Physical activity and childhood obesity S Vale et al 1353 & 2013 Macmillan Publishers Limited International Journal of Obesity (2013) 1352 – 1355
- 3. final sum of skinfolds was negatively associated with PA over the follow-up period.32 Likewise, in US children, a 3-year follow-up of 4 to 6 years old children showed that higher overall PA, vigorous PA and 5-min bouts of vigorous PA were associated with lower quartile %BF (follow-up).33 Thus, our findings for girls support the hypothesis that higher levels of habitual PA might have a protective role against higher levels of adiposity, even in young ages.34 The null findings observed among boys is difficult to explain. A possible explanation for the differences among sexes may be that our data also showed that girls had higher obesity rates than boys (Pp0.001), which is consistent with most studies of preschool children.35 Our study found that overall, 98.4 and 93.3% of the children met, respectively, the X3 h TPA and X1 h MVPA recommenda- tions. On average, boys were more likely to achieve the recommendations than girls. These results are difficult to compare with other studies because, to the best of our knowledge, no previous study has assessed compliance with current PA recommendations and obesity status in these ages. In this sense, our findings are novel and further studies are needed to understand which of the recommendations better suit health indicators. PA has an enormous potential and should be recognized as a fundamental public health constituent and main factor of a healthy lifestyle. Some recommendations state that children do not need to do PA all at once. It can be accumulated throughout the day, and can include light activity like standing up, moving around and playing. So, there is a need to recognize the factors that influence PA in preschool children and to learn how to help them to be more active. So, we believe that the determination of evidence-based PA guidelines to inform public health profes- sionals, health policy, educators and for knowledge translation to the general public is crucial. The strengths of this study include: our focus on PA levels in preschool children; an assessment of compliance with PA recommendations using an objective PA measure, although it should also be recognized that accelerometers are unable to detect some activities such as swimming and cycling. The 5-s epoch used in this study appears to capture a greater amount of data in preschool children.25 Nevertheless, some limitations of the study should be recognized. The study included preschool children from only one metropolitan area, which makes it difficult to generalize the findings to other samples. Further, because the study was cross-sectional, it is not possible to infer causal relationships using such a cross- sectional design. CONCLUSION The present study showed that over 90% of children met the recommended guidelines for PA. Among girls, failure to meet the daily recommendation for MVPA was associated with obesity status. Longitudinal studies are needed to confirm these findings. CONFLICT OF INTEREST The authors declare no conflict of interest. ACKNOWLEDGEMENTS We thank the children, their parents, as well as the staff from the all kindergartens. This study was supported in part by grants: Portuguese Foundation for Science and Technology—SFRH/BPD/81566/2011, PTDC/DES/098309/2008, PEst-OE/SAU/UI0617/ 2011 and Spanish Ministry of Science and Innovation—RYC-2010-05957. REFERENCES 1 WHO. Childhood overweight and obesity. Childhood overweight and obesity. In 2011. 2 Vale S, Santos R, Soares-Miranda L, Reˆgo C, Moreira P, Mota J. Prevalence of overweight and obesity among Portuguese preschoolers. Archives of Exercise in Health and Disease 2011; 2: 65–68. 3 Sardinha LB, Santos R, Vale S, Silva AM, Ferreira JP, Raimundo AM et al. Prevalence of overweight and obesity among Portuguese youth: a study in a representative sample of 10-18-year-old children and adolescents. Int J Pediatr Obes 2011; 6: 124–128. 4 Bouchard C. The obesity epidemic: Introduction. In: Kinetics H (ed). Physical Activity and Obesity. Champaign, IL, USA, 2000, pp 3–20. 5 Twisk JW, Kemper HC, van Mechelen W, Post GB. Tracking of risk factors for coronary heart disease over a 14-year period: a comparison between lifestyle and biologic risk factors with data from the Amsterdam Growth and Health Study. Am J Epidemiol 1997; 145: 888–898. 6 Schmidt GJ, Walkuski JJ, Stensel DJ. The Singapore Youth Coronary Risk and Physical Activity Study. Med Sci Sports Exerc 1998; 30: 105–113. 7 WHO. Global Strategy on Diet, Physical Activity and Health. In 2004. 8 Dietz WH. Overweight in childhood and adolescence. N Engl J Med 2004; 350: 855–857. 9 Guo SS, Wu W, Chumlea WC, Roche AF. Predicting overweight and obesity in adulthood from body mass index values in childhood and adolescence. Am J Clin Nutr 2002; 76: 653–658. 10 Departament of Health PA, Health Improvement and Protection. Start Active, Stay Active: a report on physical activity for health from the four home countries. Health Do (ed). London, UK, 2011. 11 Australian G Move and Play Every Day. National Physical Activity Recommenda- tions for Children 0-5 Years. Ageing. Commonwealth of Australia: DoHa, 2010. Table 2. Multinominal regressions showing the association between physical activity guidelines and obesity status in girls and boys Girls Boys OR (95% CI) P-value OR (95% CI) P-value Unadjusted models No meet (X3 h TPA) Overweight 1.2 (0.2–6.6) 0.875 a Obese 2.9 (0.5–17.0) 0.244 a No meet (X1 h MVPA) Overweight 1.1 (0.4–2.8) 0.917 1.7 (0.4–6.4) 0.472 Obese 3.2 (1.2–8.6) 0.020 1.0 (0.1–8.6) 0.973 Adjusted models No meet (X3 h TPA) Overweight 1.0 (0.2–5.4) 0.947 a Obese 2.5 (0.4–15.1) 0.328 a No meet (X1 h MVPA) Overweight 1.2 (0.4–3.2) 0.780 1.5 (0.3–7.7) 0.635 Obese 3.8 (1.3–10.4) 0.012 1.3 (0.1–11.1) 0.836 Abbreviations: X3 h TPA, at least 3 h total physical activity; X1 h MTPA, at least 1 h moderate to vigorous physical activity. All analyses were adjusted for parental education. a No information. Bold text indicates significant P values. Physical activity and childhood obesity S Vale et al 1354 International Journal of Obesity (2013) 1352 – 1355 & 2013 Macmillan Publishers Limited
- 4. 12 Tremblay MS, Leblanc AG, Carson V, Choquette L, Connor Gorber S, Dillman C et al. Canadian Physical Activity Guidelines for the Early Years (aged 0-4 years). Appl Physiol Nutr Metab 2012; 37: 345–356. 13 Reilly JJ, Armstrong J, Dorosty AR, Emmett PM, Ness A, Rogers I et al. Early life risk factors for obesity in childhood: cohort study. BMJ 2005; 330: 1357. 14 Trost SG, Sirard JR, Dowda M, Pfeiffer KA, Pate RR. Physical activity in overweight and nonoverweight preschool children. Int J Obes Relat Metab Disord 2003; 27: 834–839. 15 Janz KF, Levy SM, Burns TL, Torner JC, Willing MC, Warren JJ. Fatness, physical activity, and television viewing in children during the adiposity rebound period: the Iowa Bone Development Study. Preventive Medicine 2002; 35: 563–571. 16 Vale S, Santos R, Soares-Miranda L, Moreira C, Ruiz JR, Mota J. Objectively measured physical activity and body mass index in preschool children. Interna- tional Journal of Pediatrics 2010; 2010: doi:10.1155/2010/479439. 17 Espana-Romero V, Mitchell JA, Dowda M, O’Neill JR, Pate RR. Objectively measured sedentary time, physical activity and markers of body fat in preschool children. Pediatr Exerc Sci 2013; 25: 154–163. 18 Cole T, Bellizzi M, Flegal K, Dietz W. Establishing a standard definition for child overweight and obesity worldwide: international survey. Bmj 2000; 320: 1240–1243. 19 Janz KF. Validation of the CSA accelerometer for assessing children’s physical activity. Med Sci Sports Exerc 1994; 26: 369–375. 20 Sardinha LB, Baptista F, Ekelund U. Objectively measured physical activity and bone strength in 9-year-old boys and girls. Pediatrics 2008; 122: e728–e736. 21 Purslow LR, Hill C, Saxton J, Corder K, Wardle J. Differences in physical activity and sedentary time in relation to weight in 8-9 year old children. Int J Behav Nutr Phys Act 2008; 5: 67. 22 Evenson KR, Catellier DJ, Gill K, Ondrak KS, McMurray RG. Calibration of two objective measures of physical activity for children. J Sports Sci 2008; 26: 1557–1565. 23 Trost SG, Loprinzi PD, Moore R, Pfeiffer KA. Comparison of accelerometer cut points for predicting activity intensity in youth. Med Sci Sports Exerc 2011; 43: 1360–1368. 24 Pate RR, Almeida MJ, McIver KL, Pfeiffer KA, Dowda M. Validation and calibration of an accelerometer in preschool children. Obesity (Silver Spring) 2006; 14: 2000–2006. 25 Vale S, Santos R, Miranda L, Silva P, Mota J. Preschool children physical activity measurement: importance of epoch length choice. Pediatr Exerc Sci 2009; 21: 413–420. 26 Tur JA, Serra-Majem L, Romaguera D, Pons A. Profile of overweight and obese people in a Mediterranean region. Obes Res 2005; 13: 527–536. 27 Ball K, Crawford D. Socio-economic factors in obesity: a case of slim chance in a fat world? Asia Pac J Clin Nutr 2006; 15 (Suppl): 15–20. 28 Mota J, Silva G. Adolescents` physical activity with socio-economic status and parental participation among a Portuguese sample. Sport, education and Society 1999; 4: 193–199. 29 Vale S, Ricardo N, Soares-Miranda L, Santos R, Moreira C, Mota J. Parental Education and Physical Activity in Pre-School Children. Child: Care, Health and Development doi:10.1111/cch.12041. 30 Jago R, Baranowski T, Baranowski JC, Thompson D, Greaves KA. BMI from 3-6 y of age is predicted by TV viewing and physical activity, not diet. Int J Obes (Lond) 2005; 29: 557–564. 31 Metallinos-Katsaras ES, Freedson PS, Fulton JE, Sherry B. The association between an objective measure of physical activity and weight status in preschoolers. Obesity (Silver Spring) 2007; 15: 686–694. 32 Moore LL, Gao D, Bradlee ML, Cupples LA, Sundarajan-Ramamurti A, Proctor MH et al. Does early physical activity predict body fat change throughout childhood? Preventive Medicine 2003; 37: 10–17. 33 Janz KF, Burns TL, Levy SM. Tracking of activity and sedentary behaviors in childhood: the Iowa Bone Development Study. American journal of preventive medicine 2005; 29: 171–178. 34 Jimenez-Pavon D, Kelly J, Reilly JJ. Associations between objectively measured habitual physical activity and adiposity in children and adolescents: Systematic review. International Journal of Pediatric Obesity 2010; 5: 3–18. 35 Addo OY, Himes JH. Reference curves for triceps and subscapular skinfold thicknesses in US children and adolescents. Am J Clin Nutr 2010; 91: 635–642. Physical activity and childhood obesity S Vale et al 1355 & 2013 Macmillan Publishers Limited International Journal of Obesity (2013) 1352 – 1355