Example hypothesistesting
•Download as DOC, PDF•
0 likes•1,620 views

This document discusses 12 versions of hypothesis testing examples related to analyzing changes in the average height of female college freshmen. Each version provides sample data and tests whether there is sufficient evidence to believe if the average height has changed. Key differences between versions include the alternative hypothesis being tested, sample size, confidence level, and whether population data is known. Later versions also discuss calculating p-values and determining suitable sample sizes.

Recommended
More Related Content
What's hot
What's hot (20)
Similar to Example hypothesistesting
Similar to Example hypothesistesting (20)
Recently uploaded
Recently uploaded (20)
Example hypothesistesting
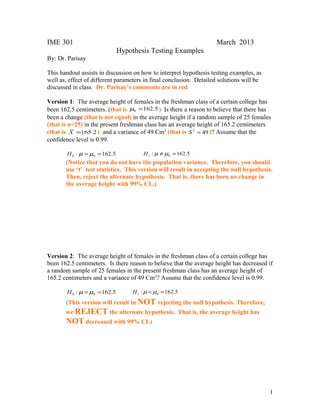
- 1. IME 301 March 2013 Hypothesis Testing Examples By: Dr. Parisay This handout assists in discussion on how to interpret hypothesis testing examples, as well as, effect of different parameters in final conclusion. Detailed solutions will be discussed in class. Dr. Parisay’s comments are in red Version 1: The average height of females in the freshman class of a certain college has been 162.5 centimeters. (that is 162.5 0 m = ) Is there a reason to believe that there has been a change (that is not equal) in the average height if a random sample of 25 females (that is n=25) in the present freshman class has an average height of 165.2 centimeters (that is X =165.2 ) and a variance of 49 Cm2 (that is S 2 = 49 )? Assume that the confidence level is 0.99. : 162.5 0 0 H m =m = : 162.5 1 0 H m ¹m = (Notice that you do not have the population variance. Therefore, you should use ‘t’ test statistics. This version will result in accepting the null hypothesis. Then, reject the alternate hypothesis. That is, there has been no change in the average height with 99% CL.) Version 2: The average height of females in the freshman class of a certain college has been 162.5 centimeters. Is there reason to believe that the average height has decreased if a random sample of 25 females in the present freshman class has an average height of 165.2 centimeters and a variance of 49 Cm2? Assume that the confidence level is 0.99. : 162.5 0 0 H m =m = : 162.5 1 0 H m <m = (This version will result in NOT rejecting the null hypothesis. Therefore, we REJECT the alternate hypothesis. That is, the average height has NOT decreased with 99% CL) 1
- 2. Version 3: The average height of females in the freshman class of a certain college has been 162.5 centimeters. Is there a reason to believe that there has been a change in the average height if a random sample of 25 females in the present freshman class has an average height of 165.2 centimeters and a variance of 49 Cm2? Assume that the confidence level is 0.9. : 162.5 0 0 H m =m = : 162.5 1 0 H m ¹m = (This version will result in rejecting the null hypothesis. Then, accept the alternate hypothesis. That is, there has been a change in the average height with 90% CL.) Version 4: The average height of females in the freshman class of a certain college has been 162.5 centimeters. Is there a reason to believe that there has been a change in the average height if a random sample of 61 females in the present freshman class has an average height of 165.2 centimeters and a variance of 49 Cm2? Assume that the confidence level is 0.99. : 162.5 0 0 H m =m = : 162.5 1 0 H m ¹m = (This version will result in rejecting the null hypothesis. Then, accept the alternate hypothesis. That is, there has been a change in the average height with 99% CL.) Version 5: The average height of females in the freshman class of a certain college has been 162.5 centimeters. Is there a reason to believe that there has been a change in the average height if a random sample of 25 females in the present freshman class has an average height of 165.2 centimeters and a variance of 16 Cm2? Assume that the confidence level is 0.99. : 162.5 0 0 H m =m = : 162.5 1 0 H m ¹m = (This version will result in rejecting the null hypothesis. Then, accept the alternate hypothesis. That is, there has been a change in the average height with 99% CL.) Questions: 2
- 3. Compare Version 1 and Version 2. What is the difference in problem information/statement and conclusion? Compare Version 1 and Version 3. What is the difference in problem information and conclusion? Compare Version 1 and Version 4. What is the difference in problem information and conclusion? Compare Version 1 and Version 5. What is the difference in problem information and conclusion? 3
- 4. Version 6: The average height of females in the freshman class of a certain college has been 162.5 centimeters with a standard deviation of 6.9 centimeters (that is s = 6.9 ) . Is there reason to believe that there has been a change in the average height if a random sample of 61 females in the present freshman class has an average height of 165.2 centimeters? Assume that the confidence level is 0.99. : 162.5 0 0 H m =m = : 162.5 1 0 H m ¹m = (We have population’s variance, as well as, Central Limit Theorem will hold as n>30, variance is known, it is two sided hypothesis testing for mean, and should use ‘Z’ test statistics. It will result in rejecting null hypothesis.) Version 7: The average height of females in the freshman class of a certain college has been 162.5 centimeters with a standard deviation of 6.9 centimeters. Is there reason to believe that the average height is increased if a random sample of 61 females in the present freshman class has an average height of 165.2 centimeters? Assume that the confidence level is 0.99. : 162.5 0 0 H m =m = : 162.5 1 0 H m >m = (We perform ‘Z’ test. This version will result in rejecting the null hypothesis. Therefore, we accept the alternate hypothesis.) Questions: Compare Version 1 and Version 6. What is the difference in problem information and conclusion? Compare Version 6 and Version 7. What is the difference in problem information and conclusion? 4
- 5. Version 9: The average height of females in the freshman class of a certain college has been 162.5 centimeters. Is there a reason to believe that there has been a change in the average height if a random sample of 25 females in the present freshman class has an average height of 165.2 centimeters and a variance of 49 Cm2? Use a P-value for your conclusion : 162.5 0 0 H m =m = : 162.5 1 0 H m ¹m = (That is, find P-value and discuss any significance level less than that will result in not rejecting the null hypothesis. Another approach is to check if P-value is small, let’s say less than 1%, then reject null hypothesis. The reason is that usually significance level will be more than 5%. However, if P-value is large, let’s say more than 10%, do not reject the null hypothesis.). Questions: Compare Version 1 and Version 9. What is the difference in problem information and conclusion? Version 11: The average height of females in the freshman class of a certain college has been 162.5 centimeters with a standard deviation of 6.9 centimeters. Is there reason to believe that there has been a change in the average height if a random sample of 36 females in the present freshman class has an average height of 165.2 centimeters? Assume that the confidence level is 0.99. What will be the type II error if the mean of population is in fact 163 centimeters? : 162.5 0 0 H m =m = : 162.5 1 0 H m ¹m = (We have population’s variance, as well as, Central Limit Theorem will hold as n>30. It is two sided hypothesis testing for mean. We should use ‘Z’ test statistics. It will result in accepting null hypothesis.) 5
- 6. Version 12: The average height of females in the freshman class of a certain college has been 162.5 centimeters with a standard deviation of 6.9 centimeters. We would like to collect a sample to test if there has been a change in the average height to 163 cm. What is a suitable sample size for this test? Assume we would like a confidence level of 0.99 with type II error of 20%. : 162.5 0 0 H m =m = : 162.5 1 0 H m ¹m = 6
- 7. Version 12: The average height of females in the freshman class of a certain college has been 162.5 centimeters with a standard deviation of 6.9 centimeters. We would like to collect a sample to test if there has been a change in the average height to 163 cm. What is a suitable sample size for this test? Assume we would like a confidence level of 0.99 with type II error of 20%. : 162.5 0 0 H m =m = : 162.5 1 0 H m ¹m = 6